HOUSING ELEMENT - City of Dunedin
←
→
Page content transcription
If your browser does not render page correctly, please read the page content below
HOUSING ELEMENT
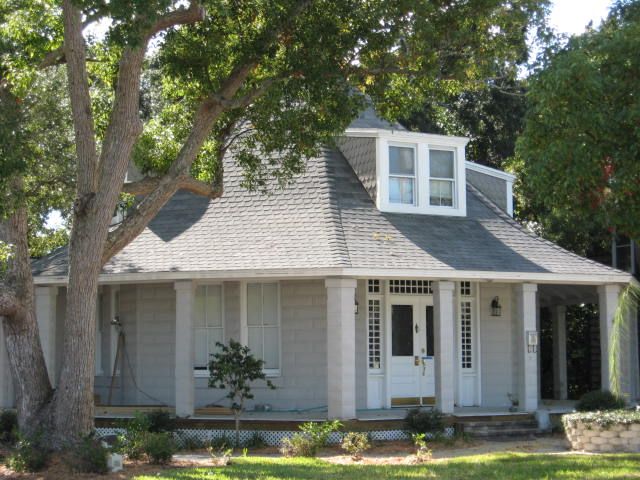
TABLE OF CONTENTS
Introduction                                                                  1
Inventory                                                                     1
Analysis                                                                     18
Projections                                                                  30
Planning Area Analysis                                                       33
Summary                                                                      34
Appendix                                                                     35

LIST OF TABLES
1    Total Housing Units (Occupied and Vacant)                               2
2    Tenure Characteristics of the Housing Stock                             3
3    Monthly Contract Rent of Renter-Occupied Units                          4
4    Value of Owner-Occupied Housing                                         5
5    Monthly Owner Costs of Owner-Occupied Housing Units                     6
6    Household Income in 1999 by Gross Rent as Percentage of Income          7
7    Household Income in 1999 by Selected Monthly Owner Costs as a
     Percentage of Income                                                     8
8    Statistics Relating to the Condition of the Housing Stock                9
9    2007 Structural Condition of Housing                                     9
10   Mobile Home Parks                                                       15
11   Affordable Housing Inventory                                            16
12   Whispering Hills Apartments                                             17
13   Palm Lake Village                                                       18
14   Group Homes, City of Dunedin and Planning Area                          19
15   Historically Significant Housing                                        20
16   Annual Income by Household Size as a Function of AMI, 2005              22
17   Cost Burden by Household Income                                         23
18   Permanent Population Comparison                                         31
19   Projected Cost Burden by Household Income                               31
20   Total Housing Units (Occupied and Vacant), Enclaves and Planning Area   33
21   2007 Structural Condition of Housing, Enclaves and Planning Area        34
22   Structures Appraisal Worksheet                                          36

LIST OF FIGURES
1    Year Structure Built: City of Dunedin                                    1
2    Year Structure Build: Pinellas County                                    1
3    Mobile Home Developments                                                11
4    Public and Subsidized Housing                                           12
5    Group Homes                                                             13
6    Historically Significant Housing                                        14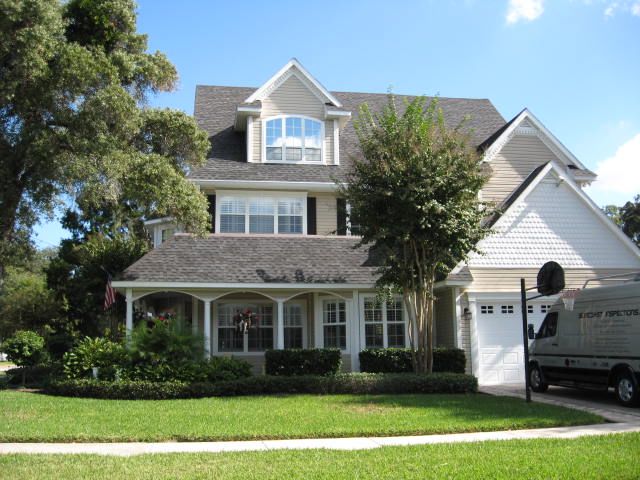
Introduction
         The Housing Element is designed to inventory the current housing situation, examine the
availability of affordable housing, and project the number of households anticipated through the
year 2025. Because of the detail available, much of this information comes from the 2000 Census.
While this is not ideal due to being closer to the next decennial census year than the previous one,
this is the only source for much of the data. It has been updated where available with more recent
data.
         While levels of service are not proffered here, a good bit of the discussion centers on rising
housing prices and the issue of affordable housing.

Inventory
         Tables 1 through 9 and Figures 1 and 2 summarize the housing situation in the City of
Dunedin and Pinellas County. The City is primarily residential, with an estimated 20,941 residen-
tial units available, as of 2006. It should be noted that within the Census figures, there are slight
discrepancies between totals, depending on the characteristic being described. For example, the
total for the “Year Structure Built” is 20,112; the total for “Total Housing Units” is 19,952. If un-
derstood correctly, this apparently is due to sampling error. The percentages shown in the tables
will be based on the respective totals for that characteristic. The same also apparently applies to the
Pinellas County figures as well.

                                 Fig ure 1
                   Ye ar Structure B uilt: City of Dun e d in
                                                                                                      1950 t o 1959; 2,657; 13%
     1970 to 1979; 6,677; 33%                                  1960 to 1969; 3, 986; 20%

                                                                                                          1940 to 1949; 536; 3%

                                                                                                                 1939 or ear l i er ; 521; 3%

                                                                                                         1999 t o M ar ch 2000; 168; 1%
               1980 t o 1989; 4, 225; 21%
                                              1990 t o 1994; 880; 4%                                                                                      The Octagon House is one of the
                                                                              1995 to 1998; 462; 2%
                                                                                                                                                          many historic houses in Dunedin.
    Source: 2000 US Census

                                                                                                             Figu re 2
                                                                                            Year S tru ctu re Bu ilt: Pinellas Cou nty

                                                                                                                                    Bui l t 1960 to 1969; 82,531; 17%
                                                                                Bui l t 1970 to 1979; 135,332;                                                                                  Bui l t 1950 to 1959; 76,485; 16%
                                                                                            28%

                                                                                                                                                                                                         Bui l t 1940 to 1949; 18,382; 4%

                                                                                                                                                                                                                    Bui l t 1939 or ear l i er ; 19,753;
                                                                                                                                                                                                                                    4%

                                                                                                                                                                                                               Bui l t 1999 to Mar ch 2000;
                                                                                                                                                                                                                        4,017; 1%

                                                                                     Bui l t 1980 to 1989; 102,367;
                                                                                                   21%                                                                      Bui l t 1995 to 1998; 17,253; 4%
                                                                                                                                         Bui l t 1990 to 1994; 25,453; 5%

                                                                             Source: 2000 US Census

1                                           DUNEDIN 2025-THE COMPREHENSIVE PLAN
Adopted 12/18/08                                      Housing Element
Ordinance 08-08
Amendment 08-1ER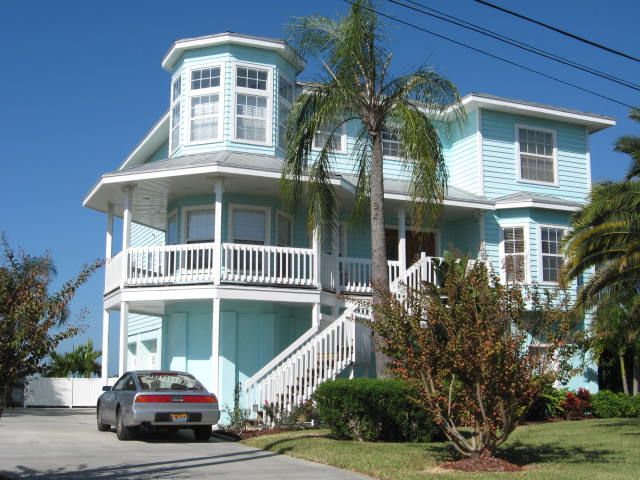
TABLE 1
                           TOTAL HOUSING UNITS (OCCUPIED AND VACANT)

            TYPE                            CITY OF DUNEDIN                         PINELLAS COUNTY

                               1980         1990          2000            2006             2000

    Single Family                7,721        8,870        10,987         11,560                  261,008

    Multi-Family                 5,910        8,016         6,647          6,927                  154,944

    Duplex                     N/A           N/A              716            734                   14,258

    Triplex                    N/A          N/A           N/A             N/A              N/A

    Mobile Home                 1,3891       1,8251        1,7621          1,720                  50,2641

    Total                      15,020       18,411         20,112         20,9412            481,57333
    1
     The Census classifies many mobile homes with additions as single family residences.
    2
     Based on lot count within Mobile Home parks.
    3
     Pinellas County total includes 1,099 units in the “Boat, RV, van, etc.” category.
    Source: 2000 US Census

        Although of new construction, this house was built to look like
        an older historic house.

2                    DUNEDIN 2025-THE COMPREHENSIVE PLAN
Adopted 12/18/08               Housing Element
Ordinance 08-08
Amendment 08-1ER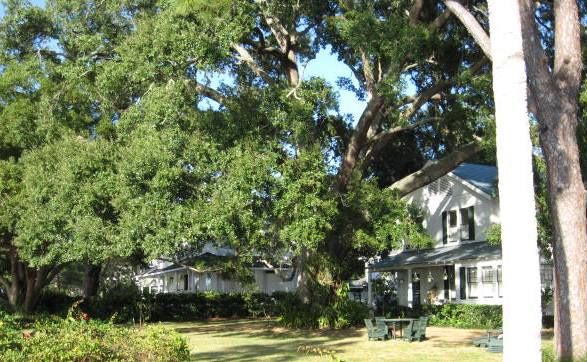
TABLE 2
                               TENURE CHARACTERISTICS OF HOUSEHOLDS

                         TENURE                               CITY OF DUNEDIN              PINELLAS COUNTY

                                                           NUMBER        PERCENT         NUMBER         PERCENT
    Total                                                      17,386                        414,968
    Owner occupied                                             12,478                        293,866
     White alone                                               12,217           97.91        272,204          92.63
     Black or African American alone                              116            0.93         13,773           4.69
     American Indian and Alaska Native alone                         0           0.00            605           0.21
     Asian alone                                                   19            0.15          3,535           1.20
     Native Hawaiian and Other Pacific Islander alone                0           0.00              60          0.02
     Some other race alone                                         24            0.19          1,163           0.40
     Two or more races                                            102            0.82          2,526           0.86
    Renter occupied                                             4,908                        121,102
     White alone                                                4,548           92.67         98,621          81.44
     Black or African American alone                              126            2.57         15,600          12.88
     American Indian and Alaska Native alone                       22            0.45            514           0.42
     Asian alone                                                   86            1.75          2,222           1.83
     Native Hawaiian and Other Pacific Islander alone                0           0.00              72          0.06
      Some other race alone                                        55            1.12          1,785           1.47
      Two or more races                                            71            1.45          2,288           1.89
    Source: 2000 US Census

                               This house, in the floodplain, has been built so that the first floor is elevated
                               above the elevation at which it would be flooded.

3                     DUNEDIN 2025-THE COMPREHENSIVE PLAN
Adopted 12/18/08                Housing Element
Ordinance 08-08
Amendment 08-1ER
TABLE 3
        MONTHLY CONTRACT RENT OF RENTER-OCCUPIED UNITS

MONTHLY CONTRACT         CITY OF DUNEDIN    PINELLAS COUNTY
     RENT
                         NUMBER   PERCENT   NUMBER      PERCENT
Less than $100             36        .73     1,543         1.27
$100 to $149              212       4.32     2,310         1.91

$150 to $199              142       2.89     1,730         1.43
$200 to $249              149       3.04     2,130         1.76
$250 to $299               60       1.22     3,444         2.85
$300 to $349              188       3.83     6,148         5.08
$350 to $399              327       6.66     8,432         6.97
$400 to $449              501       10.21   12,971        10.72
$450 to $499              732       14.91   13,281        10.97
$500 to $549              724       14.75   12,799        10.58
$550 to $599              530       10.80   11,778         9.73
$600 to $649              426       8.68     9,424         7.79
$650 to $699              158       3.22     7,425         6.13
$700 to $749              138       2.81     5,013         4.14
$750 to $799               33       0.67     3,744         3.09

$800 to $899              156       3.18     4,857         4.01

$900 to $999               51       1.04     2,833         2.34
$1,000 to $1,499           85       1.73     4,135         3.42

$1,500 to $1,999           65       1.32     1,615         1.33

$2,000 or more             0         0       815           .67

No cash rent              195       3.97     4,602         3.80

Median                    $501      N/A      $524          N/A

Source: 2000 US Census

                                              Although
                                              simple in de-
                                              sign,      this
                                              older house
                                              has a very
                                              appealing
                                              architecture.

    4                     DUNEDIN 2025-THE COMPREHENSIVE PLAN
    Adopted 12/18/08                Housing Element
    Ordinance 08-08
    Amendment 08-1ER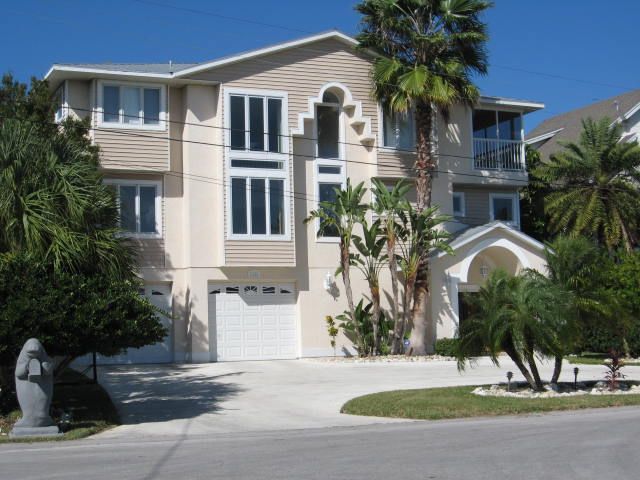
TABLE 4
                 VALUE OF OWNER-OCCUPIED HOUSING

 VALUE OF OWNER-
 OCCUPIED HOUSING                    DWELLING UNITS
      UNITS

                          CITY OF DUNEDIN      PINELLAS COUNTY

                         NUMBER    PERCENT    NUMBER     PERCENT

Less than $10,000            17        0.19     9,763        3.32
$10,000 to $14,999           26        0.29     4,317        1.47

$15,000 to $19,999            9        0.10     4,169        1.42

$20,000 to $24,999           18        0.20     4,311        1.47
                                                                    Victoria Drive has many historic homes,
$25,000 to $29,999           41        0.46     4,940        1.68   some dating back to the late 1800s.

$30,000 to $34,999           82        0.93     6,118        2.08

$35,000 to $39,999          123        1.39     7,009        2.39

$40,000 to $49,999          291        3.29    16,802        5.72

$50,000 to $59,999          374        4.23    22,294        7.59

$60,000 to $69,999          746        8.44    26,123        8.89

$70,000 to $79,999          946       10.70    26,424        8.99

$80,000 to $89,999         1,052      11.90    26,107        8.88

$90,000 to $99,999         1,197      13.54    20,968        7.14

$100,000 to $124,999       1,330      15.04    31,626       10.76

$125,000 to $149,999        758        8.57    24,415        8.31

$150,000 to $174,999        456        5.16    15,676        5.33

$175,000 to $199,999        326        3.69    10,173        3.46

$200,000 to $249,999        468        5.29    10,776        3.67

$250,000 to $299,999        300        3.39     7,608        2.59

$300,000 to $399,999        130        1.47     6,730        2.29

$400,000 to $499,999         54        0.61     2,965        1.01

$500,000 to $749,999         75        0.85     2,569        0.87

$750,000 to $999,999          0        0.00     1,070        0.36

$1,000,000 or more           23        0.26        916       0.31

Median                   $95,800     N/A      $96,500     N/A
Source: 2000 US Census

     5                    DUNEDIN 2025-THE COMPREHENSIVE PLAN
      Adopted 12/18/08              Housing Element
      Ordinance 08-08
      Amendment 08-1ER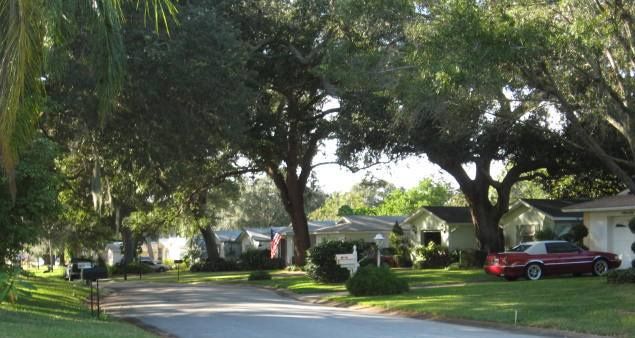
These      town-
                                              homes       were
                                              built on a lim-
                                              ited size lot.
                                              Their style re-
                                              flects a higher-
                                              density, in-town
                                              type of design.

                                                   TABLE 5
                              MONTHLY OWNER COSTS OF OWNER-OCCUPIED HOUSING UNITS
                             MORTGAGE STATUS AND     CITY OF DUNEDIN      PINELLAS COUNTY
                               SELECTED MONTHLY
                                  OWNER COSTS        NUMBER PERCENT NUMBER PERCENT
                            With a mortgage              5,976    67.59    148,086    71.24
                            Less than $200                  10     0.17        105     0.07
                              $200 to $299                   8     0.13        745     0.50
                              $300 to $399                  60     1.00      2,373     1.60
                              $400 to $499                 154     2.58      5,938     4.01
                              $500 to $599                 411     6.88     10,254     6.92
                              $600 to $699                 558     9.34     15,129    10.22
                              $700 to $799                 778    13.02     17,043    11.51
                              $800 to $899                 694    11.61     16,329    11.03
                              $900 to $999                 619    10.36     13,671     9.23
                              $1,000 to $1,499           1,645    27.53     39706     26.81
                              $1,500 to $1,999             655    10.96     14,566     9.84
                              $2,000 to $2,499             196     3.28      5,514     3.72
                              $2,500 to $2,999             107     1.79      3,073     2.08
                              $3,000 or more                81     1.36      3,640     2.46
                              Median                      $951   N/A       $945      N/A
                            Without a mortgage           2,866    32.41     59,790    28.76
                              Less than $100                34     1.19        649     1.09
                              $100 to $149                  69     2.41      2,029     3.39
                              $150 to $199                 293    10.22      5,957     9.96
                              $200 to $249                 529    18.46      9,713    16.25
                              $250 to $299                 518    18.07     10,338    17.29
                              $300 to $399                 752    26.24     14159     23.68
                              $400 to $499                 307    10.71      7,214    12.07
                              $500 to $699                 274     9.56       5937     9.93
                              $700 or more                  90     3.14       3794     6.35
                              Median                      $299   N/A       $307      N/A
                            Source: 2000 US Census

6                  DUNEDIN 2025-THE COMPREHENSIVE PLAN
Adopted 12/18/08             Housing Element
Ordinance 08-08
Amendment 08-1ER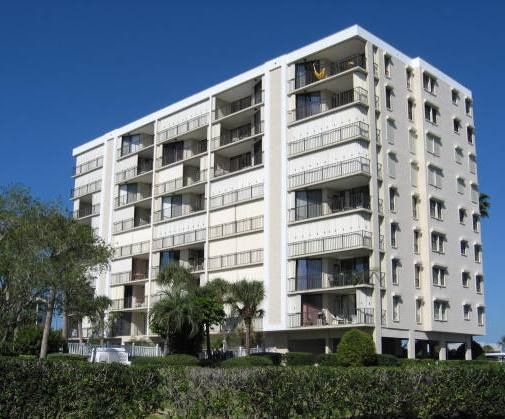
MacAlpine Apartments, built in the late 1990s, created almost an entirely new city, with
nearly 500 units.

                                               TABLE 6
                   HOUSEHOLD INCOME IN 1999 BY GROSS RENT AS PERCENTAGE OF INCOME

                                                 ANNUAL HOUSEHOLD INCOME RANGE

    RENT-TO-INCOME                                                                             $35,000
                            LESS THAN                                $20,000 to $34,999
        RATIO                                  $10,000 - $19,999                               OR MORE
                             $10,000

                         NUMBER PERCENT NUMBER PERCENT NUMBER PERCENT                      NUMBER     PERCENT

City of Dunedin
Less than 20 percent            0       0.00         63       5.18        167      11.13      1,021      75.13
20 to 24 percent               58       6.96         66       5.43        296      19.73       139       10.23
25 to 29 percent               50       6.00        117       9.62        399      26.60        91        6.70
30 to 34 percent               81       9.72        142     11.68         295      19.67        38        2.80
35 percent or more            467     56.06         743     61.10         318      21.20        24        1.77
Not computed                  177     21.25          85       6.99         25       1.67        46        3.38
Total                         833                 1,216                  1,500                1,359
Pinellas County
Less than 20 percent          282       1.55        910       3.76       4,397     12.90     29,956      67.25
20 to 24 percent              459       2.52      1,073       4.44       7,712     22.63      7,825      17.57
25 to 29 percent              694       3.81      2,077       8.59       7,173     21.04      3,139       7.05
30 to 34 percent              804       4.41      2,841     11.75        6,107     17.92      1,067       2.40
35 percent or more         12,484     68.53      16,299     67.39        7,511     22.04      1,226       2.75
Not computed                3,493     19.18         986       4.08       1,186      3.48      1,328       2.98
Total                      18,216                24,186                34,086                44,541
Source: 2000 US Census

7                      DUNEDIN 2025-THE COMPREHENSIVE PLAN
 Adopted 12/18/08                Housing Element
 Ordinance 08-08
 Amendment 08-1ER
This house
                                                   in Baywood
                                                   Shores      is
                                                   one of the
                                                   large     and
                                                   more opu-
                                                   lent    resi-
                                                   dences     in
                                                   the City.

                                                               TABLE 7
                         HOUSEHOLD INCOME IN 1999 BY SELECTED MONTHLY OWNER COSTS AS A PERCENTAGE OF INCOME
                                                                          ANNUAL HOUSEHOLD INCOME RANGE
      OWNER COSTS-       LESS THAN $10,000     $10,000 TO $19,999      $20,000 TO $34,999 $35,000 TO $49,999       $50,000 TO $74,999    $75,000 OR MORE
     TO-INCOME RATIO
                         NUMBER     PERCENT    NUMBER     PERCENT      NUMBER     PERCENT    NUMBER     PERCENT    NUMBER     PERCENT    NUMBER     PERCENT
City of Dunedin
Less than 20 percent            8       1.87        207        22.82        647      39.91        676      41.17      1,424      65.93      1,654      79.37
20 to 24 percent                0       0.00        139        15.33        164      10.12        312      19.00        336      15.56        273      13.10
25 to 29 percent                7       1.64         65         7.17        191      11.78        265      16.14        206       9.54         89       4.27
30 to 34 percent                8       1.87         75         8.27        193      11.91        158       9.62        112       5.19         52       2.50
35 percent or more            357      83.41        421        46.42        426      26.28        231      14.07         82       3.80         16       0.77
Not computed                   48      11.21          0         0.00          0       0.00          0       0.00          0       0.00          0       0.00
Total                         428                   907                   1,621                 1,642                 2,160                 2,084
Pinellas County
Less than 20 percent          257       2.35      4,405        22.40     14,097      36.35     17,219      45.31     28,209      61.01     42,700      78.73
20 to 24 percent              324       2.96      2,238        11.38      4,392      11.32      7,449      19.60      8,724      18.87      6,063      11.18
25 to 29 percent              544       4.97      1,718         8.74      4,629      11.94      5,327      14.02      4,547       9.83      2,877       5.30
30 to 34 percent              448       4.09      1,655         8.42      4,417      11.39      3,392       8.93      2,389       5.17      1,164       2.15
35 percent or more          7,499      68.46      9,648        49.06     11,241      28.98      4,617      12.15      2,367       5.12      1,332       2.46
Not computed                1,882      17.18          0         0.00          7       0.02          0       0.00          0       0.00         99       0.18
Total                      10,954                19,664                  38,783                38,004                46,236                54,235
Source: 2000 US Census

     8                                  DUNEDIN 2025-THE COMPREHENSIVE PLAN
                                                  Housing Element
     Adopted 12/18/08
     Ordinance 08-08
     Amendment 08-1ER
TABLE 8
STATISTICS RELATING TO THE CONDITION OF THE HOUSING STOCK
REPRESENTATIVE HOUSING UNIT CITY OF DUNEDIN PINELLAS COUNTY
CONDITION (OCCUPIED)
NUMBER PERCENT NUMBER PERCENT
Lacking Complete Plumbing1 40 .20 1,770 .37
Lacking Complete Kitchens1 136 .68 3,152 .65
Lacking Heating Fuel2 81 .47 2,946 .71
Overcrowding (Over 1 person/room)2 205 1.18 11,276 2.72
1
Percent is of total housing units
2
Percent is of occupied housing units
Source: 2000 US Census
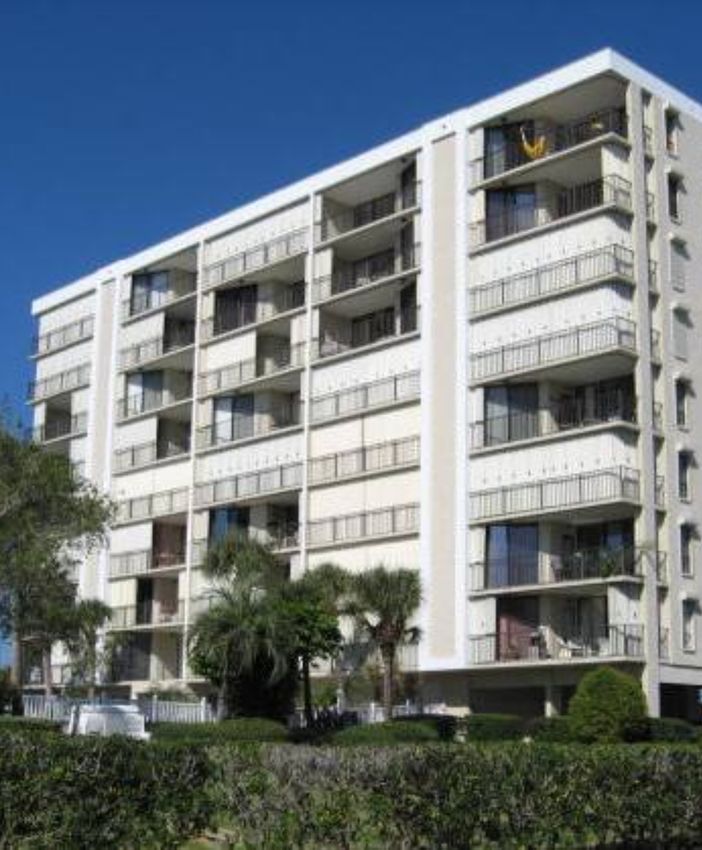
Royal Stewart
Arms, a condo-
minium, is the
only residential
development on
a barrier island
within Dune-
din’s jurisdic-
tion.
TABLE 9
2007 STRUCTURAL CONDITION OF HOUSING
HOUSING NO. OF NO. OF SUB- WARRANTS
STANDARD CONDITIONAL
CATEGORY UNITS STRUCTURES STANDARD CLEARING
Single Family 11,560 11,560 11,510 39 3 8
Multi-Family 6,927 722 721 1 0 0
Duplex 734 367 366 0 1 0
Triplex N/A N/A N/A N/A N/A N/A
Mobile Home 1,720 1,720 1,717 3 0 0
Total 20,941 14,369 14,314 43 4 8
Source: Dunedin Planning & Development, 2007
9 DUNEDIN 2025-THE COMPREHENSIVE PLAN
Adopted 12/18/08 Housing Element
Ordinance 08-08
Amendment 08-1ERIn assessing the preceding tables, several patterns emerge, among them the following:
∑Most houses in both the county and City were built before 1980.
∑The monthly contract rent is slightly lower for Dunedin than the county.
∑The value of owner-occupied housing units is a bit lower for Dunedin than
countywide.
∑The median mortgage payments are nearly the same for both entities.
∑For Pinellas County, the lower the income range, the greater the percentage of
those paying 35% or more of their income for rent. The trend is similar for
Dunedin but it drops slightly between the $10,000-$19,999 category and the
Less than $10,000 category.
∑For the owner costs, the lower the income range the greater the proportion
there is paying 35% or more.
∑There are very few substandard units relative to plumbing, kitchen, heating fuel
or overcrowding conditions.
In addition to the assessment of general housing, special situations also exist. Table 10
below lists the Mobile Home Developments located within the City; their locations are shown
in Figure 3. Tables 11 through 13 and Figure 4 display information on subsidized housing in
Dunedin. The situation has changed significantly since the previous comprehensive plan up-
date. Highlander Village was demolished in phases during 2005 and late 2006 due to lead-
based paint and asbestos concerns. Although it is anticipated that many of these units will be
built back, precisely when and to what density is uncertain. As the tables show, there are still
654 units whose rent is augmented by non-occupant funds.
As delineated in Table 14 and Figure 5, there are 32 facilities that provide special assis-
tance to disabled persons. These come in the form of assisted living facilities, nursing homes
and residential centers. Finally, Table 15 and Figure 6 display information on the historically
significant housing.
Marina Tower
is a large con-
dominium de-
velopment on
Ward Island
near the Dune-
din Causeway.
10 DUNEDIN 2025-THE COMPREHENSIVE PLAN
Adopted 12/18/08 Housing Element
Ordinance 08-08
Amendment 08-1ERTABLE 10
MOBILE HOME PARKS
LOTS
NAME LOCATION OWNERSHIP
Golden Crest 800 Main Street 176 Group of owners; out-of state
Golden Acres 1040 Main Street 226 Lots individually owned
Dunedin Mobile Manor 130 Patricia 121 Lots individually owned
Oak Bend 801 Oak Bend 53 Single-owner; out-of-town
Lone Pine 77 Lone Pine 128 Single-owner; in-town
Lake Haven 1415 Main Street 379 Single-owner; out-of-state
Cedar Creek 605 Michigan 114 Lots individually owned
Lake Highlander 1500 CR 1 293 Lots individually owned
Honeymoon 1100 Curlew 230 Single-owner; out-of-state
Silk Oak 28488 US 19 North 182 Single-owner; out of-state
(Planning Area)
Countryside Estates 27466 US 19 North 100 Lots individually owned
(Planning Area)
Doral Village 29250 US 19 North 527 Single-owner; residents asso-
(Planning Area) ciation
Bell Haven 27544 US 19 North 87 Single-owner; in-town
(Planning Area)
Bell Haven B 1275 Belcher Road 58 Single-owner; out-of-town
(Planning Area)
New Athens City* Solon Avenue at 92 Lots individually owned
Belcher Road
(Planning Area)
*Not a mobile home park.
Source: Dunedin Planning & Development, 2006
Lake Haven Mobile
Home Park sports not
only newer models but
also landscaping and
visual cues that provide
for a certain sense of
place.
15 DUNEDIN 2025-THE COMPREHENSIVE PLAN
Adopted 12/18/08 Housing Element
Ordinance 08-08
Amendment 08-1ERTABLE 11
AFFORDABLE HOUSING INVENTORY
RHS/HUD
APPROX. YR.
TOTAL ASSISTED OCCUPANCY RENTAL NUMBER NUMBER NUMBER NUMBER NUMBER OF 4 HUD HOUSING POPULATION
DEVELOPMENT NAME STREET ADDRESS 1 2 BUILT OR YR.
UNITS UNITS STATUS ASSISTANCE OF 0 BR OF 1 BR OF 2 BR OF 3 BR OR MORE BR FUNDED 3 PROGRAM(S) SERVED
OF FUNDING
UNITS
Ready for
Whispering Hills 612 Bass Court 160 160 N/A N/A N/A N/A N/A x 1974 Section 236 Family
Occupancy
Rental
San Christopher II Group 664 San Christopher Ready for Assistance/ Persons with
7 7 6 - 6 - - - x 1990
Home Dr Occupancy HUD Section Disabilities
202
Rental
Ready for Assistance/ Persons with
Union Group Home 920 Union St 5 5 5 - 5 - - - x 1987
Occupancy HUD Section Disabilities
202
Rental
Uparc Housing II Group 1545 Pinehurst Ready for Assistance/ Persons with
7 7 6 - 6 - - - x 1990
Home Rd Occupancy HUD Section Disabilities
202
1
Total units in the development..
2
For RHS and HUD properties, number of assisted units equals total units. For FHFC and LHFA properties, this is the number of units that receive financial assistance.
3
For HUD and LHFA developments, this is the approximate year that the development was originally constructed; for FHFC developments, this is the funding year of the earliest program that currently assists a
property, which may be the year of new construction or year of rehabilitation; data for RHS developments are not available.
Source: Shimberg Center
H a r b o r
Oakes is one
of over 50
apartment
complexes of
different
styles and
sizes.
16 DUNEDIN 2025-THE COMPREHENSIVE PLAN
Housing Element
Adopted 12/18/08
Ordinance 08-08
Amendment 08-1ERTABLE 12
WHISPERING HILLS APARTMENTS
HOUSEHOLDS
% OF UNITS REPORTED ON
TOTAL UNITS
General OCCUPIED AS % OF OCCU-
1
PIED UNITS
160 96 59
HOUSEHOLD HEAD OR SPOUSE
HOUSEHOLD COMPOSITION
HAS DISABILITY
% OF ALL
% 2 OR MORE % FEMALE % OF HOUSE- % OF HOUSE- PERSONS WITH
% 1 ADULT % FEMALE DISABILITY
ADULTS WITH HEAD WITH HOLDS OF AGE 61 HOLDS OF AGE
WITH CHILDREN HEAD
Household CHILDREN CHILDREN AND YOUNGER 62 AND OLDER
Composition and
Age, 2000 9 49 76 51 8 0 6
AGE OF HOUSEHOLD HEAD/SPOUSE
% 24 OR LESS % 25 TO 50 % 51-61 % 62 OR MORE % 85 OR MORE
15 57 13 14 0
HOUSEHOLDS BY
HOUSEHOLDS BY RACE
ETHNICITY
Race and Ethnicity, % ASIAN OR
% NATIVE
2000 % MINORITY % BLACK PACIFIC IS- % HISPANIC
AMERICAN
LANDER
22 12 0 1 9
PERCENT OF HOUSEHOLDS IN INCOME RANGE
ANNUAL HOUSE-
HOLD INCOME (IN
$10,000- $20,000 OR
$000'S) $1-$4,999 $5,000-$9,999 $15,000-$19,999
$14,999 MORE
15 0 10 38 44 8
2
Income, 2000 SOURCE OF HOUSEHOLD INCOME HOUSEHOLD INCOME CATEGORIES
HOUSEHOLD
MAJORITY OF MAJORITY OF MAJORITY OF INCOME AS %
% VERY LOW % EXTREMELY
INCOME IS WAGES INCOME IS INCOME IS OF LOCAL
INCOME LOW INCOME
(%) WELFARE (%) OTHER (%) MEDIAN FAM-
ILY INCOME
73 0 27 64 12 44
AVERAGE % OF HOUSE-
AVERAGE AVERAGE
AVERAGE MONTHS MONTHLY RENT HOLDS WITH % MOVED IN
Wait, Rent and UTILITY AL- MONTHS SINCE
ON WAITING LIST WITH UTILITIES UTILITY AL- PAST YEAR
Turnover, 2000 LOWANCE ($) MOVED IN
($) LOWANCE
Not Applicable 355 82 100 33 42
% OF HOUSE-
MINORITY AS % HOLDS OWNING
% OF POPULATION
Area OF POPULATION SINGLE FAMILY
IN POVERTY IN
Characteristics, IN CENSUS DETACHED
CENSUS TRACT
2000 TRACT HOME IN CEN-
SUS TRACT
11 11 19
1
Figures in the table are for reported households.
2
Maximum period that development needs to stay affordable. If expired, owner can only end affordability if eligible for mortgage prepayment.
All properties with a Restrictive Use Period also have an RHS mortgage, but the maturity date is not available.
Source: Shimberg Center
Landscaping provides a pleasant exterior to two different group
homes.
17 DUNEDIN 2025-THE COMPREHENSIVE PLAN
Adopted 12/18/08 Housing Element
Ordinance 08-08
Amendment 08-1ERTABLE 13
PALM LAKE VILLAGE
AGE LIMITS NUMBER OF NUMBER OF NUMBER OF RENTS FUNDING
UNITS ONE BED- TWO BED-
ROOM UNITS ROOM UNITS
55 and Over 475 409 66 $420 1 Bedroom HUD Section
$475 2 Bedroom 8 Vouchers
Source: Dunedin Planning & Development, 2007
Analysis
The analysis should begin with population trends. The increase from 1990 to 2000 was re-
markably close to what was projected in Dunedin 2015. The previous comprehensive plan forecast
yielded an estimated permanent population in 2000 of 36,417. The actual Bureau of the Census
figure was 35,691. The comprehensive plan result was only 2.03% below the Census figure. The
resultant 1990s growth was 4.93% spread over ten years.
Since 2000, population has increased marginally to an estimated 37,574 permanent residents
in 2006. This translates into a growth rate of 5.28% spread over six years.
Although the annexation of existing residential development in enclaves and adjoining land
in Planning Area was encouraged, only 56 cases, totalling 134.97 acres, were processed for annexa-
tion between the time the comprehensive plan was adopted and the time the Evaluation and Ap-
praisal Report (EAR) was written.
On the positive side, only X% of City’s housing structures are substandard or warrant clear-
ing
According to the Census, there was a 2000 vacancy rate of 13.5%, consisting of a 7.34%
seasonal vacancy, and a 6.16% year-round vacancy.
Trends since 2000 show that an average of 124 housing units have been constructed by the
private sector each year (based on the number of permits issued). Thirty-one percent were Multi-
Family Dwelling Units (MFDU). A total of 573 permits were issued for new Single Family Dwell-
ing Units (SFDU) from 2000 through 2006. Since the City does not have the resources to produce
housing, the private sector will produce 100% of the housing need.
The City does continue to investigate ways to improve the housing delivery system and
maintain the existing stock. The City has provided information to the private sector on infill devel-
opment and land suitable for redevelopment. Staff has analyzed development review procedures
and regulations slowing down housing the delivery process. For example, reduced transportation
impact fees are allowed in redevelopment areas. The City has allowed impact fee deferrals for non-
profit developers (such as Habitat for Humanity).
Substandard housing and zoning violations are handled through the code enforcement proc-
ess. Zoning violations such as nuisance landscaping can be readily applied; the City, has no author-
ity to enforce upgrades to mobile homes unless the owner or contractor modifies the mobile home
since this requires a building permit and inspection to ensure that modifications are done to Florida
Building Code specifications. Obvious structural deficiencies based on the Florida Building Code
can be enforced. When mobile homes are replaced in the floodplain, the City enforces all Federal
Emergency Management Agency (FEMA) requirements. This means that mobile homes are raised
to the base flood elevation.
By the Zoning Code, group homes are a permitted use in all residential zoning districts ex-
18 DUNEDIN 2025-THE COMPREHENSIVE PLAN
Adopted 12/18/08 Housing Element
Ordinance 08-08
Amendment 08-1ERTABLE 14
GROUP HOMES IN THE CITY OF DUNEDIN LICENSED BY THE STATE OF FLORIDA, 2006
LOCATION CAPACITY TYPE OF FACILITY
Abigail Manor 1655 Bayshore Boulevard OSS 5; Non-OSS 5 Assisted living facility
Curlew Care Home I 1722 Curlew Road OSS 0; Non-OSS 12 Assisted living facility
Dunedin Assisted Living Facility 534 Howell Street OSS 4; Non-OSS 26 Assisted living facility
Edinborough Square 1059 Virginia Street OSS 0; Non-OSS 24 Assisted living facility
Gardens at Dunedin 880 Patricia Avenue OSS 0; Non-OSS 105 Assisted living facility
Golden Homes Corporation 787 San Salvador Drive OSS 2; Non-OSS 4 Assisted living facility
Happy Home ALF 500 Highland Avenue OSS 5; Non-OSS 2 Assisted living facility
Heather Haven 725 Edgewater Drive OSS 3; Non-OSS 16 Assisted living facility
Heather Haven II 220 Scotland Street OSS 2; Non-OSS 14 Assisted living facility
Lakeside Manor 676 Union Street OSS 0; Non-OSS 12 Assisted living facility
Mease Assisted Living 700 Mease Plaza OSS 0; Non-OSS 122 Assisted living facility
Mimi's Retirement Home 1442 Chesterfield Drive OSS 0; Non-OSS 6 Assisted living facility
Nurses Helping Hands of Dunedin 1585 Curlew Road OSS 0; Non-OSS 50 Assisted living facility
Park Place of Dunedin, Inc. 541 Park Street OSS 1; Non-OSS 13 Assisted living facility
Seven Springs Manor II 1834 Pinehurst Road OSS 0; Non-OSS 8 Assisted living facility
Wild Flower Inn 639 Michigan Blvd. #1500 OSS 0; Non-OSS 12 Assisted living facility
Squire Court Community Home 95 Squire Court 6 Intermediate care facility
Cross Terrace Rehabilitation Center 1351 San Christopher Drive 104 Skilled nursing facility
Edinborough Healthcare Center 1061 Virginia Street 93 Skilled nursing facility
Manor Care Nursing Center Dunedin 870 Patricia Avenue 120 Skilled nursing facility
Mease Continuing Care 910 New York Avenue 100 Skilled nursing facility
1
UPARC Marjon Home 411 Marjon Avenue 7 Group Home1
UPARC Pinehurst Home 1545 Pinehurst Road 91 Group Home1
UPARC San Christopher Home #2 664 San Christopher Drive 91 Group Home1
UPARC Union Home 920 Union Street 101 Group Home1
Country Oaks 3240 CR #1 (County) OSS 0; Non-OSS 10 Assisted living facility
3133 Las Olas Drive
Lifetides Home, Inc. OSS 3; Non-OSS 2 Assisted living facility
(County)
Rosewood House II, Inc. 3175 Belcher Road (County) OSS 0; Non-OSS 43 Assisted living facility
2281 Twin Lane Drive
Twin Lane Community Home 6 Intermediate care facility
(County)
Non-OSS: Number of beds for private pay residents.
OSS: Number of beds available for residents receiving Optional State Supplementation, a cash assistance program supplementing a
person’s income to help pay for costs.
1
Based on previous information; data not provided by Agency for Persons with Disabilities.
Source: Agency for Health Care Administration, 2007
19 DUNEDIN 2025-THE COMPREHENSIVE PLAN
Adopted 12/18/08 Housing Element
Ordinance 08-08
Amendment 08-1ERTABLE 15
HISTORICALLY SIGNIFICANT HOUSING
LOCATION DESCRIPTION SOURCE
Williamson Home Built circa 1880 Florida Master Site File
209 Scotland Street Listed on National Register of
Historic Places
Manget House Built circa 1900 Dunedin Historical Society
427 Scotland Avenue
Zimmerman House Built circa 1910 Dunedin Historical Society
362 Scotland Street
W.Y. Douglas Cottage Built circa 1890 Dunedin Historical Society
641 Douglas Avenue
Burn’s House Built circa 1915 Dunedin Historical Society
365 Albert Street
Octagon House Built circa 1900 Dunedin Historical Society
247 Scotland Street
Dr. Badeau Residence Built circa 1900 Dunedin Historical Society
215 Monroe Street
H.P. and C.O. Malone Home Built circa 1900 Dunedin Historical Society
827 Victoria Drive
J.S. and E.T. Malone Home Built circa 1910 Dunedin Historical Society
951 Victoria Drive
N.S. and C.B. Bouton Home Built circa 1893 Dunedin Historical Society
937 Victoria Drive
Leland Home Built circa 1880 Dunedin Historical Society
231 Monroe Street
Blatchley House Built circa 1915 Dunedin Historical Society
232 Lee Street
Tharin-Mease Home Built circa 1905 Dunedin Historical Society
470 Virginia Avenue
Tod House Built circa 1912 Dunedin Historical Society
1005 Victoria Drive
D.K. Mussey House Built circa 1905 Dunedin Historical Society
1015 Victoria Drive
F.L. Skinner House Built circa 1888 Dunedin Historical Society
1037 Victoria Drive
B.C. Skinner House Built circa 1912 Dunedin Historical Society
1057 Victoria Drive
Frischkorn/Kellogg House Built circa 1920 Dunedin Historical Society
129 Buena Vista Drive
Source: Florida Department of State; Pinellas County Planning Department; Dunedin Historical Society, 1996
20 DUNEDIN 2025-THE COMPREHENSIVE PLAN
Adopted 12/18/08 Housing Element
Ordinance 08-08
Amendment 08-1ERDATA POINTS:
cept Mobile Home Park and Recreational Vehicle Mobile Homes and Modular Homes
Park. Group homes, though, are to be separated by a
1,200 foot radius. Mobile homes are often referred to as
“manufactured homes. They are built to the U.S. Depart-
The City developed and adopted a Historic
ment of Housing and Urban Development (HUD) stan-
Preservation Ordinance (HPO) in 2003. The proce- dards and are usually installed on temporary foundations
dure allows voluntary designation by the property (concrete pads, dry-stacked blocks and tie-downs). Not
owner providing that the structure meets certain crite- usually considered real property, they generally depreci-
ria. Once designated, the property owner would have ate in value similar to an automobile. Insurance rates will
to adhere to certain reconstruction restrictions. There generally be higher for mobile homes, especially in Flor-
ida. The mobile home industry is regulated in Florida by
are tax incentives that would be available through the the Department of Highway Safety and Motor Vehicles
county. (DHSMV). Upon installation, a mobile home’s wheels
The City has utilized Pinellas County Com- and axles may be removed, but the integral chassis must
munity Development Department’s funds for the stay in place. To be acceptable in Florida, a mobile home
demolition of both residential and commercial build- must bear the HUD label and be installed by a mobile
home installer licensed by DHSMV.
ings Modular homes are designed, built, permitted
Another special needs population is the eld- and inspected to the Florida Building Code (FBC), and
erly. In 2000 30% of the residents in Dunedin were must be installed on permanent foundations (e.g., poured
65 years of age and older. Smaller housing is often footers, stem walls & poured piers or engineered slabs,
desirable for older citizens. Toward that end, the City just like site built homes) that are designed and built spe-
cifically for that home by a contractor licensed by the
maintains mobile home zone districts. Dunedin also Department of Business & Professional Regulation
encourages developers to construct or rehabilitate (DBPR). To be acceptable in Florida, a modular home
housing units to be barrier free since the high median must bear the insignia of the Florida Department of
age suggests housing for handicapped is needed. Fi- Community Affairs (DCA) on the inside of the cover of
nally, group homes are allowed in multi-family and the home’s electrical panel. They are considered real
property when installed on a permanent foundation, and
single family districts. insured as such.
For younger residents, though, many multi-
family housing developments do not allow children. Source: Florida Department of Community Affairs
Both time and staff constraints have prohibited City
from informing developers of problems families with children have, inventorying apartments not
allowing children, and assisting the Pinellas Community Services Foundation in monitoring rental
housing discrimination against families with children.
Based on a one day, point-in-time survey, the Pinellas County Coalition for the Homeless
(PCCH) estimated that 4,540 homeless persons resided in the county in 2005. This included 20%
children and 32% women. Using the 2005 permanent population ratio of Dunedin vs. Pinellas
County, there would be an estimated 183 homeless persons in Dunedin. This does presume a ho-
mogeneous distribution of homeless persons throughout Pinellas County. Pinellas County has mini-
mal and declining number of farmworker households.
Turning to the condition of the units themselves, a Housing Element objective calls for at
least ten percent of substandard housing units being improved annually. This has been met nearly
every year since 1997.
In order to maintain the amount and quality of the housing stock, the City continues to per-
form many activities, including the following:
∑Condemn structurally unsound housing. Clearing, though is the last resort if the
unit cannot be renovated. Infill housing onsite is promoted after demolition.
∑Inform citizens of low interest rehabilitation loans through Pinellas County.
21 DUNEDIN 2025-THE COMPREHENSIVE PLAN
Adopted 12/18/08 Housing Element
Ordinance 08-08
Amendment 08-1ER∑Adhere to local and federal displacement policies.
∑Publicize the City’s Historic Preservation Ordinance and the benefits of such use.
∑Pursue National Register of Historic Places designation for historic sites.
TABLE 16
ANNUAL INCOME BY HOUSEHOLD SIZE AS A FUNCTION OF AMI, 2005
1 PERSON 2 PERSONS 3 PERSONS 4 PERSONS 5 PERSONS 6 PERSONS
30% of AMI: Very Low Income $10,950 $12,550 $14,100 $15,650 $16,900 $18,150
50% of AMI: Very Low Income $18,250 $20,850 $23,450 $26,100 $28,150 $30,250
60% of AMI: Low Income $21,900 $25,020 $28,140 $31,320 $33,780 $36,300
80% of AMI: Low Income $29,250 $33,400 $37,600 $41,750 $45,100 $48,450
Median Income $36,500 $41,700 $46,950 $52,150 $56,300 $60,500
120% of AMI: Moderate Income $43,800 $50,040 $56,280 $62,640 $67,560 $72,600
Source: Pinellas County Community Development, 2005
Any discussion of affordable housing should first define the term. Generally, affordable
housing means that monthly rents or mortgage payments, including utilities, taxes and insur-
ance, do not exceed 30% of gross household income. Exceeding this proportion results in what
is called a cost burden. This cost burden is often tied to income categories, with the result that
those in lower income categories have a higher percentage of cost burden.
Income categories themselves are based on Area Median Income (AMI), which in turn
is derived by the US Department of Housing and Urban Development (HUD) for locations
around the country. In Pinellas County, AMI in 2005 for an individual was $36,500, and for a
family of four, it was $52,150. Table 16 shows the various income categories that have been
developed for households of different sizes based on this AMI. In other words, if a household
is composed of three people and the gross annual income is approximately $14,100 that house-
hold would be considered to be 30% of AMI and in a very low income bracket. Indeed, house-
holds at 50% or less of the AMI are considered very low income households; those between
50% and 80% are considered low income; those between 80% and 120% are considered moder-
ate income.
Making use of this concept, the Shimberg Center for Affordable Housing has developed a
series of tables by municipality that show the cost burden by income category for different years.
As can be seen in Table 18, over 25 percent of all households within Dunedin were paying over
30% of their gross household income for housing costs in 2000. This result is roughly the same for
2005.
Inasmuch as the affordable housing situation has worsened over the last few years, Dunedin
has proffered several approaches. There are still nine mobile home parks located in the City, and
thus far there have been no formal proposals submitted to convert them to other types of resi-
dential uses. Palm Lake Village, which caters to the 55-and-over population, is a viable com-
munity with 475 units managed by the Pinellas County Housing Authority (PCHA). The City’s
planned residential categories and downtown zoning districts allowing zero-lot line develop-
ment are conducive to reduced development costs and promotion of more affordable prices.
22 DUNEDIN 2025-THE COMPREHENSIVE PLAN
Adopted 12/18/08 Housing Element
Ordinance 08-08
Amendment 08-1ERThe City did work with the Tampa Bay TABLE 17
Community Development Corporation COST BURDEN BY HOUSEHOLD INCOME
in assisting to construct six single fam- HOUSEHOLD INCOME HOUSING COST
HOUSEHOLD COUNT
ily houses along Palmetto Street. In CATEGORIES BURDEN*
early 2006, a building height ordinance 2000 2005
was crafted and adopted which allows Less than 30% AMI Less than 30% 466 482
for additional stories if “attainable Less than 30% AMI 30.01 to 50% 187 192
housing options [are] integrated within Less than 30% AMI 50.01% and over 834 872
the use where a minimum of 20 percent 30.01 to 50% AMI Less than 30% 702 712
of the project is developed with attain- 30.01 to 50% AMI 30.01 to 50% 545 564
able housing type units.” (The ordi- 30.01 to 50% AMI 50.01% and over 562 584
50.01 to 80% AMI Less than 30% 1,975 2,038
nance specifies that “the term
30.01 to 50% 958 1,010
‘attainable housing’ means housing is 50.01 to 80% AMI
50.01 to 80% AMI 50.01%a nd over 243 256
attainable when a household income is
80.01 to120% AMI Less than 30% 3,092 3,242
at 80 to 120 percent of an area’s me- 80.01to 120% AMI 30.01 to 50% 506 544
dian income (in the case of this ordi- 80.01 to120% AMI 50.01% and over 118 123
nance, the median household income 120.01% plus AMI Less than 30% 6,668 7,123
for Pinellas County, as determined by 120.01% plus AMI 30.01 to 50% 329 355
the most current U.S. Census Bureau 120.01% plus AMI 50.01% and over 59 63
data for the County) with the house- Totals for 30.01 to 50% Cost Burden 2,525 2,665
hold paying no more than 30 percent of Percent of all Households 14.64% 14.68%
their annual income for housing and Totals for 50% and over Cost Burden 1816 1,898
utility costs.”) Percent of all Households 10.53% 10.45%
On the countywide level, the Totals for over 30% Cost Burden 4,341 4,563
25.17% 25.13%
Pinellas County Housing Authority Percent of all Households
*Less than 30% means that households within the respective income category
provides Section 8 rental assistance to are spending less than 30% of their gross household income on housing costs.
households meeting income criteria. In 30.01 to 50% means that households within the respective income category
are spending between 30.01% and 50% of their gross household income on
2005, approximately 369 households in housing costs. 50% and over means that households within the respective
the City receive this subsidy, with 228 income category are spending between 50% or more of their gross household
income on housing costs.
of them living at Palm Lake Village, 24
living at Whispering Pines, 13 at Scot- Source: Shimberg Center
tish Towers and the remainder distributed somewhat evenly throughout the City’s many other
apartment complexes.
But the City has suffered from a number of circumstances, most notably the loss of
Highlander Village mentioned above. And, although the City has always been willing to work
with developers in order to create lower-cost housing, there is no formal program within the
City that supplies housing. However, in 2007, the City created a new department called Eco-
nomic and Housing Development. One of the tasks of this new department is to promote and
foster affordable, or workforce, housing. The new department will continue to work with Pinel-
las County Community Development in the promotion of their housing programs that offer
down payment assistance, first-time home buyers funds, home repair loans, and rental housing
development.
Not only the City, but all of Pinellas County has experienced a spike in housing costs.
Figure 7 shows how costs have risen during the period from 1996 to 2005. Additionally, Pinel-
las County, in a report issued in 2005 found the following:
23 DUNEDIN 2025-THE COMPREHENSIVE PLAN
Adopted 12/18/08 Housing Element
Ordinance 08-08
Amendment 08-1ER∑The decreasing vacant land supply means higher land costs.
∑Construction costs are rising, with “some components…over 40% higher than
a year ago.”
∑“Changes in Public Housing [and] reduction in State [and] Federal funding”
have resulted in a loss of traditional “safety nets.”
∑There has also been a loss of lower-end rental market housing such as mobile
home units, duplexes and small apartment complexes.
∑There is a high number of cost-burdened households, with “10,000 renters and
17,000 owners paying over 50% for housing.”
∑68,000 new jobs are expected to be created locally over the next five years,
with “72% currently projected in service [and] retail sectors.”
∑There has been a tremendous “disparity between housing costs [and] income
growth”: between 1993 and 2003 housing prices have gone up 73% while in-
comes have climbed only 11%.
Figure 7 In order to develop a
Me an Sale s Pri ce of Housing ,
more comprehensive and effec-
Pine llas Coun ty
tive approach to affordable
$249,673
housing, Pinellas County
$230,000
formed a Community Housing
Workgroup in 2005 in order to
$180,000
$159,003 assess the situation and develop
$130,000
methods of dealing with what
$124,772 has been perceived as a crisis
$80,000
situation. Initially composed of
$78,823 $50,145 staff from various Pinellas
$41,753
$30,000 County departments (County
1996 1997 1998 1999 2000 2001 2002 2003 2004 2005 Attorney, Development Review
Services, Economic Develop-
Single Family Mobile Home Condominium ment, Human Services, Plan-
ning and Community Develop-
Note: The number of sales estimates for years 1990 to 1998 are partial sales for the year. Sales price is in 2006 ment) the group was expanded
dollars. to include representatives from
the Pinellas Planning Council,
St. Petersburg, Clearwater, Largo and Dunedin as well as private sector involvement from the
banking, real estate, apartment management, land development and redevelopment communi-
ties. The Workgroup was presented with a number of policy based, regulatory and financial
strategies. The Workgroup narrowed this list down to three, which will be discussed here.
The first one is a housing trust fund. According to the Workgroup,
... is a special revenue source where funds collected by the local government are dedicated to
resolving community issues. The proposed Housing Trust Fund will not redirect existing hous-
ing dollars, but seeks to add new revenue. Jurisdictions will submit plans that demonstrate how
Trust Fund proceeds will be optimized. Trust Fund proceeds are offered, mainly as loans, to
provide housing affordable to target populations.
24 DUNEDIN 2025-THE COMPREHENSIVE PLAN
Adopted 12/18/08 Housing Element
Ordinance 08-08
Amendment 08-1ERSources of these trust fund dollars can come from development exactions, reapportionment of
current property tax increments, adding a housing component to the Penny for Pinellas exten-
sion, a local option documentary surtax (which would require legislation), special purpose or
revenue bonds or reapportionment of general government revenues (e.g., gas tax, parking fees,
permit fees).
Trust funds could be used for a number of financing options, including
∑Production of new housing (through land acquisition, site development loans,
construction loans or conversion and adaptive reuse).
∑Preservation of existing housing (through purchase and renovation of existing
units and preserving expiring use properties).
∑Promotion of housing opportunities (through down payment and closing cost
assistance, interest rate buy-downs, tenant-based rental assistance programs and
employer-assisted housing programs).
Based on these recommendations, in March of 2006, the BCC established a housing
trust fund to be used to provide housing assistance and to leverage private funding for housing
development and renovation. An FY 06/07 allocation of $10 million was followed by an FY
07/08 amount of $5 million. The funds come from ad valorem tax revenues. These monies are
being distributed to local jurisdiction that are entitlement communities.
A program such as this is ideal for a community such as Dunedin as the staff require-
ments would be minimal. Dunedin staff should work with county staff, making referrals and
perhaps assisting residents with their applications. But since the funding would come from
countywide sources, the outlay that the City has to provide is limited.
The second concept involved development regulations. The Workgroup cited a number
of findings, including the following:
Individual jurisdictions have excellent regulatory relief strategies that should by adopted commu-
nitywide.
The County should develop a model community housing ordinance that incorporates regulatory
relief by right and share that model ordinance with other communities.
A policy considering regulatory relief for community housing could be incorporated into the
Countywide Plan.
Adoption of the model ordinance could be a requirement for jurisdictions benefiting from the
Housing Trust Fund.
Regulatory relief should include, at a minimum, impact fee relief, top-of-the-pile project review,
and a process to consider how new regulations influence housing prices.
Development regulations favoring affordable housing can come in many forms, including expe-
dited permit processing, donation of publicly owned land, alternative building materials, re-
duced setbacks, and zero-lot lines. While not specifically to promote affordable housing, the
City has utilized the latter two concepts for years in certain zoning districts.
The Workgroup also mentioned a number of concepts brought forward in Pinellas by
Design, a countywide redevelopment study. These include the following:
Use creative tools to facilitate community housing:
Overlay districts
Neighborhood centers and town centers
25 DUNEDIN 2025-THE COMPREHENSIVE PLAN
Adopted 12/18/08 Housing Element
Ordinance 08-08
Amendment 08-1ERUrban density areas
Adopt codes that support redevelopment of brownfields and greyfields for community housing.
Since existing buildings are a viable community housing resource, revise codes to support adap-
tive reuse and rehabilitation of existing buildings.
Establish tax increment financing structures as a means of financing affordable properties.
Public policy directions include targeting improvements to transportation and infrastructure in
order to support community housing, creating a superior transit system and transit-oriented de-
velopment, providing regional drainage retention projects, investigating a program of market-
able development rights, and purchasing and assembling sites for future housing and mixed-use
development.
Based on these recommendations, Pinellas County has also established a community
land trust
as a mechanism to utilize public land for community housing and mixed-use development. Existing
County owned property will be made available for both single family and multi-family affordable
housing development. Proposals have been received and are currently being negotiated for the de-
velopment of three such projects. This public and private sector partnership provides construction
opportunities that result in beneficial community projects. Future land acquisitions and donations
will add to the land trust inventory
The updating of the Affordable Housing section of the County’s Land Development
Code and the preparation of a model ordinance that would include sections on regulatory relief
that other jurisdictions could use is proceeding much more slowly. If the City were to follow
the County’s lead, it would have to carefully assess the model ordinance for suitability. As
noted above, the City already has certain regulations in place that can assist in creating afford-
able housing stock.
Although the City is nearly built out, in assessing the effects and benefits of regulatory
relief, the City should also consider policies that promote affordable housing through timing,
through designating areas for affordable housing and through design standards. Care should be
taken, though, by not concentrating affordable housing in any one area of the City. Addition-
ally, the use of design standards should mesh seamlessly with other policies and approaches
concerning this subject.
The last set of recommendations by the Workgroup centered around inclusionary hous-
ing, a concept that effectively requires developers to set aside “a proportion of housing units in
a residential development for households within targeted income ranges that are unable, or find
it difficult to afford, new or existing housing units.” There were a number of findings on this
subject, including the following:
Pinellas should adopt a mandatory inclusionary housing policy for development and redevelop-
ment above a minimum size yet to be determined.
The policy should be incorporated into the Housing Element and the Countywide Planning Au-
thority’s rules.
At a minimum, 15% of units in owner and rental housing developments should be set aside for
targeted incomes.
To facilitate mixed-income development, units are to be provided on site.
As an alternative, off-site units or a monetary contribution to the Community Housing Trust
Fund may be offered.
Incentives may be offered to help make the inclusionary housing economically feasible.
26 DUNEDIN 2025-THE COMPREHENSIVE PLAN
Adopted 12/18/08 Housing Element
Ordinance 08-08
Amendment 08-1ERThe ordinance developed in late 2007 included the following items:
∑The provisions shall apply to all new residential developments of 20 units or
more.
∑Income requirements include the following:
Rental housing developments shall meet one of the following affordability requirements:
1. A minimum of five percent (5%) of the units shall be affordable to persons or
households that have a total annual gross income that does not exceed sixty
percent (60%) of the median annual income adjusted for family size.
2. A minimum of ten percent (10%) of the units shall be affordable to persons
or households that have a total annual gross income that does not exceed eighty
percent (80%) of the median annual income adjusted for family size.
3. A minimum of fifteen percent (15%) of the units shall be affordable to per-
sons or households that have a total annual gross income that does not exceed
one hundred percent (100%) of the median annual income adjusted for family
size.
Affordable for-sale housing units shall meet one of the following affordability require-
ments:
1. A minimum of five percent (5%) of the units shall be affordable to persons or
households that have a total annual gross income that does not exceed eighty
percent (80%) of the median annual income adjusted for family size.
2. A minimum of ten percent (10%) of the units shall be affordable to persons
or households that have a total annual gross income that does not exceed one
hundred twenty percent (120%) of the median annual income adjusted for fam-
ily size.
3. A minimum of fifteen percent (15%) of the units shall be affordable to per-
sons or households that have a total annual gross income that does not exceed
one hundred fifty percent (150%) of the median annual income adjusted for
family size.
∑Inclusionary housing is to be produced before or concurrently with the market
rate units, and shall be integrated throughout the residential development and
“comparable to the market rate units in number of bedrooms, exterior appearance
and overall quality of construction.”
∑As of October of 2007, wording in the ordinance stated that it “shall be effec-
tive in the incorporated, as well as the unincorporated, areas of the County; how-
ever, any incorporated area may elect to adopt an ordinance in conflict herewith.”
As of this writing, Pinellas County had not made a decision as to adopt the final form of
the inclusionary housing ordinance. Should the County pursue this, the City should participate
as well.
Finally, while not part of the Workgroup recommendations, Pinellas County is also pur-
suing Employer Assisted Housing. This type of program encourages businesses to help provide
housing for its employees. Such housing motivates employees to stay, rebuilds communities,
enhances the company’s reputation and builds relationships with motivated employees. Build-
ing company housing close to work reduces commuting time. Pinellas County would encourage
this through working with employers and developers and linking them together.
As noted above, the City has already taken furtive steps in this direction by allowing for
additional stories in height-restricted locations if a certain percentage of attainable housing is
provided by the developer. This differs from inclusionary housing in that the height restrictions
language makes attainable housing optional.
27 DUNEDIN 2025-THE COMPREHENSIVE PLAN
Adopted 12/18/08 Housing Element
Ordinance 08-08
Amendment 08-1ERThere is one last item with regard to demographics and affordable housing. As noted
above, Dunedin has a large number of mobile home parks both within its City limits and in its
Planning Area. Figure 3 shows the location of the developments, and Table 10 displays rele-
vant information about each one. Combined, the mobile home parks within the City provide
over 1,700 dwelling units; bringing in the Planning Area parks adds over another 1,000 units.
(This includes the area known as New Athens City, which is not a mobile home park but rather
a platted development composed of manufactured homes.)
The positive side of manufactured housing is that it does provide a source of affordable
housing. USA Today suggests an average price of $58,000 for manufactured housing, while the
website mygreathome.com reports $24,000 for a single-section house (with 1,000 square feet of
living area) and $43,000 for a double-section (with 1,600 square feet of living space).
Even taking the higher costs leads to the conclusion that many units may be priced
around $60,000. For the land prices, a random survey was made of the appraised value for lots
within the four mobile home parks with single-lot owners. Appraised value ran from a low of
$18,000 to a high of $76,500, with most of the values in the $20,000s to $30,000s. Combining
the more average figures would suggest a total cost of $90,000 for manufactured housing and
the land on which it sits. Based on the 2005 AMI, this would be a very affordable house for a
low income family of two.
The problem is that mobile homes are vulnerable on two fronts. First, they do not fare
as well during severe storm events as housing that is attached to a foundation secured to the
ground. Second, they have become targets for redevelopment.
With regard to the former issue, according to the Shimberg Center for Affordable Hous-
ing,
A team from the Manufactured Housing Institute (MHI) accompanied the HUD damage inspection
team following Hurricane Charley when they inspected six manufactured housing communities near
Punta Gorda. In MHI’s Just the Facts published 23 August 2004 it was reported that the wind speeds
in the six communities ranged from 100 to 145 mph depending on the location. The homes built
prior to the 1976 HUD Code did not perform well in two of the communities. The damages were
attributed to inadequate anchors, corroded anchors, or penetrations of the exterior walls and windows
of the units by wind-borne debris. Car ports that had been attached to the units failed due to wind
forces and tore off portions of the walls and roof. These wall penetrations and those resulting from
wind-borne debris allowed internal pressure to increase and destruction of the home resulted. The
only homes that survived without considerable damage were protected by nearby tree lines.
Most of the damage experienced by manufactured units built according to the 1976 HUD Code,
but before the 1994 changes, was related to the failure of attached carports that pealed [sic] away
siding and roof covering exposing the home to increased internal pressure. Windborne debris
impact was also observed as a cause of damage. A small number of homes were observed to
have shifted off their foundations. Many homes were saved from serious damage by being
equipped with hurricane shutters. In general, it was concluded that most of the homes could be
repaired and would still be livable.
Homes that were built after the 1994 HUD Code, with its wind-load updates, performed well.
Most of the units had storm shutters that likely prevented buildup of internal pressure. Wind-
borne debris damage was observed on siding and roofs. Where attached garages failed, collateral
damage to the units was limited to small wall or roof areas. Movement on the foundation was
observed in very few units and was considered to be easily repairable.
None of the homes built after the 1994 HUD Code updates and in accordance with the 1999 Flor-
ida installation standards could be found that were displaced from their foundations. The tougher
28 DUNEDIN 2025-THE COMPREHENSIVE PLAN
Adopted 12/18/08 Housing Element
Ordinance 08-08
Amendment 08-1ERinstallation and tie-down safety standards for Florida’s mobile homes required the use of more
tie-downs. Today, a typical manufactured home might have as many as 45 tie-downs compared
with just 10 for a pre-Andrew manufactured unit. Most damage that was observed was related to
the loss of attached carports, the impact of wind-borne debris, or siding failure.
The summary statements published by the MHI stated, “Overall, performance of homes built to
the post-1994 HUD Code wind changes was very good. Homes built to the pre-1994 HUD Code
faired [sic] well. Homes built to the 1976 HUD Code failed at an alarming rate.” Another dam-
age assessment of the manufactured home damage related to Hurricane Charley was conducted
by the Florida Department of Highway Safety and Motor Vehicles, Division of Motor Vehicles.
This team visited 77 manufactured housing parks and assessed the damage to 11,800 housing
units located in Polk, Charlotte, DeSoto, Hardee, Lee, Highlands, and Orange Counties. The goal
of the team was to assess the effectiveness of the 1994 HUD Code with its updates to improve
the wind resistance of the units. Out of all the units observed, 2,422 (20.5%) were either de-
stroyed or damaged to the point of not being repairable. Focusing only on the 2,883 post-1994
HUD Code homes that were observed, none of the units were seriously damaged. The damage
observed to these units was related to the loss of attached carports and screen rooms, siding and
shingle loss, broken windows, and siding/roof damage caused by wind-borne debris or falling
trees.
While it is certainly heartening that manufactured housing’s durability has improved
over time, it is impossible to say how many of the existing units in Dunedin are of more recent
construction. It can be expected that as mobile homes are replaced, the successor structures
would be constructed to the post-1994 HUD Code. However, many of the mobile home parks
have been around for decades, along with the residents’ dwelling units.
The economic vulnerability of manufactured housing sites can be traced directly to the
increased cost of housing. As prices soar, developers can be assured of making back their origi-
nal investment through higher asking prices for the finished product. While vacant land is cer-
tainly preferable (as it is less expensive), land not developed to its full potential becomes the
next best thing. Mobile home parks are ideal in this sense as most of them offer a large amount
of acreage and many of them have a single or only several owners. This scenario has been oc-
curring throughout Pinellas County as developers are purchasing these tracts and forcing the
residents off the lots they once occupied. The newly vacant land is then rebuilt with condo-
miniums or townhouses. While the permanent structures are much safer (indeed, mobile home
park residents are required to evacuate prior to the predicted arrival of all impending hurricanes
or tropical storms, regardless of their location), they are also much more expensive, and are not
as affordable as manufactured housing.
As noted above in Table 10, four out of the nine mobile home parks within the City
have individually-owned lots; two of the manufactured home developments in the Planning
Area have individually-owned lots. Doral Village, though, has an association that owns the
park and looks out for the interest of the residents. This places most of the mobile home parks
on the list of vulnerable sites. With a single or small group of owners controlling the park, it is
much simpler for a developer to negotiate a sales price. Because of this, many park dwellers in
other communities have banded together to purchase the park as part of a resident’s association
before a developer does. This would require that the residents have the funds to consummate
such a deal.
In an attempt to partially quell this rising tide, the Florida Legislature added Section
723.083 to the Florida Statutes:
29 DUNEDIN 2025-THE COMPREHENSIVE PLAN
Adopted 12/18/08 Housing Element
Ordinance 08-08
Amendment 08-1ERYou can also read