HOUSING UPOKO 11 - NGA MAKI MAKAURAU - WHARE NOHO O TA - AUCKLAND COUNCIL
←
→
Page content transcription
If your browser does not render page correctly, please read the page content below
-               -
CHAPTER 11 AUCKLAND’S HOUSING   NGA WHARE NOHO O TAMAKI MAKAURAU

          CHAPTER 11

                 HOUSING                     -               -
                                UPOko 11 - Nga whare noho o Tamaki Makaurau

266
-               -
CHAPTER 11 AUCKLAND’S HOUSING   NGA WHARE NOHO O TAMAKI MAKAURAU   267
-               -
CHAPTER 11 AUCKLAND’S HOUSING   NGA WHARE NOHO O TAMAKI MAKAURAU

                 THE AUCKLAND PLAN THE WORLDS MOST LIVEABLE CITY

                                                                              STRATEGIC DIRECTION 11

                                                       HOUSE ALL AUCKLANDERS IN SECURE, HEALTHY HOMES THEY CAN AFFORD

                                                                                       TARGETS
                                Reduce the proportion of                                      Reduce the proportion
                                households which spend             Maintain the proportion       of people living in
                                                                                                                             End rough sleeping
                                 more than 30% of their            of people who own their    households requiring at
                                                                                                                          (primary homelessness)
                                income on housing costs             own home to at least     least one extra bedroom
                                                                                                                            in Auckland by 2020
                                from the average of 27%              64% (2006 baseline)      from 15.7% in 2006 to
                                 in 2011 to 20% in 2030                                            10% by 2020

                                                                                                                          Reduce the disparity in
                                  Increase residential
                                                                                                                          home ownership rates
                                 dwelling construction              Reduce preventable            Retrofit 40% of
                                                                                                                            between Māori and
                                consents from 3,800 in                housing-related        Auckland’s housing stock
                                                                                                                           Pacific peoples (2006)
                                2011 to at least 10,000            hospitalisation by 35%    in need of retrofitting by
                                                                                                                          and the overall rate, to
                                on average per annum                      by 2020                      2030
                                                                                                                          less than 10% by 2030
                                      from 2020
                                                                                                                              (2006 baseline)

                                                                                      PRIORITIES
                                           1                                 2                           3                          4

                                                                                                                             Improve housing
                                    Increase housing                  Increase housing           Improve the quality
                                                                                                                           affordability and the
                                     supply to meet                choice to meet diverse        of existing and new
                                                                                                                           supply of affordable
                                        demand                     preferences and needs               housing
                                                                                                                                 housing

268
Auckland expects everyone to work
together to ensure all Aucklanders have
secure, healthy homes they can afford.

                                                                                                                                      CHAPTER 11 AUCKLAND’S HOUSING
                       -                            -          -                 -
Ko te aro whakaaro o Tamaki Makaurau kia mahi tahi tatou ki a tatou, kia taea e Tatou
                 - -       -
te whare e hoko mo Tatou ano.

604_ Secure, healthy and affordable housing is fundamental to individual, family/whānau,
community and economic well-being. A secure, stable home is the hub of family life and provides a

                                                                                                                                      NGA WHARE NOHO O TAMAKI MAKAURAU
                                                                                                                                        -
foundation for building strong communities and financial security for families. An adequate supply
of quality, affordable housing located near jobs or transport links, is a core requirement for society
and the economy to function, and provides a good quality of life for everyone. Poorly designed,
inefficient and unaffordable housing not only affects individuals and household well-being and

                                                                                                                                                        -
expenses, but is a cost to us all in its impacts on health, social spending and the environment.
605_ Auckland faces a housing crisis because of:                   607_ Directives in this Chapter address these issues;
                                                                   actions to deliver the directives are included in Chapter 14:
a persistent under-supply of housing to meet demand              Implementation Framework. A primary vehicle for delivering on
a lack of housing choice                                         these directives is a proposed multi-sector Housing Strategic
                                                                   Action Plan.
poor-quality, unhealthy and overcrowded housing
declining affordability and home ownership.                      Definition
                                                                   608_ There is no agreed New Zealand definition or measure
606_ There is no single solution, nor a single sector to address   of ‘affordable’ or ’unaffordable’ housing. For the purposes of
these issues, and urgent, large-scale, bold, multi-sector action   the Auckland Plan, we use two complementary measures: the
is required to:                                                    30% gross income benchmark, measuring whether a household
                                                                   pays more than 30% of its gross income on housing costs; and
increase housing supply to meet demand
                                                                   the Median Multiple Measure, which compares house price to
increase housing choice to meet diverse preferences              income (see Priority 4).
  and needs
increase the quality of existing and new housing
improve housing affordability
increase the supply of affordable housing.

                                                                                                                                    269
-               -
CHAPTER 11 AUCKLAND’S HOUSING   NGA WHARE NOHO O TAMAKI MAKAURAU

                                                                              INCREASE
                                                                              HOUSING SUPPLY
                                                                              TO MEET DEMAND

          609_ Auckland’s population is projected to grow to between
          2.2 and 2.5 million over the next 30 years. Around 400,000
          additional dwellings will be required by 2040, which means
          that at least 13,000 additional houses have to be built each
          year. This is a huge challenge, given we already have a shortfall
          of about 10,000 homes, and current levels of house building
          are less than half the volume required. At present, only 5,000
          consents for new homes are issued per year in Auckland, and
          not all these are necessarily built. Further, in New Zealand as a
          whole, only about 24,000 houses are built each year, and the
          rebuilding of Christchurch will take up a large part of national
          construction capacity.

          610_ The Auckland Council will ensure there is sufficient
          development capacity or ‘ready to go’ land for housing. This
          Plan provides for a staged release of land within the Rural
          Urban Boundary, with an average of 7 years’ unconstrained
          development capacity at any point in time, with a minimum of
          5 years’ and a maximum of 10 years’ capacity. Unconstrained
          development is land that has operative zoning and is serviced
          with bulk infrastructure. This Plan provides greater certainty
          for developers about when and where development will occur
          over the next 30 years. As we already have a large shortfall in
          housing and a depressed development sector, it is unlikely that
          we can achieve the target of at least 13,000 new dwellings
          on average per year over the 30-year life of the plan, without
          urgent, bold, multi-sector action.

270
611_ The complexity of amalgamating sufficient land for
development and redevelopment in Auckland is a challenge,                          Directive 11.1
which will require a significant institutional response. The                       Develop and deliver on a multi-sector
creation of urban development authorities, or similar vehicles                     Housing Strategic Action Plan to achieve
with adequate legislative powers, could assist with land                           the required increase in housing supply,
amalgamation. Several international examples illustrate the                        including options to increase affordable
positive impact that urban development authorities and land
                                                                                   housing supply for first home buyers.
agencies60,*can make. There are several different models, with a
range and mix of functions and powers, which may be relevant

                                                                                                                                                      CHAPTER 11 AUCKLAND’S HOUSING
and adaptable to Auckland.
                                                                                   614_ New Zealand’s building industry is small-scale
612_ The Auckland Council influences housing supply through
                                                                                   and fragmented, with a lot of bespoke (one-off) design,
its planning, regulatory and consenting processes. For
                                                                                   construction skills shortages, and low productivity.61 All
developers, the loss of equity and profit caused through delays
                                                                                   these factors impact on supply and house prices. Innovative
can be more costly than the fees themselves. Time and costs
                                                                                   approaches to improve the efficiency and speed of house
across the entire development process need to be looked at.
                                                                                   construction (as recommended by the Productivity
Processes can be streamlined to increase certainty around cost
                                                                                   Commission) need immediate investigation and action, along
and timing. The Auckland Council could move to outcomes-
                                                                                   with the encouragement of innovative building techniques and
based consenting and other incentives for development in

                                                                                                                                                      NGA WHARE NOHO O TAMAKI MAKAURAU
                                                                                   systems, such as well-designed, prefabricated modular housing.

                                                                                                                                                        -
existing urban areas, and zone land for development in new
growth areas.                                                                      615_ The Auckland Council will work with the Productivity
                                                                                   Partnership, a partnership between central government and
613_ A Housing Strategic Action Plan will introduce actions to
                                                                                   the building and construction sector, which is supported by
increase supply. They are to:
                                                                                   the Department of Building and Housing. The partnership

                                                                                                                                                                        -
establish urban development authorities or similar, and                          aims to deliver longer-term improvements in skills and
  collaborate with central government and the private sector                       greater productivity. A 20% increase in productivity in the
  on the identification, assembling and releasing of large tracts                  building and construction sector would boost annual GDP
  of land                                                                          by around 2%, or more than $3 billion per year. In the
                                                                                   medium term, this work is expected to support change within
review all policy, planning, regulatory and assessment                           the industry, and a move to larger companies doing more
  processes to provide a simplified, speedier, ‘end-to-end’                        standardised volume work, with fewer smaller companies
  planning regime                                                                  doing the higher-end, commissioned work. This should
fast-track developments, and/or mitigate development                             increase productivity, reduce regulatory and building costs,
  contributions and consent fees, for developments that                            and deliver better quality, more affordable buildings.
  increase the supply of a particular type of housing or ease
  overcrowding in targeted areas
provide density bonuses as an incentive for intensification
investigate auctioning rights to develop land, promoting
                                                                                   Directive 11.2
  competition between developers/land owners, (to reduce the                       Improve access to first home ownership
  uncertainty associated with development and reduce overall                       through advocacy by Auckland Council
  costs), and create a mechanism for an ordered release of land.                   to central government.

* The Grattan Institute has evaluated several examples of agencies which have
  successfully encouraged private development in areas of urban renewal in
  Australia, which may also be relevant to Auckland.. This involves both central
  and local government. Grattan Institute Getting the Housing We Want 2011.

                                                                                                                                                    271
-               -
CHAPTER 11 AUCKLAND’S HOUSING   NGA WHARE NOHO O TAMAKI MAKAURAU

                                                                                    INCREASE HOUSING
                                                                                    CHOICE TO MEET DIVERSE
                                                                                    PREFERENCES AND NEEDS

                                            Figure 11.1 Change in average size of standalone dwellings

          Figure 11.1 Change in                                                                          616_ Auckland’s households, families and communities are
                                             2011, 220 square metres
                                                   220sq.m                                               increasingly diverse. Housing must cater for different life
          average size of
          stand-alone dwellings                                                                          stages, cultures and families/whānau of different sizes and
                                             2001, 188 square metres
                                                   188sq.m
                                                                                                         types. Ideally, the mix of housing in a neighbourhood should
                                                                                                         allow people the choice of a suitable dwelling within the same
                                             1991, 144 square metres
                                                   144sq.m                                               community as they move through different life stages.

                                                                                                         617_ At the moment, Auckland has a considerable mismatch
                                                                                                         between the available housing stock and people’s needs,
                                                                                                         preferences and ability to pay.

                                                                                                         618_ Although the average household size has decreased,
                                                                                                         the size of a typical Auckland home is getting bigger (see
                                                                                                         Figure 11.1*). Between 1991 and 2011, the average dwelling
                                                                                                         size (excluding apartments and flats) increased by 35% from
                                                                                                         144m2 to 220m2 in floor area.

                                                                                                         619_ In the 1960s, 70% of homes had three bedrooms; since
                                                                                                         2000, new homes are more likely to have four bedrooms, and
                                                                                                         10% have five bedrooms or more.

                                                                                                         *
                                                                                                             Source of data is Auckland Council consents for stand-alone housing. This does
                                                                                                              not include flats and apartments because the data is not available on an
                                                                                                              individual unit basis.

272
THE AUCKLAND PLAN THE WORLDS MOST LIVEABLE CITY

                             620_ The average New Zealand house is now slightly bigger                              622_ Currently, persons with disabilities and their families and
                             than its North American equivalent, is second in size only to                          carers have very little housing choice. There is little purpose-
                             the Australian average house, and is more than twice the size                          built, accessible accommodation beyond that provided by
                             of houses in many European countries. Over two thirds of                               social housing providers, and adaptations are difficult and
                             Auckland’s current housing stock has three bedrooms or more,                           expensive. Housing incorporating universal design principles

                                                                                                                                                                                          CHAPTER 11 AUCKLAND’S HOUSING
                             although nearly half of all households now consist of only one                         should be part of the mix of typologies within neighbourhoods,
                             or two people. Larger houses also reflect changing social trends,                      to provide choice and inclusion for persons with disabilities.
                             such as the need for space within homes for technology,
                             home office space, and storage. Currently expectations exceed                          623_ Faced with limited options, many households are forced
                             households’ ability to pay. However, there are signs that                              to make a series of trade-offs in their choice of housing. Recent
                             expectations are changing.                                                             research has identified the most important choice factors as
                                                                                                                    family needs and commitments, social networks, access to
                            621_ Family types will continue to change over the next 30                              employment, affordability, and quality.
                            years (see Figure 11.2). There will be a greater proportion
                            of couples without children, and a smaller proportion of                                624_ For example, families and older people generally prefer

                                                                                                                                                                                          NGA WHARE NOHO O TAMAKI MAKAURAU
                            two-parent families with children. At the same time, there is                           to stay in or return to established neighbourhoods where

                                                                                                                                                                                            -
                            growing demand for houses with more bedrooms for larger,                                family connections are a priority. They might trade size and
                            or extended families. For some families this is a cultural                              amenity of a house for affordability and home ownership, or
                            preference or personal choice; for others, it is a result of low                        to be in a particular school zone. Some older people might
                            incomes and the inability to afford suitable housing. In the                            trade size for a low-maintenance dwelling; others will prefer a
                            2006 census, 15.7% of Auckland’s population was living in                               larger house where family can stay over and they can have a

                                                                                                                                                                                                            -
                            housing that required one or more additional bedrooms – a                               garden. Persons with disabilities and their families may trade
                            total of 190,017 people, of whom one third were children                                an accessible dwelling for access to transport, education and
                            under 14
                            Figure    years.
                                   11.2  Projected Family Type 2006 to 2031                                         support services.

                                       50                                                                           625_ More research is needed on trends in housing
Figure 11.2                                                                                                         preferences and trade-offs. Our current knowledge reinforces
                                       45
Household projections –                                                                                             the need for flexibility and a range of housing choice within
family types                           40
                                                                                                                    neighbourhoods, along with access to transport, employment,
                                       35                                                                           shops, parks and amenities. This means households have to
                                       30                                                                           make fewer trade-offs in their housing choices (see Chapter 1:
                            Per cent

                                       25                                                                           Auckland’s People, and Chapter 10: Urban Auckland)
                                       20
                                       15
                                       10
                                        5
                                        0
                                               2006        2011       2016          2021     2026       2031
                                                                             Year
                                                  Couple without children           Two-parent      One-parent

                                       Source: Statistics NZ Family type projections for Auckland (medium series)

                                                                                                                                                                                        273
-               -
CHAPTER 11 AUCKLAND’S HOUSING   NGA WHARE NOHO O TAMAKI MAKAURAU

                                            626_ At present there is a limited but growing market for           627_ However, recent research by the Centre for Housing
                                            intensified housing. The reasons for this include the traditional   Research Aotearoa New Zealand (CHRANZ) found that
                                            New Zealand preference for detached homes, expectations of          people living in medium-density developments were generally
                                            the size of housing that far exceed incomes, and examples of        satisfied with their homes and lifestyles. This is also largely true
                                            poorly designed apartments, especially in the CBD.62 Another        for residents of retirement villages in well-designed, medium-
                                            major obstacle is that trading banks do not typically lend above    density, high‑amenity living. This type of housing might
                                            70% on unit-titled residential housing, such as apartments and      become a preferred option for older people if they choose
                                            terrace houses. This is partly because banking covenants (when      to downsize within their neighbourhood. Regulatory policies
                                            banks borrow from other banks) generally prohibit loan-to-          (such as those in the Unitary Plan) can ensure the appropriate
                                            equity ratios greater than 70%, unless the bank (as the lender)     location of retirement villages.
                                            can insure the risk part of the mortgage – which is anything
                                            above the 70% threshold. This is possible on fee-simple titles,
                                            but not unit-titled housing; insurance companies will not insure
                                            mortgages over 70%, so the banks cannot lend above this
                                            threshold. This makes it harder to borrow for a multi-unit title
                                            property, reinforcing the market for stand-alone homes and
                                            pushing up prices for fee-simple titled, stand-alone homes.63

274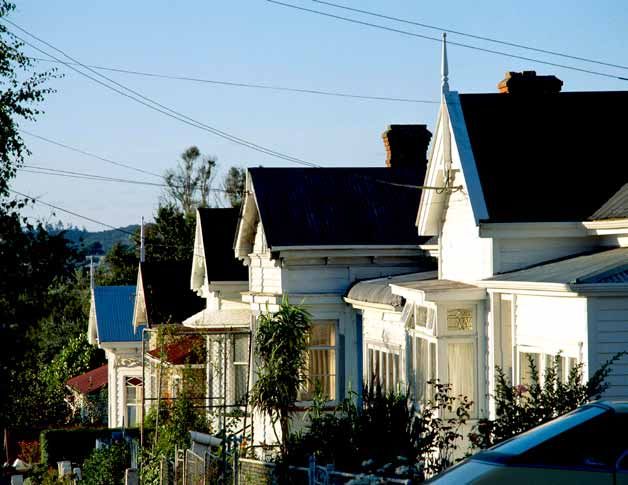
Hobsonville Point
  Hobsonville Point, being developed by the Hobsonville
  Land Company (a Crown entity), includes examples
  of well-designed, energy-efficient, smaller dwellings
  (2 bedrooms) selling for under $400,000 (2012).
  Hobsonville Point shows that people are prepared to
  accept more affordable, attached, intensified houses,
  as long as these houses are well-designed, and the
  area has high amenity, and a range of housing types
  and values. This type of housing could provide entry to
  home ownership.

                                                                    CHAPTER 11 AUCKLAND’S HOUSING
628_ New Zealand’s development and building industry is
still feeling the impact of the recent global financial crises.
Banks remain reluctant to lend to small-scale New Zealand
developers and builders with small profit margins, and will
not finance speculative building or buying ‘off-the-plan’. This
reinforces the practice of building low-risk, high-value, large
homes, and restrains innovative design. The Auckland Council,
central government or a development agency could work with

                                                                    NGA WHARE NOHO O TAMAKI MAKAURAU
a private developer and encourage innovation in the market,

                                                                      -
by providing examples of smaller, cheaper, well-designed,
energy‑efficient homes.

                                                                                      -
Directive 11.3
Encourage a mix of dwelling types
within neighbourhoods across Auckland,
to reflect changing demographics,
family structures and age groups.

                                                                  275
- -
CHAPTER 11 AUCKLAND’S HOUSING NGA WHARE NOHO O TAMAKI MAKAURAU
IMPROVE THE QUALITY
OF EXISTING AND
NEW HOUSING
629_ Well-designed and well-constructed housing is critical for 631_ Most landlords in Auckland are private individuals and the
people’s well-being, not just for aesthetic and environmental quality of the rental housing stock varies greatly. Rental stock
reasons. As well as being safe, warm and dry, housing must includes boarding houses and caravan parks. Boarding houses
provide a reasonable level of privacy (both visual and acoustic). provide an essential service, but some offer sub-standard
Housing is one of the key determinants of health and there is accommodation for vulnerable tenants, who are often either
a strong link between asthma and respiratory and contagious unable or unwilling to exercise their legal rights. The Auckland
illness, and damp, poorly ventilated homes. (See Chapter 1: Council, with other parties, will explore the possibility of
Auckland’s People) legislative, regulatory or voluntary measures, such as a ’warrant
of fitness’ scheme, in order to improve the quality of private
630_ Most of today’s housing stock will make up over half rental housing.
of Auckland’s housing in 2040. There are about 432,000
inadequately insulated homes within the Auckland area.* 632_ Well-designed and -constructed housing – sited to capture
New Zealand’s housing stock is poorly insulated and difficult sun, and incorporating high-efficiency/low-emitting heating
to heat, which is why the recent government programme methods and solar water heating, high insulation standards, and
Warm Up New Zealand was available to all income groups. efficient use of space – has definite benefits for households, such
The fuel and energy costs required to heat houses to as better health and lower running costs. Sustainable design also
acceptable temperatures can be particularly high for lower- has wider benefits, including improved air quality and greater
income households. Those on the lowest incomes pay the energy efficiency, which in turn reduce greenhouse gas emissions.
greatest proportion of their income – almost 13% – on
household energy.
* 294,000 houses in Auckland were built before 1979 – the first full year in which
insulation was mandatory, and a further 138,000 were built between 1979 and
2000 – a period during which insulation standards were poor.
276633_ There is some concern that requiring more sustainable,
energy-efficient dwellings may result in even higher house
prices. However, Beacon Pathway pilot projects have shown
it is possible for a dwelling to use less energy and water, to
have a healthy indoor environment, to cost less to run, to use
environmentally sustainable products and materials, and still be
affordable. There are many examples of successful innovation
in energy efficiency and higher-density affordable housing in
Germany, Sweden and the United Kingdom.
634_ The Auckland Council will therefore incentivise
development that follows best practice urban design and
environmental design principles. (See Chapter 10:
CHAPTER 11 AUCKLAND’S HOUSING
Urban Auckland)
Directive 11.4
Encourage and incentivise retrofitting of
existing housing stock, and require new
housing to be sited and designed to meet
best practice urban design and sustainable
housing principles.
NGA WHARE NOHO O TAMAKI MAKAURAU
277 - -- -
CHAPTER 11 AUCKLAND’S HOUSING NGA WHARE NOHO O TAMAKI MAKAURAU
IMPROVE HOUSING
AFFORDABILITY
AND THE SUPPLY OF
AFFORDABLE HOUSING
BOX 11.1 HOUSING DEFINITIONS
Housing affordability Affordable housing is usually targeted at
those in household income bands from 80%
This is an aggregate term, referring to a to 120% of the median household income
household’s capacity to pay to rent or (MHI), who are not eligible for social housing
635_ Generally, something is considered affordable if it can purchase a home without difficulty. Several but still need assistance to either secure
be paid for without difficulty by an individual or household. factors influence affordability including: home ownership or a long-term rental in
On this basis, housing affordability is a critical problem for the market. (In 2012 the MHI in Auckland is
Auckland, evident in widespread and persistent overcrowding* Supply side: approximately $72,000).
and an escalating shortage of housing accessible to people on � land supply and cost of land
low and modest incomes. Over the last 20 years, house prices
� cost of building materials Affordable living
in Auckland have increased at a greater rate than household
incomes. Many OECD countries have experienced similar � development cost “…encompasses the costs of accessibility to
patterns. Housing expectations in terms of size, quality and work, schools, friends and family – recreation,
� construction costs
location have also increased faster than household incomes. both by way of the trade-offs households
The problem will worsen if, as projected, there is increasing � the limited capacity of the building might have to make between dwelling
demand for housing and a continuing shortfall in supply. and construction industry to produce location and transport costs, and in terms
Overall (aggregate) housing affordability and affordable housing, sufficient housing of the total demands housing and transport
require different types of actions (see Box 11.1). Multi-sector jointly make on household incomes”
� the economics of housing development of
collaboration is required to achieve housing affordability. (Productivity Commission)
different types in different locations.
Demand side:
� gap between household income and cost
Social housing
of buying or renting a house Subsidised rental housing for people who are
� restricted access to debt finance on the lowest incomes, unable to pay private
� changed social and economic context, market rates and unlikely to be able to own
such as student loan debt their home; or people who are vulnerable
and /or have special needs. Social housing
� an Accommodation Supplement that has
not kept up with housing costs. includes emergency housing, refuges, and
supported group homes. Currently, the vast
majority of social housing is provided by
Affordable housing HNZC and is usually referred to as state
New Zealand has no legislative or housing. Social housing is also provided
regulatory definition of affordable housing, (to a much lesser extent) by Auckland
but the term is generally used to refer Council (Housing for Older People) and the
to low- to moderate-income households community housing sector.
requiring some form of assistance (a
subsidy or intervention).
* The Canadian Crowding Index is used as it is sensitive to both household size individuals or families perceive themselves to live in crowded housing.
and composition. The measure sets a bedroom requirement for households Perceptions of crowding are likely to vary, dependent on a number of factors,
based on precise criteria. The Index does not take into account whether including cultural and social expectations.
278Figure 11.3 – Number and percentage of households spending more than 30% of gross
income on housing
Figure 11.3 Figure 11.3 – Number
Number and percentage
of Households of30%
spending households
or morespending more than
of gross income 30% ofcosts**,
on housing gross by
Household projections – income on housing
Gross Household Income Bracket and Tenure, 2009-2010 Household Economic Survey
family types (Statistics NZ)
Number of Households spending 30% or more of gross income on housing costs**, by
160,000 Gross Household Income Bracket and Tenure, 2009-2010 Household Economic Survey
(Statistics NZ)
140,000
160,000
120,000
636_ Aucklanders on average spend a higher proportion of their 140,000
income on housing than New Zealanders in any other region. 100,000
120,000
There is no single measure of housing affordability in New 80,000
CHAPTER CHAPTER
Zealand, but one internationally used measure is that housing 100,000
60,000
is unaffordable if housing costs make up more than 30% of
80,000
a household’s gross income (see Figure 11.3). Applying this
CHAPTER 11 AUCKLAND’S HOUSING
40,000
1 AUCKLAND’S
measure to Auckland households gives a sense of the magnitude 60,000
20,000
of the housing affordability problem in Auckland, especially for
40,000
1 AUCKLAND’S
low- to moderate-income households who are renting.* 0
PEOPLE PEOPLE
20,000 Under $30,001 $30,001- $50,001- $70,001- $100,000 All income
637_ These graphs illustrate that about 28% of all households $50,000 $70,000 $100,000- over brackets
0 Gross Household Income
pay more than 30% of their gross income on housing, and Under $30,001 $30,001- $50,001- $70,001- $100,000 All income
NGA- IWI NGA-
that the problem is considerably worse for certain types of Rent paid $50,000 $70,000 $100,000- in Family Trust
Owned/held over without mortgage
brackets
households. Specifically: Owned/held in Family Trust with mortgage All Income
Gross Household tenures
O TA-MAKI
45% of rental households pay more than 30% of their gross
NGA WHARE NOHO O TAMAKI MAKAURAU
Rent paid Owned/held in Family Trust without mortgage
-IWI O MAKAURAU
income on housing costs Owned/held in Family Trust with mortgage All tenures
TA-MAKI MAKAURAU
as household income reduces, households are more likely to
pay more than 30% of their gross household income on basic Per cent of Households spending 30% or more of gross income on housing costs**, by
housing costs Gross Household Income Bracket and Tenure, 2009-2010 Household Economic Survey
(Statistics NZ)
-
as many as 85,000 rental households earning less than Per cent of Households spending 30% or more of gross income on housing costs**, by
$70,000, pay more than 30% on their housing costs 90% Gross Household Income Bracket and Tenure, 2009-2010 Household Economic Survey
(Statistics NZ)
of households in the $50,000-$70,000 band who own a home 80%
90%
with a mortgage, 60% pay more than 30% of their income on 70%
housing costs. 80%
60%
70%
638_ A way of illustrating the size of the housing problem 50%
spatially is by applying the Median Multiple Measure (MMM) 60%
40%
Housing Affordability in Auckland. The MMM takes the annual 50%
Median Household Income (MHI) and divides it by the Median 30%
40%
House Price to obtain a measure of dwelling affordability 20%
relative to annual MHI. It is generally agreed that if the 30%
Median House Price is less than three times the annual MHI, 10%
20%
it is 'affordable'. If the Median House Price is more than three 0%
times the annual MHI, it is considered 'unaffordable'. Map 11.1 10% Under $30,001 $30,001- $50,001- $70,001- $100,000 All income
$50,000 $70,000 $100,000- over brackets
shows housing affordability in Auckland. For Median House
0% Gross Household Income
Price, average capital values in 2006 have been used as a proxy Under $30,001 $30,001- $50,001- $70,001- $100,000 All income
and annual MHI figures are from the 2006 census. In 2006, the Rent paid $50,000 $70,000 $100,000- in Family Trust
Owned/held over without mortgage
brackets
annual MHI was approximately $64,000 – in 2012 annual MHI Owned/held in Family Trust with mortgage All Income
Gross Household tenures
is approximately $72,000.
Rent paid Owned/held in Family Trust without mortgage
Owned/held in Family Trust with mortgage All tenures
* Note Household Economic Survey’s limitations with small samples only **39 selected HES expenditure categories
providing rough estimates.
1
279 1- -
CHAPTER 11 AUCKLAND’S HOUSING NGA WHARE NOHO O TAMAKI MAKAURAU
639_ Map 11.1 clearly shows that, in most areas, housing is 641_ Similarly, a nurse earning $80,000 and his/her partner
unaffordable for people on the MHI of the area. So although are looking for a 2-bedroom dwelling (as they want to start
there are areas where housing is less expensive, it is still a family), near the hospital because of shift work. The value
unaffordable for the median income households in those areas. of the dwelling could be $500,000; more than six times the
The areas shaded in light brown are unaffordable, and those nurse’s salary, and would require a deposit of $100,000.
in red are very unaffordable for local households on the MHI.
There are no shaded areas in yellow, which means that there 642_ Another way to look at housing affordability is to
are no affordable areas for local households on the MHI based consider the number of people in paid employment trying to
on the data available. Grey hatching indicates areas where MHI buy their first home. In Auckland, it has become more difficult
is more than $100,000 and the ratio of affordability cannot to buy a home in the lowest quartile of house prices, when one
be accurately calculated because of the way data is collected. or even two people are in paid employment. Research on the
However, some households in this category will also find their Auckland Region Housing Market showed that between 1996
local area unaffordable. and 2009, the number of people in paid employment unable
to buy a home in the lowest quartile more than doubled, from
640_ For example, two employed people want to buy a house 36,720 households to 77,110.64 This was measured when
in the area where they have grown up. One is a qualified early lending criteria included a 10% deposit. Now, the deposit
childhood care worker with a salary of $45,000 p.a. and the required has increased to 20%, making home ownership even
other is a carer for older people working part-time, on a salary more difficult. If we apply the Median Multiple Measure to
of $20,000 p.a. Their combined household income is $65,000. the number of projected households in Auckland, the housing
They want to buy a 3-bedroom house as they have three problem will worsen. Table 11.1 illustrates household incomes
children. To economise on space, two children will share a and housing affordability from the 2006 census.*
bedroom. However, a house price in the lower quartile in this
area is approximately $350,000 to $400,000, which is more
than four times their combined income, and they would need
a deposit of $60,000.
*
See Table 11.1 note
280Ōrewa
Map 11.1 Housing affordability
- using the Median Multiple Warkworth
Measure (2006 Capital Values)
Whangaparāoa
Pukekohe
Hauraki
Gulf
CHAPTER 11 AUCKLAND’S HOUSING
Albany
Kumeū
Takapuna
NGA WHARE NOHO O TAMAKI MAKAURAU
City
-
Centre
Wa i t e m a t ā
Harbour
Henderson Maraetai
Mount
-
Saint
Eden Johns
Howick
Onehunga
Waitākere Titirangi
Ranges
Manukau
Manukau
Harbour
Railway
Roads
Median Household Income
is => $100k p.a. Papakura
Median Multiple Measure
No data
>0 - 3: affordable (none)
>3 - 6: unaffordable
> 6: very unaffordable
All data is at 2006 Meshblock Geography.
Median House Price data is from previous
´
Territorial Authority (TA) records and each
TA had slightly different valuation systems
and 3 yearly cycles. 0 2.5 5 Km
Last updated: 30 April 5:00pm
281- -
CHAPTER
THE 11 AUCKLAND’S
AUCKLAND PLAN THEHOUSING NGALIVEABLE
WORLDS MOST WHARE NOHO
CITY O TAMAKI MAKAURAU
TABLE 11.1 INCOME AND HOUSING AFFORDABILITY FOR THE AUCKLAND REGION –
USING MEDIAN MULTIPLE MEASURE*
Income Band (2006) Assumed Income House Price to
Share of Households
Households Mid-point (2010) Income Ratio of 4
$20,000 or Less $16,500 14% $66,000
$20,001 - $30,000 $27,500 10% $110,000
$30,001 - $50,000 $44,000 17% $176,000
$50,001 - $70,000 $66,000 15% $264,000
$70,001 - $100,000 $93,500 17% $374,000
$100,001 or More $143,000 28% $572,000
643_ This analysis indicates that if future households have 644_ Current median-priced homes are in the order of
a similar income profile to households in 2006, then of the $450,000. A substantial number of dwellings need to be
400,000 future households in 2040, only about 30% will be offered in the mid-priced range, if housing affordability is to
able to afford a house over $400,000 (in 2011 dollar terms). be improved. This analysis provides only estimates, but it does
Another 30% will need a house in the $275,000 to $375,000 give a strong signal of the severity of the problem in Auckland.
price range. There will be 40% who probably cannot afford to The Auckland Region Housing Market Assessment Report
buy a house, but will need affordable rental accommodation. also concluded that even households earning the median
This would mean that: household income are being locked out of home ownership65.
This indicates that households which fall within the band of
Additional households which would need a 120,000 80% to 120% of the median household income, are likely to
home in the $275,000 – $375,000 need some sort of subsidised home ownership. The private
price range sector undertakes the vast majority of housing development in
Auckland, and this is appropriate. However, given these figures,
Additional households which would need an 160,000 and the depressed state of the development and construction
affordable place to rent, because they are not sector at present, it is clear that public action will be required
able to buy a home to encourage developers to build affordable homes within
mixed tenure, mixed income communities.
645_ Between 1991 and 2006 home ownership in Auckland
declined from 74% to 64%. This decrease is similar to the
figures for all New Zealand, which fell from 74% to 67% over
the same period. Rates of home ownership are much lower for
Pacific people and Māori than other groups: in 2006, 25.8% of
Māori and 21% of Pacific people in Auckland owned, or partly
owned, their own homes compared to 55.8% of Europeans
and 36.7% of Asians.** Although more people are choosing
to rent long term, home ownership remains part of the New
Zealand culture; it is an important barometer of household
wealth creation, savings, standard of living in retirement,
and intergenerational wealth. In New Zealand, investment in
housing has proved a particularly attractive alternative to the
share market (see Figure 11.4).
* • The first column is 2006 data on income bands from the census. • The final column is the maximum house price that the various household
• The second column is the 2006 income data updated approximately to bands could buy at a house price to income ratio of four (normally house
2010 figures. price to income ratio of three is considered affordable), based on the 2010
• The third column is the per cent of households in each income band, income figures.
according to the 2006 distribution of households.
1282 ** These figures are for individuals, not households.41 - 50 %
51 - 70 %
Figure 11.4 Percentage 71 - 100 %
of home renting by 11.4
Census Area Unit
CHAPTER 11 AUCKLAND’S HOUSING
NGA WHARE NOHO O TAMAKI MAKAURAU
-
HOME RENTING BY
CENSUS AREA UNIT
-
646_ The rental market does not currently provide the security 647_ The shortage of social housing for the most vulnerable
and amenity households need. On average, tenants move every is also a serious issue. The official New Zealand definition
2 years compared with every 5-6 years for home owners. This (Statistics NZ) of ’homelessness’ includes rough sleepers,
is costly and can adversely affect health, schooling, and work. people moving between temporary shelters (such as refuges,
Legislation, subsidies and other mechanisms should be explored or the homes of friends and relatives), people in caravan
to encourage large-scale rental investors to offer longer tenure parks, and people living in temporary accommodation without
options for rental accommodation. their own bathroom or kitchen. There are about 160 to 320
rough sleepers in the city centre. There is a serious lack of
emergency housing in Auckland, especially for women, young
people and Gay, Lesbian, Bisexual, Transgender and Intersex
(GLBTI) people. This gap must be filled, to ensure adequate
emergency housing across all population groups. More urgent,
multi-agency collaboration is required, such as the Auckland
Homeless Action Plan, in which the Auckland Council is a
partner. The Council will seek central government support
in dealing with homelessness and in adequately resourcing
agencies dealing locally with homelessness issues.
283- -
CHAPTER 11 AUCKLAND’S HOUSING NGA WHARE NOHO O TAMAKI MAKAURAU
648_ Given this situation, state housing (social housing 649_ The community housing or ‘third’ sector is still very
provided by central government through Housing New small in New Zealand. Generally this sector has focused on
Zealand Corporation (HNZC)), plays a critical role. HNZC is the households HNZC cannot accommodate, the most
the major provider of social housing, and a significant landlord vulnerable, and those with special needs. However, this sector
in Auckland with around 30,600 properties. Over the next 5 could be a major provider of affordable housing.
years, HNZC intends to buy, lease, and sell properties in areas
of high demand and reduce the concentration of state housing 650_ Recently, central government established the Social
in areas of lower demand. Auckland, particularly the south, Housing Unit, which is responsible for investing in social
is acknowledged as an area of high demand. HNZC intends housing projects and building the capacity of the community
to add up to 1,400 new state homes in Auckland in the next housing sector. Its aim is to create a more diverse and
5 years. This is welcome. However, given the current and responsive sector, and increase the pool of affordable homes
future scale of the housing crisis in Auckland, a much larger provided by that sector.66 This is in recognition of the
increase in social housing is required. The Auckland Council community housing sector’s potential to be a major provider
also supports decentralised, community-based HNZC support of affordable housing. There are many models overseas of
services as a vital service for HNZC tenants and others in shared equity schemes and other forms of assisted home
housing need. These services should be part of a network of ownership delivered through the community sector. The New
community hubs (see Chapter 1: Auckland’s People). Zealand Housing Foundation has a successful social enterprise
model, making housing affordable for low- to median-income
households in a sustainable way.
284Box 11.2
Ta-maki Transformation Programme
The Tāmaki Transformation Programme (TTP), led by
a joint initiative involving central government, the
Auckland Council and the local community, began as
an opportunity for community renewal through the
modernisation and redevelopment of state housing stock
CHAPTER 11 AUCKLAND’S HOUSING
in Tāmaki (broadly comprising the suburbs of Glen Innes,
Point England and Panmure).
The Tāmaki population of approximately 17,000 is
projected to grow to 26,000 by 2031. There are 5,000
households, of which Housing New Zealand Corporation
(HNZC) owns 56% of the housing stock.
The TTP is a 15- to 20-year regeneration initiative aimed
at transforming Tāmaki into a thriving, prosperous place
NGA WHARE NOHO O TAMAKI MAKAURAU
to live. Goals include increasing the number of houses,
-
reducing high unemployment, and raising educational
levels, skills and income.
The Government, together with Auckland Council, has
established an Interim Tāmaki Transformation Board
-
(ITTB) and is working to set up an urban regeneration
development entity (URDE). The Tāmaki area is an ideal
651_ The Auckland Council has land holdings across Auckland,
location for intensification: it is close to Auckland’s CBD
which can be leveraged in different ways to improve
(13km), has good accessibility to the eastern railway line,
affordability. The Council already directly provides 1,480 units
is near the Tāmaki Estuary, and has many single dwellings
of social housing for low-income, older people, and regards
on large sections that could be redeveloped.
facilitating affordable housing as part of its mandate. Through
the Housing Strategic Action Plan, the Council intends to It is envisaged that over 20 years an URDE could almost
increase its own housing stock and, in consultation with double the number of housing units through optimising
partners, will adopt a 30-year target for new council housing. land use and existing housing stock, and private housing
development. The number of social housing units would
652_ There is significant scope for the Auckland Council
not reduce, but could be managed by HNZC and third
to work with central government and other agencies to
sector providers. A number of broader social outcomes
increase the supply of housing for low-income people and
could be delivered. The URDE would be actively
develop more mixed tenure, mixed income communities. The
involved in economic development and support Tāmaki
Tāmaki Transformation Project (see Box 11.2), an initiative
residents to obtain skills, knowledge and employment
of urban regeneration integrated with economic and social
opportunities, and dramatically reduce benefit
development, is one of several potential models for other areas
dependency.
that may not be attractive to the market without intervention.
However, the well-being and stability of existing communities The TTP could be a model for other regeneration
must be protected during redevelopment, by tenants being initiatives in Auckland over the 30-year life of this Plan.
relocated within their own communities, where possible.
285- -
CHAPTER 11 AUCKLAND’S HOUSING NGA WHARE NOHO O TAMAKI MAKAURAU
Box 11.3 Principal 653_ The Auckland Council is exploring how it can use land
tools available to Land and assets and other assets as a catalyst for partnerships that could
the Auckland Council increase the supply and choice of affordable housing. The
Some options being considered are:
to improve housing Council also has a range of planning and regulatory tools it
affordability � leveraging Auckland Council-owned land and assets is examining to determine the impact they have on housing
through partnerships, joint ventures and similar affordability. (See Box 11.3).
participation in redevelopment authorities
� leasing 654_ The quality compact urban form established in this Plan
should increase overall affordability through higher-density
� selling
living, better use of land and economies of scale, reduced
� Council-led development. construction costs, and targeting house sizes more directly
to the households requiring them. It can also reduce transport
Planning and regulation costs by making public transport connections easier,
and encouraging mixed-use development that co-locates
In addition to providing sufficient unconstrained
housing and jobs (see Chapter 10: Urban Auckland).
development capacity, options include:
� reviewing regulatory and assessment processes to 655_ An overall increase in housing which outstrips any
provide a simplified, speedier and less costly consent increase in numbers of households, or an increase in land
process supply or overall decrease in construction costs, is likely
� through the Unitary Plan and Local Area Plans, requiring to lower overall housing prices over time. For example, a
developments to provide a mix of dwelling sizes $700,000 house might be reduced to $600,000. However,
and types this will not help the 32% of Auckland households who can
� fast-tracking developments and/or mitigating only afford to buy a house in the $264-$374,000 price range
development contributions and consent fees for (for 2010 prices see Table 11.1). They would still be unable
developments to increase the supply of a particular type to purchase a home or finance the ongoing housing costs, as
of housing, or ease overcrowding in targeted areas they could not save the required deposit or secure a mortgage.
Ways must be found to significantly reduce development
� providing density bonuses as an incentive for affordable
and construction costs and significantly increase the supply
housing
of housing in the $260,000 to $375,000 range; for example,
� auctioning of development rights to landowners. reducing construction times and providing small lots with strict
This would reduce the uncertainty associated with guidelines for well-designed, smaller housing.
development, and therefore reduce overall costs, and
create a mechanism for an ordered release of land*
� considering other options such as betterment levies,
which capture for the community a proportion of the
Directive 11.5
uplift in value that accrues to individual developers as Auckland Council commits to working
a result of a change of use or development. Local or with others to urgently investigate and
central government could choose to assign a proportion use the whole range of possible housing
or all of the revenue collected to subsidise affordable development vehicles, policy and
housing; in the same way, it could decide to assign the regulatory tools, that would increase
revenue raised to another community good.
the supply of affordable housing
in Auckland.
* There is precedence for land auctioning in the Resource Management Act
(1991) where Part VII of the Act details a coastal tendering process for the
release of coastal land for development
286656_ The Auckland Council will urgently develop a Housing 658_ Pacific peoples are also amongst the lowest income
Strategic Action Plan to deliver the high-level directions groups. They often live in extended families, and have the
on housing in the Auckland Plan. The Auckland Council will highest incidence of overcrowding. They also make up a
actively explore all the mechanisms within its statutory significant proportion of state housing tenants. The adverse
mandate that will contribute to increasing the supply of impacts on health, education and family well-being are well
affordable housing and improve housing affordability. This documented (see Chapter 1: Auckland’s People). The former
will require collaboration with central government, the HNZC Healthy Housing programme particularly benefited
development sector, the community housing sector, iwi Pacific peoples, as it built, converted or extended homes
and others to develop practical solutions. The Council will to provide more bedrooms and communal areas for larger
advocate to central government to improve access to first families. The principles of the project, and Pacific design,
CHAPTER 11 AUCKLAND’S HOUSING
home ownership. should continue to be reflected in HNZC’s new buildings and
renovations, and be encouraged in the private sector. The
Auckland Council will also investigate solutions such as minor
household units or modular housing, to ease overcrowding
Directive 11.6 and increase choice. To date, government home ownership
schemes have had limited success with Pacific communities.
Explore all options to reduce Home financing schemes also need to be flexible and culturally
homelessness, in partnership between the appropriate for Pacific peoples.
Auckland Council, central government and
NGA WHARE NOHO O TAMAKI MAKAURAU
the community sector.
-
Directive 11.8
Increase housing supply and choice that
657_ An increase in the supply of affordable and social meets Pacific people’s specific needs.
-
housing will benefit Māori, who feature disproportionately in
lower-income brackets, and as state housing tenants. However,
establishing papakāinga, including housing, is an important
cultural aspiration for iwi. (see Chapter 2: Auckland’s Māori). All
parties must work together to remove barriers and support the
development of papakāinga, including papakāinga housing, on
both traditional and non-traditional Māori land and general land.
Directive 11.7
Support Maori to achieve affordable,
healthy and sustainable housing which
meets their specific needs.
287You can also read


