How Does Diet Change with A Diagnosis of Diabetes? Protocol of the 3D Longitudinal Study - MDPI
←
→
Page content transcription
If your browser does not render page correctly, please read the page content below
nutrients
Protocol
How Does Diet Change with A Diagnosis of
Diabetes? Protocol of the 3D Longitudinal Study
Emily Burch 1 , Lauren T. Williams 1 , Harriet Makepeace 1 , Clair Alston-Knox 2               and
Lauren Ball 1, *
 1   Menzies Health Institute Queensland, Griffith University, Gold Coast 4215, Australia;
     emily.burch@griffithuni.edu.au (E.B.); lauren.williams@griffith.edu.au (L.T.W.);
     harriet.makepeace@griffithuni.edu.au (H.M.)
 2   Office of the Pro-Vice Chancellor, Arts, Education and Law, Griffith University, Mount Gravatt Campus,
     Brisbane 4222, Australia; c.alston-knox@griffith.edu.au
 *   Correspondence: l.ball@griffith.edu.au

 Received: 8 December 2018; Accepted: 10 January 2019; Published: 12 January 2019

 Abstract: Diet quality influences glycemic control in people with type 2 diabetes (T2D), impacting
 their risk of complications. While there are many cross-sectional studies of diet and diabetes, there is
 little understanding of the extent to which people with T2D change their diet after diagnosis and
 of the factors that impact those changes. This paper describes the rationale for and design of the
 3D longitudinal Study which aims to: (i) describe diet quality changes in the 12 months following
 T2D diagnosis, (ii) identify the demographic, physical and psychosocial predictors of sustained
 improvements in diet quality and glycemic control, and (iii) identify associations between glycemic
 control and diet quality in the 12 months following diagnosis. This cohort study will recruit adults
 registered with the Australian National Diabetes Services Scheme who have been recently diagnosed
 with T2D. Participants will be involved in five purposefully developed telephone surveys, conducted
 at 3 monthly intervals over a 12-month period. Diet quality will be determined using a 24-h dietary
 recall at each data collection point and the data will be scored using the Dietary Approaches to
 Stop Hypertension (DASH) diet-quality tool. This study is the first dedicated to observing how
 people newly diagnosed with T2D change their diet quality over time and the predictors of sustained
 improvements in diet and glycemic control.

 Keywords: type 2 diabetes mellitus; nutrition; DASH; diet quality; diabetes management; dietary
 intake; longitudinal analysis; lifestyle management

1. Introduction
     Diet quality plays a vital role in helping people with type 2 diabetes (T2D) to achieve and maintain
optimal glycemic control, thereby lowering their risk of developing diabetes-related complications [1].
Diet quality can be described as the extent to which food intake complies with national or international
dietary guidelines or a priori diet quality score [2]. Investigating diet quality based on dietary patterns,
defined as multiple dietary components operationalized as a single exposure [3], provides valuable
information, beyond analyzing specific nutrients (e.g., protein) or food groups (e.g., dairy) [4]. This is
because dietary patterns closely reflect actual dietary behavior and have a stronger influence on
disease risk than specific nutrients or foods [5]. Findings from dietary pattern analyses may facilitate
the translation of useful recommendations to health professionals and the general population [5,6].
A dietary pattern rich in whole-grains, fruits, vegetables, legumes, and nuts; moderate in alcohol;
and low in refined grains, red or processed meats, and sugar-sweetened beverages has been shown to

Nutrients 2019, 11, 158; doi:10.3390/nu11010158                               www.mdpi.com/journal/nutrients
Nutrients 2019, 11, 158 2 of 15
improve glycemic control in people with T2D [7]. Consequently, a key feature of international T2D
management recommendations is to eat healthy foods that provide a high-quality diet [8–10].
However, evidence has shown that people with T2D have low-quality diets, despite these
recommendations [10–15]. Our recent systematic review identified that internationally, people with
T2D do not adhere to food group recommendations outlined in dietary guidelines [15]. Qualitative
studies examining lived experiences report that people with T2D find it challenging to adopt and
maintain healthy dietary behaviors after diagnosis [13,14]. Our previous qualitative study that
investigated the experiences and perceptions of Australian adults newly diagnosed with T2D found
that while participants reported making immediate, widespread changes to dietary behaviors that led
to improvements in diet quality initially, they found it challenging to maintain dietary change [13].
Participants described feeling restricted in food choice, being uncertain of ideal dietary behaviors
and felt unheard and rushed when speaking about their diet with health professionals [13]. Similar
results were obtained in a qualitative study in Mexico where people reported making only short-term
adherence to improvements in dietary intake due to difficulties with controlling appetite and eating
with others [14]. While these qualitative findings of experiences raise concerns, it is important to also
investigate quantitative aspects of diet quality change following diagnosis.
Cross-sectional research has assessed the diet quality of people with T2D at a single-point in
time [15], however, no research has quantitatively explored changes in diet quality after diagnosis.
Consequently, there is no evidence as to whether diet quality remains fixed once an individual
is diagnosed with T2D, or whether there are periods of marked increases or decreases in diet
quality. Prospective, observational studies are valuable as they measure events in temporal sequence
and can distinguish causes from effects [16,17]. Many factors influence diet quality. These include
non-modifiable factors such as age and sex, and modifiable factors such as self-efficacy, perception of
current diet, environmental factors such as marketing and food availability, and relationships with
health professionals [11,13]. There is currently no data on the demographic and health characteristics
influencing diet quality change for people with T2D [13,18]. There is a clear need to investigate how
diet changes over time so targeted strategies can be developed to facilitate improved glycemic control.
This paper describes the methodological protocol of the 3D Longitudinal Study, so named
because seeing something in three dimensions adds clarity. In this case it refers to the 3D’s of Diet,
after Diagnosis with Diabetes. The study aims are to:
(i) Describe diet quality changes in the 12 months following T2D diagnosis.
(ii) Identify the demographic, physical and psychosocial predictors of improvements in diet quality
and glycemic control.
(iii) Identify associations between glycemic control and diet quality in the 12 months
following diagnosis.
2. Theoretical Framework
The ability to predict and explain health-related behavior is important for developing strategies
to change those behaviors [19]. The theory of planned behavior (TPB) is among the most influential
and widely applied theories of the factors influencing health-related behavior [19]. According to the
TPB, the single best predictor of a person’s behavior is the intention to perform that behavior [20].
This is predicted by three constructs: attitude, subjective norm, and perceived behavioral control (PBC).
The greater the PBC and more favorable the attitude and subjective norms, the stronger the intent
will be to perform the behavior [20]. According to the TPB, people with T2D will intend to improve
their diet quality to the extent that they believe the likely outcomes of consumption to be favorable,
perceive social pressure from those who are important to them and feel capable of improving their diet
quality without difficulty [21]. The constructs of the TPB are considered strong predictors of healthful
eating and are commonly applied in the development of dietary behavior change interventions [21,22].
This study will integrate the TPB into its design in order to explore the factors that may serve as
moderators in influencing the TPB constructs, thus affecting dietary behaviors and T2D management.Nutrients 2019, 11, 158 3 of 15
3. Materials and Methods
3.1. Study Design
The 3D Longitudinal Study is a prospective observational cohort study that will be conducted in
Australia between 2018–2019. The study will recruit people newly diagnosed with T2D and monitor
their dietary intake over 12 months. The Strengthening the Reporting of Observational Studies in
Epidemiology (STROBE) checklist for cohort studies was used to guide the development of the research
protocol [23]. The 3D Longitudinal Study is registered with the Australian New Zealand Clinical
Trials Registry (ANZCTR) (ref: ACTRN12618000375257) and was approved by the Griffith University
Human Research Ethics Committee (ref: 2017/951). Study results will be published in peer-reviewed
journals and presented at scientific conferences.
3.2. Potential Participants
Eligible participants will be adults aged 18 years or older who have been recently diagnosed
with T2D (18 years Individuals agedNutrients 2018, 10, x FOR PEER REVIEW 4 of 15
consent and arrange data collection. Participants will be informed they can withdraw from the study
at any stage. This recruitment method has been trialed in a feasibility study conducted in 2016–2017
Nutrients 2019, 11, 158 4 of 15
(unpublished) which successfully recruited 22 participants from 1000 email invitees. Of these 22, 17
completed baseline data collection, six participants had left the study by 3 months, however all
participants
baseline remainingsix
data collection, at 3participants
months were retained
had left thetostudy
12 months.
by 3 months, however all participants
remaining at 3 months were retained to 12 months.
3.4. Data Collection
3.4. Data Collection
Data will be collected using a purpose-developed, interviewer-administered telephone surveys
atData
five-time points;
will be baseline,
collected usingand then at 3, 6, 9, and 12
a purpose-developed, months after commencing
interviewer-administered the study.
telephone Surveys
surveys
will be conducted
at five-time by Accredited
points; baseline, and then atPracticing Dietitians
3, 6, 9, and 12 months (APDs). The feasibility
after commencing thestudy
study.found
Surveyseach
willsurvey takes approximately
be conducted by Accredited30 min to complete.
Practicing DietitiansA(APDs).
measuring
The tape will be
feasibility posted
study foundto all
eachparticipants
survey
within
takes two working
approximately 30 mindays of recruitment
to complete. to provide
A measuring enough
tape will timeto to
be posted measure their
all participants waist
within
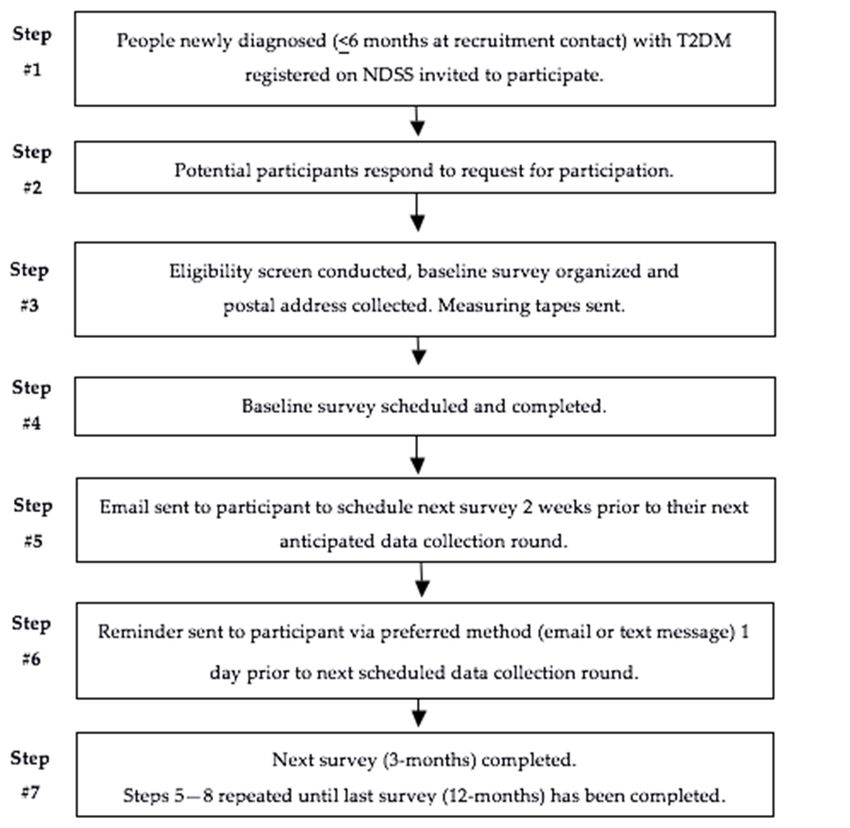
circumference before data collection begins. Strategies including contact and
two working days of recruitment to provide enough time to measure their waist circumference before scheduling methods
datahave been shown
collection begins.toStrategies
improve including
cohort retention
contact in
andlongitudinal
schedulingstudies
methods [26].
have Participants
been shown will
to be
contacted
improve cohort2 weeks prior
retention to their nextstudies
in longitudinal anticipated data collection
[26]. Participants round
will be to schedule
contacted 2 weeksaprior
time.toAll
participants
their will bedata
next anticipated sentcollection
a reminder via to
round their preferred
schedule contact
a time. method (email
All participants or sent
will be text message)
a reminderone
viaday
theirprior to thecontact
preferred date ofmethod
their next survey.
(email The
or text recruitment
message) andprior
one day contact process
to the date ofistheir
outlined in Figure
next survey.
The1.recruitment and contact process is outlined in Figure 1.
Figure
Figure 1.
1. Recruitment andcontact
Recruitment and contact process
process for 3D
for the theLongitudinal
3D Longitudinal
Study. Study.
3.5.3.5.
Survey Design
Survey Design
Data from
Data all all
from secondary outcome
secondary outcome measures
measureswillwill
be be
recorded
recordedin an online
in an survey
online surveymanagement
management
system:
system: www.limesurvey.org [27]. Item wording and response options were composed align
www.limesurvey.org [27]. Item wording and response options were composed to with
to align with
thethe
Australian Bureau of Statistics (ABS) 2016 Census and the Australian Longitudinal
Australian Bureau of Statistics (ABS) 2016 Census and the Australian Longitudinal Study Study on on
Women’s
Women's Health (ALSWH)
Health (ALSWH) to allow
to allowfor for
comparison
comparison of outcomes
of outcomes [28,29]. Survey
[28,29]. Surveyquestions
questions werewere
generated using a developmental model [30] that employs five stages of questionnaire
generated using a developmental model [30] that employs five stages of questionnaire design and design and
testing: conceptualization,
testing: conceptualization,design, testing,
design, revision,
testing, andand
revision, data collection.
data TheThe
collection. feasibility study
feasibility allowed
study allowed
testing of questions to ensure they were comprehendible, relevant and appropriate
testing of questions to ensure they were comprehendible, relevant and appropriate to participants to participants
and to confirm the survey length was suitable. Revisions were then made based on the feedback
provided. For example, some participants in the feasibility study felt they were being asked the same
question twice in the Healthy Eating Belief Scale. Therefore, the interviewer’s scripted introductionNutrients 2019, 11, 158 5 of 15
and description of the Healthy Eating Belief Scale was modified to notify participants that there would
be some repetition. The second draft was then pilot tested on three adults outside of the research team
to ensure comprehensibility, suitability and flow.
3.6. Outcome Measures
Table 2 provides an overview of the primary (diet quality) and secondary outcomes and when
they will be collected.
Table 2. Overview of data collection points in the 3D Longitudinal Study.
Time Collected
Data Collection Methods
0 Months 3 months 6 Months 9 Months 12 Months
Diet quality 4 4 4 4 4
Glycemic control 4 4 4 4 4
Medication use 4 4 4 4 4
Baseline demographic factors 4
Physical factors 4 4 4 4 4
Psychosocial factors 4 4 4 4 4
Exposure to allied healthcare support 4 4 4 4 4
3.6.1. Primary Outcome Measure: Change in Diet Quality (measured by DASH score)
Diet quality can be measured by a variety of purpose developed tools [31]. These are constructed
by assigning higher scores within sub-scales based on more frequent or higher intakes of foods,
nutrients or both [31]. Dietary Approaches to Stop Hypertension (DASH) is a dietary pattern high in
whole-grains, fruits, and vegetables; moderate in low-fat dairy; and low in red and processed meats,
added sugars, and sodium [32]. While originally developed to assist people in the prevention and
management of hypertension, DASH is now recommended for the dietary management of T2D [18,33].
Adherence to DASH positively impacts on glycemic control, weight, and hypertension, which are
key indicators of risk for diabetes-related complications [5,18,32]. A randomized controlled trial
(RCT) conducted in adults with T2D showed that adherence to DASH improved glycated hemoglobin
(HbA1c) (−1.2%), fasting blood glucose (−0.92 mmol/L), weight (−3 kg) and waist circumference
(−4.8 cm) over 8 weeks when compared with a control diet [34,35]. Those following the DASH dietary
pattern, also had a greater reduction in LDL cholesterol (difference from the control diet, −7.7 ± 3.3%).
A systematic review and meta-analysis of 20 RCTs found DASH significantly reduced systolic
(−5·2 mmHg) and diastolic blood pressure (−2·6 mmHg) in adults with and without diabetes [36].
Another systematic review and meta-analysis of 13 RCTs revealed that adults without T2D who adhered
to DASH achieved greater weight loss (−1.42 kg), reduced Body Mass Index (BMI) (−0.42 kg/m2 ) and
decreased waist circumference (−1.05 cm) compared with controls [37]. Considering the recognized
impact on glycemic control, weight and hypertension, DASH was chosen as the dietary pattern used
to assess diet quality in the present study. Participant DASH scores will be calculated using the DASH
diet-quality tool which has been shown to have the highest correlation with health outcomes related to
T2D compared to other tools that measure diet quality [38,39].
Change in DASH score from baseline to 3 months will be used to categorize participants as diet
quality improvers or diet quality maintainers. Participants will be split into 2 groups; those who
improved their DASH score by at least 3 DASH points (Diet quality improvers) and those who
maintained their DASH score within 2.99 points or decreased their DASH score by at least 3 points
(Diet quality maintainers). A change in DASH score of 3 points was selected based on findings from
previous literature [40]. In a 20-year longitudinal study of over 40,000 adults, an average DASH score
of 23.8 out of 40 was observed, and a change in score of approximately 3 points or more was sufficient
to significantly influence long-term glycemic control [40].Nutrients 2019, 11, 158 6 of 15
Dietary intake data will be obtained through the Australian version of the Automated
Self-Administered 24-h Dietary Assessment Tool (ASA-24). The ASA-24 is based on the validated
Automated Multiple-Pass Method (AMPM) which is considered the optimal method for obtaining
24-h recall data due to its numerous probes, standardization of interviewer administration and
validation against recovery biomarkers [41,42]. This method is also consistent with the methodology
of the most recent population nutrition survey in Australia (the National Nutrition Survey) and has
been shown to be a valid measure of dietary behavior at a given time point [43,44]. The ASA-24 is
an online automated questionnaire that guides the individual through a system designed to maximize
respondents’ opportunities for remembering and reporting foods eaten in the previous 24 h [45].
The questionnaire is divided into five phases in line with published methodological guidelines;
‘quick list’, ‘forgotten foods’, ‘time and occasion’, ‘detail cycle’, and ‘final probe’ [45]. These phases
encourage respondents to think about their intake in different ways and from several perspectives
which has been shown to reduce bias in the estimation of dietary intake [45]. Once a specific food or
beverage is reported, systematic questions are asked to capture more precise information about the food,
cooking methods and quantity consumed. The ASA-24, usually a self-completed tool, will be adapted
for use in a telephone survey; a researcher will ask the questions and enter the data. This will reduce
participant burden and help decrease any bias associated with participant information technology
literacy levels. This process was carried out successfully in a feasibility study with patients newly
diagnosed with T2D. The data from the feasibility study was able to be used to assess changes in diet
quality over a 12-month period.
Following data collection, participant 24-h dietary recall data will be sent from the ASA-24
program to the research team. This data will then be manually entered into FoodWorks by
an experienced dietitian to allow determination of participant DASH scores. FoodWorks is a dietary
analysis software program using standardized serve sizes that allows for quantification of specific food
groups (e.g., vegetables) and nutrients (e.g., sodium) obtained from reported dietary intakes, recipes
and meals [46]. FoodWorks draws on the national AUSNUT database [47]. AUSNUT was developed
by Food Standards Australia and New Zealand and includes complete nutrient data sets of Australian
foods designed specifically for nutrition surveys and is therefore suitable for use in this project [47].
DASH scores will be calculated using the standard scoring tool created by Fung et al [39].
Every tenth DASH score will be cross-checked by a second member of the research team to ensure
accuracy. The standard scoring tool determines a score between 8 and 40 points, with 40 points
representing optimal accordance with the DASH dietary pattern [39]. The DASH score is calculated
by summing the number of daily servings of seven dietary components; fruits, vegetables, nuts and
legumes, whole-grains, low-fat dairy, red and processed meats, added sugar, and sodium intake.
For each of the components, participants are classified according to their intake ranking. Higher
intakes of fruits, vegetables, low-fat dairy, whole-grains, and nuts and legumes receive higher scores.
For example, quintile 1 is assigned 1 point and quintile 5 is assigned 5 points. Intake of sodium,
red and processed meats and added sugars are scored in reverse as these are less desirable foods [39].
The lowest quintile is given a score of 5 points and the highest quintile is given a score of 1 point.
The components scores are then summed to give an overall DASH score [39]. The scoring criteria for
the DASH-style diet is outlined in Table 3.Nutrients 2019, 11, 158 7 of 15
Table 3. Dietary Approaches to Stop Hypertension (DASH) dietary pattern scoring criteria.
Component Foods Scoring Quintiles (Q) *
Fruits All fruits and fruit juices
Q1 = 1 point
Vegetables All vegetables except potatoes and legumes
Q2 = 2 points
Nuts and legumes Nuts and peanut butter, dried beans, peas, tofu Q3 = 3 points
Brown rice, dark breads, cooked cereal, whole-grain Q4 = 4 points
Whole-grains
cereal, other grains, popcorn, wheat germ, bran Q5 = 5 points
Low-fat dairy Skim milk, yogurt, cottage cheese
Sodium Sum of sodium content of all foods Q1 = 5 points
Beef, pork, lamb, deli meats, organ meats, Q2 = 4 points
Red and processed meats
hot dogs, bacon Q3 = 3 points
Foods and beverages with added sugars (i.e., sugar Q4 = 2 points
Added sugar
sweetened beverages) Q5 = 1 point
* Q1 represents low consumption and Q5 represents high consumption.
3.6.2. Secondary Outcome Measures
Secondary outcome measures will include: glycemic control, medication use, demographic factors,
physical factors, psychosocial factors, and exposure to health provider support.
Glycemic Control
HbA1c reflects average plasma glucose over the previous six to eight-week period [48,49].
In Australia, it is best practice for GPs to conduct HbA1c testing on people with T2D every 3 months [8].
The test is subsidized by Medicare, the Australian Government’s universal health scheme, up to four
times in a 12-month period [50]. The GP on the research team will retrospectively obtain participants’
HbA1c results over the 12-month study period from the relevant pathology laboratory. Other blood
results collected will include; fasting blood glucose, high-density lipoprotein cholesterol, low-density
lipoprotein cholesterol, and C-reactive protein.
Medication Use
Information on all medication use (name of medication and dosage) will be collected, including
over-the-counter, and complementary medicines.
Demographic Factors
Demographic factors collected at baseline including; age, gender, highest education level, living
arrangement, self-selected social class, household income, ability to manage on income, and smoking
status. Response options will be dichotomous (e.g., gender), continuous (e.g., age) or categorical (e.g.,
highest educational level), consistent with categories used in the national consensus by the ABS.
Age and Gender
Participants’ age at last birthday and gender will be collected. Sex response options will include
three categories in line with the ABS 2016 Census; male, female and other [51].
Highest Education Level
Collecting data on highest educational level helps generate a single measure of an individual’s
overall educational attainment, whether it be a school or non-school qualification [51]. Participants
will be asked to report their highest education level from eight categories in line with the ABS 2016
Census; postgraduate degree, graduate diploma and graduate certificate, bachelor degree, advanced
diploma, diploma, certificate, year 12, or year 11 and below [51].Nutrients 2019, 11, 158 8 of 15
Living Arrangement
Data on participants’ current living arrangement will be collected. In line with the ALSWH,
response options will include; no one, partner/spouse, own children, someone else’s children, parents,
or other adults [29].
Self-Selected Social Class
Requesting information on self-selected social class allows class designation to be meaningful to
participants and is more likely to reflect their actual class identity [52]. Participants will be asked to
self-select their social class from one of four response options in line with the ALWHS; ‘upper class’,
‘middle class’, ‘working class’, or ‘don’t know’ [52].
Household Income and Ability to Manage on Income
Gross income refers to the sum of income received from all sources before any deductions (income
tax, the Medicare Levy or salary sacrificed amounts) are taken out [51]. Participants will be asked to
report their average yearly gross household income from six response options in line with the ALSWH;
less than $20,000, $20,001–$30,000, $30,001–$50,000, $50,001–$100,000, more than $100,000 or ‘don’t
know/would rather not say’. Details on participants’ ability to manage on their current income will
also be collected. Seven response options in line with the ALSWH will include; ‘impossible’, ‘difficult’,
‘always difficult’, ‘sometimes difficult’, ‘not too bad’, ‘easy’, or ‘not sure’ [53].
Smoking Status
Participants will be asked to report their smoking status. Wording of the question has been
developed to correspond with the ABS 2016 Census and response categories will include ‘yes’ or
‘no’ [51].
Physical Factors
Self-reported anthropometric data is valid and recommended for monitoring prevalence of obesity,
particularly for large-scale studies because of its simplicity and low cost [54–56]. Physical factors will
include; self-reported waist circumference, weight, and height. All response options will be continuous.
Waist Circumference
Waist circumference is a better indicator of central obesity than BMI or waist-to-hip ratio and
is more strongly correlated with intra-abdominal fat content and cardiovascular risk factors [57].
Participants will be asked to self-report their waist circumference to the nearest centimeter. Participants
will be asked to report results of two measures at each round of data collection, which will be
averaged during data analysis. Measuring instructions adapted from the ALSWH will be provided to
participants in the postal envelope [58]. Instructions will request participants to measure mid-central
adiposity using the tape to measure at the level of the mid-point between the lower costal border and
the iliac crest [58].
Weight
Weight will be self-reported at each data collection point to the nearest decimal point. If the
participant can only report the amount in stones and pounds, a conversion factor of 2.203 will be used
to convert pounds into kilograms in line with the ALSWH [52]. Participants will be asked to describe
where and how their weight was measured to assess the accuracy of the information.
Height
Height will be self-reported to the nearest centimeter at baseline only. If the participant can only
report the information in feet or inches, a factor of 2.54 will be used to convert inches to centimeters in
line with the ALSWH [52].Nutrients 2019, 11, 158 9 of 15
BMI
BMI provides the most useful population-level measure of obesity [58,59]. Participants’ BMI will
be calculated after each round of data collection using the standard equation (weight (kg)/height
(m)2 ) [58]. Participants will be grouped into BMI categories for analysis according to the World
Health Organization guidelines; underweight (Nutrients 2019, 11, 158 10 of 15
Table 4. Healthful Eating Beliefs Scale rationale for investigation and modes of responses.
Rationale for Standardized Questions and Response
Category Area of Enquiry Source
Investigation Options
“I intend to eat a healthful diet each day in the
next 2 months,” 5-pt Likert
Behavioral “I will try to eat a healthful diet each day in the
[68]
intention next 2 months,” 5-pt Likert
“I plan to eat a healthful diet each day in the
next 2 months,” 5-pt Likert
To better understand
Healthful Eating “I have the self-discipline to eat a healthful
healthy eating beliefs
Beliefs Scale diet” 5-pt Likert
among participants
“I have the ability to eat a healthful diet”
and determine if they
5-pt Likert
change over time. Perceived
“Me eating a healthful diet would be [71]
behavioral control
easy/difficult” 5-pt Likert
“Whether I do or do not follow the
recommendations for my diet is entirely up to
me” 5-pt Likert
“People important to me think I should not/I
should eat a healthful diet” 5-pt Likert
“Other people expect me to follow the daily
recommendations for diet” 5-pt Likert
Subjective norm [71,72]
“People important to me want me to eat a
healthful diet” 5-pt Likert
“Other people with diabetes follow the daily
recommendations for diet” 5-pt Likert
“Following the recommendations for my diet
would be harmful/beneficial” 5-pt Likert
“It would be worthless/valuable for me to
follow the daily recommendations for my diet”
Attitudes towards
5-pt Likert [72]
self-care
“Following daily recommendations for diet is
unnecessary/necessary” 5-pt Likert
Following daily recommendations for diet is
unpleasant/pleasant” 5-pt Likert
Exposure to GP and Allied Healthcare Support
Interactions with health professionals may help facilitate positive changes in dietary behaviors [73].
At each data collection point, participants will be asked about their concurrent and previous exposure
to healthcare provider support (e.g., dietitian, diabetes educator). Participants will also be asked
to report how useful they found the advice on a 5-point Likert scale (1 being ‘not at all useful’,
2 being ’slightly useful’, 3 being ‘neutral’, 4 being ‘somewhat useful’ and 5 being ‘extremely useful’).
Question wording has been modified from previously conducted qualitative research that explored
the experiences of dietary change in people with T2D [13].
3.7. Participant Confidentiality
All study related information will be de-identified and stored securely online with
password-protected access systems. Daily back-ups of all electronic data will occur to minimize
any risk of lost data. Only members of the research team who need to contact study patients, enter data
or perform data quality control will have access to participant information.
3.8. Statistical Modeling and Sample Size
The longitudinal aspect of diet quality change will be analyzed using regression models [74].
Diet quality at 12 months (measured by the DASH score) will be the primary outcome, with glycemic
control, interim diet changes (primarily at 3 months), medication use, demographic measures, physical
measures, psychosocial measures, and exposure to healthcare provider support as the explanatory
variables. This model will determine the relative importance of diet quality change both immediately
after diagnosis and in the medium term with regards to a 12-month outcome towards sustained
healthy eating.Nutrients 2019, 11, 158 11 of 15
Sample size calculations, such as those provided in Diggle et al. [74] are not readily computed for
complex regression models and assessment using simulation studies would be more appropriate [75].
However, due to the relatively small participation rate in the feasibility study (22 participants/1000
invited) credible model parameters are currently unable to be formulated, and the effect differences
over time cannot be reliably inferred. Additionally, current research of diet quality change post diabetes
is lacking [15], therefore effects cannot be competently elicited. As a result, rather than determining
an initial sample size for the study, a Bayesian updating procedure will be used to collect data. In this
manner, sample size will be calculated during the early stages of data collection to yield an idea of
how many samples should be collected. Additionally, using a Bayesian framework, the parameter
estimates of the mixed model will be sequentially updated as batches of data are obtained, a process
known as Bayesian learning [76,77].
4. Discussion
The study described in this paper, the 3D Longitudinal Study, will be the first to observe
changes in diet quality in people with T2D after diagnosis and the factors (demographic, physical,
and psychosocial) that influence those changes. Longitudinal studies help highlight differences or
changes in the values of one or more variables between different time periods, describe participants’
intra-individual and inter-individual changes over time and monitor the magnitude and patterns of
those changes [78]. This is important for the proposed research because it is necessary to understand
the extent to which people change their diet after a T2D diagnosis and why some people are able to
sustain these changes over time and others are not. Understanding this will help to develop targeted
strategies and facilitate enhanced dietary behavior support important to assist all people with T2D
to have long-term success in improving their diet quality and help reduce the risk of complications.
The results of this study will significantly add to the body of literature on the diet quality changes of
people diagnosed with T2D, which is an under-researched area.
Limitations of the 3D Longitudinal Study are acknowledged. Recruitment through the NDSS is
the most suitable way to access a large number of potential participants with T2D, however selection
bias cannot be excluded as registration is voluntary, so participants may have greater diabetes
self-management motivation. Self-reported dietary intake data and physical measurements may
introduce misreporting bias and social desirability responses. Measurement errors associated with
dietary assessment methods are also acknowledged. However, use of the ASA-24 h dietary recall
(Australian version) which is a validated tool specifically designed for the Australian population,
reduces risk of bias [43]. A feasibility study for this project has already determined that its recruitment
capability, data collection and analysis procedures are achievable and appropriate.
Author Contributions: E.B., L.B., H.M. and L.T.W. identified the research question. All authors developed
the research protocol. All authors have been involved in drafting the manuscript and revising it critically for
intellectual content. All authors read and approved the final manuscript.
Funding: This research received no external funding.
Conflicts of Interest: The authors declare no conflict of interest.
References
1. Coppell, K.J.; Kataoka, M.; Williams, S.M.; Chisholm, A.W.; Vorgers, S.M.; Mann, J.I. Nutritional intervention
in patients with type 2 diabetes who are hyperglycaemic despite optimised drug treatment—Lifestyle Over
and Above Drugs in Diabetes (LOADD) study: Randomised controlled trial. BMJ 2010, 341, c3337. [CrossRef]
[PubMed]
2. Leech, R.M.; Worsley, A.; Timperio, A.; McNaughton, S.A. Understanding meal patterns: Definitions,
methodology and impact on nutrient intake and diet quality. Nutr. Res. Rev. 2015, 28, 1–21. [CrossRef]
[PubMed]Nutrients 2019, 11, 158 12 of 15
3. Lockheart, M.S.K.; Steffen, L.M.; Rebnord, H.M.; Fimreite, R.L.; Ringstad, J.; Thelle, D.S.; Pedersen, J.I.;
Jacobs, D.R., Jr. Dietary patterns, food groups and myocardial infarction: A case–control study. Br. J. Nutr.
2007, 98, 380–387. [CrossRef] [PubMed]
4. Drehmer, M.; Odegaard, A.O.; Schmidt, M.I.; Duncan, B.B.; Cardoso, L.D.; Matos, S.M.A.; Molina, M.D.C.B.;
Barreto, S.M.; Pereira, M.A. Brazilian dietary patterns and the dietary approaches to stop hypertension
(DASH) diet-relationship with metabolic syndrome and newly diagnosed diabetes in the ELSA-Brasil study.
Diabetol. Metab. Syndr. 2017, 9. [CrossRef]
5. Sievenpiper, J.L.; Dworatzek, P.D.N. Food and dietary pattern-based recommendations: An emerging
approach to clinical practice guidelines for nutrition therapy in diabetes. Can. J. Diabetes 2013, 37, 51–57.
[CrossRef] [PubMed]
6. Mozaffarian, D.; Ludwig, D.S. Dietary guidelines in the 21st century–A time for food. JAMA 2010, 304,
681–682. [CrossRef]
7. Ley, S.H.; Hamdy, O.; Mohan, V.; Hu, F.B. Prevention and management of type 2 diabetes: Dietary
components and nutritional strategies. Lancet 2014, 383, 1999–2007. [CrossRef]
8. The Royal Australian College of General Practitioners (RACGP). General Practice Management of Type 2
Diabetes: 2016–2018; RACGP: East Melbourne, VIC, Australia, 2016.
9. National Institute for Health and Care Excellence (NICE). Type 2 Diabetes in Adults: Management United
Kingdom; NICE: London, UK, 2017.
10. Vitolins, M.Z. Action for Health in Diabetes (Look AHEAD) trial: Baseline evaluation of selected nutrients
and food group intake. J. Am. Diet Assoc. 2009, 109, 1367–1375. [CrossRef]
11. Nelson, K.M.; Reiber, G.; Boyko, E.J. Diet and exercise among adults with type 2 diabetes: Findings from
the third national health and nutrition examination survey (NHANES III). Diabetes Care 2002, 25, 1722–1728.
[CrossRef]
12. Jarvandi, S.; Gougeon, R.; Bader, A.; Dasgupta, K. Differences in food intake among obese and nonobese
women and men with type 2 diabetes. J. Am. Coll. Nutr. 2011, 30, 225–232. [CrossRef]
13. Ball, L.; Davmor, R.; Leveritt, M.; Desbrow, B.; Ehrlich, C.; Chaboyer, W. Understanding the nutrition
care needs of patients newly diagnosed with type 2 diabetes: A need for open communication and
patient-focussed consultations. Aust J Prim Health 2016, 22, 416–422. [CrossRef] [PubMed]
14. Castro-Sanchez, A.E.; Avila-Ortiz, M.N. Changing dietary habits in persons living with type 2 diabetes. J.
Nutr. Educ. Behav. 2013, 45, 761–766. [CrossRef] [PubMed]
15. Burch, E.; Ball, L.; Somerville, M.; Williams, L.T. Dietary intake by food group of individuals with type 2
diabetes mellitus: A systematic review. Diab. Res. Clin. Prac. 2018, 10, 160–172. [CrossRef] [PubMed]
16. Mann, C.J. Observational research methods. Research design II: Cohort, cross sectional, and case-control
studies. Emerg. Med. J. 2003, 20, 54–60. [CrossRef] [PubMed]
17. Mariani, A.W.; Pego-Fernandes, P.M. Observational studies: Why are they so important? Sao Paulo Med. J.
2014, 132, 1–2. [CrossRef] [PubMed]
18. Evert, A.B.; Boucher, J.L.; Cypress, M.; Dunbar, S.A.; Franz, M.J.; Mayer-Davis, E.J.; Neumiller, J.J.;
Nwankwo, R.; Verdi, C.L.; Urbanski, P.; et al. Nutrition therapy recommendations for the management of
adults with diabetes. Diabetes Care 2013, 36, 3821–3842. [CrossRef] [PubMed]
19. McEachan, R.R.C.; Conner, M.T.; Taylor, N.J.; Lawton, R. Prospective prediction of health-related behaviors
with Theory of Planned Behavior: A meta-analysis. Health Psych. Rev. 2011, 5, 97–144. [CrossRef]
20. Ajzen, I. The theory of planned behavior. Organ. Behav. Hum. Decis. Process 1991, 50, 179–211. [CrossRef]
21. Kothe, E.J.; Mullan, B.A. Interaction effects in the theory of planned behavior: Predicting fruit and vegetable
consumption in three prospective cohorts. Br. J. Health Psych. 2015, 20, 549–562. [CrossRef]
22. Hardeman, W.; Johnston, M.; Johnston, D.W.; Bonetti, D.; Wareham, N.; Kinmonth, A.L. Application of the
theory of planned behavior in behavior change interventions: A systematic review. Psych. Health 2002, 17,
123–158. [CrossRef]
23. von Elm, E.; Altman, D.G.; Egger, M.; Pocock, S.J.; Gotzsche, P.C.; Vandenbroucke, J.P.; STROBE Initiative.
The Strengthening the Reporting of Observational Studies in Epidemiology (STROBE) Statement: Guidelines
for reporting observational studies. Int. J. Surg. 2014, 12, 1495–1499. [CrossRef]
24. National Diabetes Service Scheme (NDSS): Registration. Available online: https://www.ndss.com.au/
registration (accessed on 20 May 2018).Nutrients 2019, 11, 158 13 of 15
25. National Diabetes Services Scheme (NDSS): Type 2 Diabetes. Available online: https://www.ndss.com.au/
data-snapshots (accessed on 1 July 2018).
26. Abshire, M.; Victor, D.D.; Cajita, M.I.A.; Eakin, M.N.; Needham, D.M.; Himmelfarb, C.D. Participant retention
practices in longitudinal clinical research studies with high retention rates. BMC Med. Res. Method 2017, 17,
1–10. [CrossRef]
27. LimeSurvey Organisation. Available online: https://www.limesurvey.org/ (accessed on 1 September 2018).
28. Australian Bureau of Statistics (ABS). Available online: http://www.abs.gov.au/ausstats/abs@.nsf/Lookup/
bySubject/2008.0~{}2016~{}MainFeatures~{}Age~{}99 (accessed on 1 September 2018).
29. Elstgeest, L.E.M.; Mishra, G.D.; Dobson, A.J. Transitions in living arrangements are associated with changes
in dietary patterns in young women. J. Nutri. 2012, 142, 1561–1567. [CrossRef] [PubMed]
30. Brancato, G.; Macchia, S.; Murgia, M.; Signore, M.; Simeoni, G.; Blanke, K.; Körner, T.; Nimmergut, A.;
Lima, P.; Paulino, R.; et al. Handbook of Recommended Practices for Questionnaire Development and Testing in the
European Statistical System; Eurostat: Luxembourg city, Luxembourg, 2004.
31. Collins, C.E.; Burrows, T.L.; Rollo, M.E.; Boggess, M.M.; Watson, J.F.; Guest, M.; Duncanson, K.;
Pezdirc, K.; Hutchesson, M.J. The comparative validity and reproducibility of a diet quality index for
adults: The Australian recommended food score. Nutrients 2015, 7, 785–798. [CrossRef] [PubMed]
32. Campbell, A.P. DASH eating plan: An eating pattern for diabetes management. Diabetes Spectrum 2017, 30,
76. [CrossRef] [PubMed]
33. Clark, A.L. Use of the Dietary Approaches to Stop Hypertension (DASH) eating plan for diabetes
management. Diabetes Spectrum 2012, 25, 244–252. [CrossRef]
34. Salehi-Abargouei, A.; Maghsoudi, Z.; Shirani, F.; Azadbakht, L. Effects of Dietary Approaches to Stop
Hypertension (DASH)-style diet on fatal or nonfatal cardiovascular diseases-incidence: A systematic review
and meta-analysis on observational prospective studies. Nutrition 2013, 29, 611–618. [CrossRef]
35. Azadbakht, L.; Surkan, P.J.; Esmaillzadeh, A.; Willett, W.C. The dietary approaches to stop hypertension
eating plan affects C-reactive protein, coagulation abnormalities, and hepatic function tests among type 2
diabetic patients. J. Nutr. 2011, 141, 1083–1088. [CrossRef]
36. Siervo, M.; Lara, J.; Chowdhury, S.; Ashor, A.; Oggioni, C.; Mathers, J.C. Effects of the Dietary Approach to
Stop Hypertension (DASH) diet on cardiovascular risk factors: A systematic review and meta-analysis. Brit.
J. Nutri. 2015, 113, 1–15. [CrossRef]
37. Soltani, S.; Shirani, F.; Chitsazi, M.J.; Salehi-Abargouei, A. The effect of dietary approaches to stop
hypertension (DASH) diet on weight and body composition in adults: A systematic review and meta-analysis
of randomized controlled clinical trials. Obesi. Rev. 2016, 17, 442–454. [CrossRef]
38. Alkerwi, A.; Vernier, C.; Crichton, G.E.; Sauvageot, N.; Shivappa, N.; Hebert, J.R. Cross-comparison of diet
quality indices for predicting chronic disease risk: Findings from the Observation of Cardiovascular Risk
Factors in Luxembourg (ORISCAV-LUX) study. Briti. J. Nutri. 2015, 113, 259–269. [CrossRef] [PubMed]
39. Fung, T.T.; Chiuve, S.E.; McCullough, M.L.; Rexrode, K.M.; Logroscino, G.; Hu, F.B. Adherence to
a DASH-Style diet and risk of coronary heart disease and stroke in women. Arch. Intern. Med. 2008,
168, 713–720. [CrossRef] [PubMed]
40. de Koning, L.; Chiuve, S.E.; Fung, T.T.; Willett, W.C.; Rimm, E.B.; Hu, F.B. Diet-quality scores and the risk of
type 2 diabetes in men. Diabetes Care 2011, 34. [CrossRef]
41. National Institute of Health (NIH). Available online: https://epi.grants.cancer.gov/asa24/respondent/
validation.html (accessed on 1 June 2018).
42. Moshfegh, A.J.; Rhodes, D.G.; Baer, D.J.; Murayi, T.; Clemens, J.C.; Rumpler, W.V.; Paul, D.R.; Sebastian, R.S.;
Kuczynski, K.J.; Ingwersen, L.A.; et al. The US department of agriculture automated multiple-pass method
reduces bias in the collection of energy intakes. Amer. J. Clin. Nutri. 2008, 88, 324–332. [CrossRef] [PubMed]
43. Kirkpatrick, S.I.; Subar, A.F.; Douglass, D.; Zimmerman, T.P.; Thompson, F.E.; Kahle, L.L.; George, S.M.;
Dodd, K.W.; Potischman, N.; et al. Performance of the automated self-administered 24-hour recall relative
to a measure of true intakes and to an interviewer-administered 24-h recall. Amer. J. Clin. Nutri. 2014, 100,
233–240. [CrossRef] [PubMed]
44. Thompson, F.E.; Dixit-Joshi, S.; Potischman, N.; Dodd, K.W.; Kirkpatrick, S.I.; Kushi, L.H.; Alexander, G.L.;
Coleman, L.A.; Zimmerman, T.P.; Sundaram, M.E.; et al. Comparison of interviewer-administered and
automated self-administered 24-hour dietary recalls in 3 diverse integrated health systems. Amer. J. Epidem.
2015, 181, 970–978. [CrossRef]Nutrients 2019, 11, 158 14 of 15
45. Australian Bureau of Statistics (ABS). Available online: http://www.abs.gov.au/ausstats/abs@.nsf/mf/
4363.0.55.001 (accessed on 31 May 2018).
46. Xyris Software: FoodWorks 9 Professional. Available online: https://xyris.com.au/products/foodworks-9-
professional/ (accessed on 1 June 2018).
47. Food Standard Australia New Zealand (FSANZ): Food Nutrient Database FSANZ. Available
online: http://www.foodstandards.gov.au/science/monitoringnutrients/ausnut/foodnutrient/Pages/
default.aspx (accessed on 1 May 2018).
48. Nathan, D.M.; Turgeon, H.; Regan, S. Relationship between glycated haemoglobin levels and mean glucose
levels over time. Diabetologia 2007, 50, 2239–2244. [CrossRef]
49. Schifreen, R.; Hickingbotham, J.M.; Bowers, G.N. Accuracy, precision and stability in measurement of
hemoglobin A1c by "high-performance" cation-exchange chromatography. Clin. Chem. 1980, 26, 466.
50. Australian Government: Medicare Benefits Schedule online. Available online: http://www.mbsonline.gov.
au (accessed on 15 June 2018).
51. Australian Bureau of Statistics (ABS). Available online: http://www.abs.gov.au/ausstats/abs@.nsf/mf/
2901.0 (accessed on 28 May 2018).
52. Williams, L.; Germov, J.; Young, A. The effect of social class on mid-age women’s weight control practices
and weight gain. Appetite 2011, 56, 719–725. [CrossRef]
53. Australian Longitudinal Study on Women’s Health (ALSWH). Australian Longitudinal Study on Women’s
Health, 1946–1951 Cohort Summary 1996–2013; ALSWH: New South Wales, Australia, 2015.
54. Spencer, E.A.; Appleby, P.N.; Davey, G.K.; Key, T.J. Validity of self-reported height and weight in 4808
EPIC–Oxford participants. Public Health Nutri. 2002, 5, 561–565. [CrossRef]
55. Booth, M.L.; Hunter, C.; Gore, C.J.; Bauman, A.; Owen, N. The relationship between body mass index and
waist circumference: Implications for estimates of the population prevalence of overweight. Intern. J. Obesity
2000, 24, 1058–1061. [CrossRef]
56. Chan, N.P.T.; Choi, K.C.; Nelson, E.A.S.; Sung, R.Y.T.; Chan, J.C.N.; Kong, A.P.S. Self-reported waist
circumference: A screening tool for classifying children with overweight/obesity and cardiometabolic
risk factor clustering: Self-reported waist circumference. Pediatr. Obesity 2012, 7, 110–120. [CrossRef]
[PubMed]
57. Ma, W.Y.; Yang, C.Y.; Shih, S.R.; Hsieh, H.J.; Hung, C.S.; Chiu, F.C.; Lin, M.S.; Liu, P.H.; Hua, C.H.; Hsein, Y.C.;
et al. Measurement of Waist Circumference: Midabdominal or iliac crest? Diabetes Care 2013, 36, 1660–1666.
[CrossRef] [PubMed]
58. Williams, L.; Hollis, J.; Collins, C.; Morgan, P. The 40-Something randomized controlled trial to prevent
weight gain in mid-age women. BMC Public Health 2013, 13, 1007. [CrossRef]
59. World Health Organization (WHO). Obesity: Preventing and Managing the Global Epidemic; WHO: Geneva,
Switzerland, 2000.
60. International Diabetes Federation (IDF). IDF Clinical Practice Recommendations for Managing Type 2 Diabetes in
Primary Care; IDF: Brussels, Belgium, 2017.
61. Colberg, S.R.; Sigal, R.J.; Fernhall, B.; Regensteiner, J.G.; Blissmer, B.J.; Rubin, R.R.; Chasan-Taber, L.;
Albright, A.L.; Braun, B.; American College of Sports Medicine; et al. Exercise and type 2 diabetes:
The American College of Sports Medicine and the American Diabetes Association: Joint position statement.
Diabetes Care 2010, 33, e147–e167. [CrossRef] [PubMed]
62. Balducci, S.; Zanuso, S.; Nicolucci, A.; De Feo, P.; Cavallo, S.; Cardelli, P.; Fallucca, S.; Alessi, E.; Fallucca, F.;
Pugliese, G.; et al. Effect of an intensive exercise intervention strategy on modifiable cardiovascular risk
factors in subjects with type 2 diabetes mellitus. Arch. Internal. Med. 2010, 20, 1794–1803. [CrossRef]
[PubMed]
63. Umpierre, D.; Ribeiro, P.A.; Kramer, C.K.; Leitão, C.B.; Zucatti, A.T.; Azevedo, M.J.; Gross, J.L.; Ribeiro, J.P.;
Schaan, B.D. Physical activity advice only or structure exercise training and association with HbA1c levels in
type 2 diabetes: A systematic review and meta-analysis. JAMA 2011, 17, 1790–1799. [CrossRef] [PubMed]
64. van Poppel, M.N.; Chinapaw, M.J.; Mokkink, L.B.; van Mechelen, W.; Terwee, C.B. Physical activity
questionnaires for adults: A systematic review of measurement properties. Sports Med. 2010, 565–600.
[CrossRef]Nutrients 2019, 11, 158 15 of 15
65. Craig, C.L.; Marshall, A.L.; Sjostrom, M.; Bauman, A.E.; Booth, M.L.; Ainsworth, B.E. International Physical
Activity Questionnaire: 12-country reliability and validity. Med. Sci. Sports Exercise 2003, 35, 1381–1395.
[CrossRef]
66. International Physical Activity Group. Available online: https://sites.google.com/site/theipaq/
questionnaire_links (accessed on 1 June 2018).
67. International Physical Activity Group. Available online: https://sites.google.com/site/theipaq/scoring-
protocol (accessed on 1 June 2018).
68. Blue, C.L. Does the theory of planned behavior identify diabetes-related cognitions for intention to be
physically active and eat a healthy diet? Pub. Health Nurs. 2007, 24, 141–150. [CrossRef]
69. Beyond Blue. Available online: https://www.beyondblue.org.au/the-facts/anxiety-and-depression-
checklist-k10 (accessed on 1 June 2018).
70. Tan, L.S.; Khoo, E.Y.; Tan, C.S.; Griva, K.; Mohamed, A.; New, M.; Lee, Y.S.; Lee, J.; Tai, E.S.; Wee, H.L.
Sensitivity of three widely used questionnaires. Qual. Life Res. 2015, 24, 153–162. [CrossRef] [PubMed]
71. Watanabe, T.; Berry, T.R.; Willows, N.D.; Bell, R.C. Assessing intentions to eat low-glycemic index foods by
adults with diabetes using a new questionnaire based on the theory of planned behaviour. Can. J. Diabetes
2015, 39, 94–100. [CrossRef] [PubMed]
72. Gatt, S.; Sammut, R. An exploratory study of predictors of self-care behaviour in persons with type 2 diabetes.
Intern. J. Nursing Studies 2008, 45, 1525–1533. [CrossRef] [PubMed]
73. Agborsangaya, C.B.; Gee, M.E.; Johnson, S.T.; Dunbar, P.; Langlois, M.F.; Leiter, L.A.; Pelletier, C.; Johnson, J.A.
Determinants of lifestyle behavior in type 2 diabetes: Results of the 2011 cross-sectional survey on living
with chronic diseases in Canada. BMC Pub. Health 2013, 13, 451. [CrossRef] [PubMed]
74. Diggle, P. Analysis of Longitudinal Data, 2nd ed.; Oxford University Press: New York, NY, USA, 2002.
75. Green, P.; MacLeod, C.J.; Nakagawa, S. SIMR: An R package for power analysis of generalized linear mixed
models by simulation. Methods Ecol. Evol. 2016, 7, 493–498. [CrossRef]
76. Gill, J. Bayesian Methods: A Social and Behavioral Sciences Approach, 3rd ed.; CRC Press: Boca Raton, FL, USA,
2015.
77. Spiegelhalter, D.J.; Abrams, K.R.; Myles, J.P. Bayesian Approaches to Clinical Trials and Health-Care Evaluation,
1st ed.; John Wiley & Sons: Chichester, UK, 2004.
78. Ruspini, E. Introduction to Longitudinal Research, 1st ed.; Routledge: London, UK, 2002.
© 2019 by the authors. Licensee MDPI, Basel, Switzerland. This article is an open access
article distributed under the terms and conditions of the Creative Commons Attribution
(CC BY) license (http://creativecommons.org/licenses/by/4.0/).You can also read