How Major Global Changes Create Investment Opportunity - 20-07474, PP-2020-3151
←
→
Page content transcription
If your browser does not render page correctly, please read the page content below
How Major Global Changes Create
     Investment Opportunity

20-07474, PP-2020-3151
                                       1
Today’s Speakers
     Moderator                                 Speakers

    Troy Goldstein            Simeon Hyman                Alex Pileggi
   Executive Director,   Global Investment Strategist   Senior Manager,
   National Accounts                                    Product Manager
      ProShares                  ProShares                 ProShares

                                                                          2
Agenda

• Evolution of ETFs Over Time
• Thematic Investing Framework
• Ways to Capture the Opportunity—Why ETFs?
• Thematic Investments & the Portfolio Construction Process

                                                              3
The ETF Evolution
ETF 1.0             ETF 2.0             ETF 3.0             ETF 4.0
Broad Market Beta   Broad Market Beta   Broad Market Beta   Broad Market Beta
                    +                   +                   +
                    Narrow Market       Narrow Market       Narrow Market
                    Beta                Beta                Beta
                    (sectors,           (sectors,           (sectors,
                    countries)          countries)          countries)
                                        +                   +
                                        Rules-Based         Rules-Based
                                        Strategies          Strategies
                                        (smart beta)        (smart beta)
                                                            +
                                                            Thematics

                                                                                4
Three Transformative Changes Impacting the
World
                          The rapid growth of cities will
                          require massive investment in
                          infrastructure while challenging
                          existing social structures and
                          business models.

                          Millennials will supplant Baby
                          Boomers as the largest generation,
                          and their lifestyles and references
                          will have wide impact.

                          Demand for goods and services is
                          being reshaped by an increasingly
                          informed and digitally enabled
                          global population.

Sources: Global Infrastructure Outlook Report (infrastructure development needed by 2040) 2019; World Bank, “Urban Development At-A-Glance” retrieved from worldbank.org (global population) 2020;
Goldman Sachs, “Millennials Coming of Age” infographic retrieved from goldmansachs.com (millennial preferences); United Nations, “Global Life Expectancy” 2019; IPC; Survey Sampling International,
“Online shopping frequency according to online shoppers worldwide as of October 2018,” eMarketer, “Retail e-commerce sales worldwide from 2017 to 2023,” “E-commerce share of total global retail sales
from 2015 to 2023, ” and “Number of digital buyers worldwide from 2014 to 2021” retrieved by Statista (shifting demographics altering demand) June 2019; eMarketer, “Number of digital buyers worldwide
from 2014 to 2021” and ITU “Percentage of global population accessing the internet from 2005, by market maturity” retrieved by Statista, 2019

                                                                                                                                                                                                      5
From Transformative Change to Investment
Opportunity

                From Transformative
                 Change to Theme

                   From Theme to
                 Investment Strategy

                                           6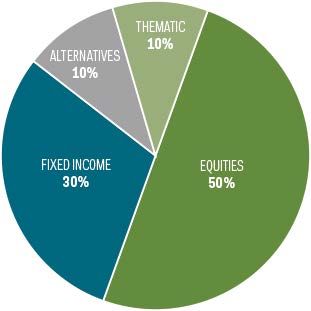
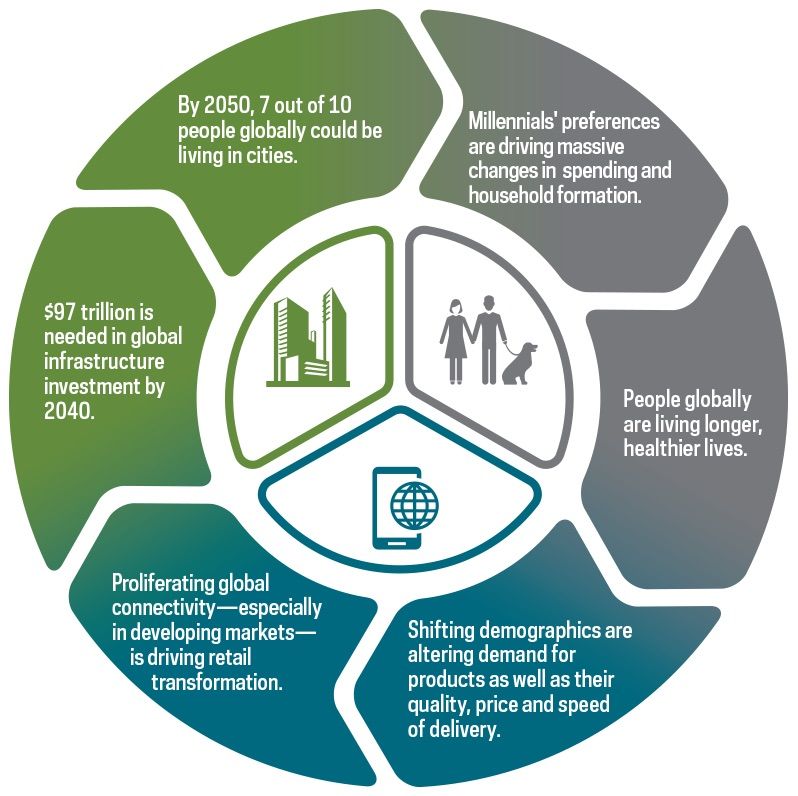
Using Thematic ETFs in a Portfolio

                                  Hypothetical Investment Portfolio

For illustrative purposes only.

                                                                      7
ProShares Thematic Investment Opportunities
                                                               Retail Disruption
                                                               As consumers’ habits change and shoppers move online, e-commerce sales are
                                                               growing rapidly—and undermining in-store retail.
                                                               • By 2020, online sales are projected to surpass $4 trillion.
                                                               • Just over 14% of global retail sales were made online in 2019.
                                                               Global Infrastructure
                                                               As economic opportunity drives the growth of cities, improvements to critical
                                                               infrastructure that supports water and energy access, transportation, and
                                                               communication will be essential.
                                                               • $97 trillion in global infrastructure development is needed by 2040.
                                                               • Global investment in roads needs to reach approximately $900 billion per year to
                                                                    keep pace with projected growth.
                                                               Humanization of Pets
                                                               As Millennials delay having children and Baby Boomers become empty nesters, more
                                                               and more people in both groups are making pets part of their families. And pet care is
                                                               big business.
                                                               • Roughly 67% of U.S. households have pets, up from 56% in 1988.
                                                               • The global pet care industry is expected to grow from $132 billion in 2016 to over
                                                                    $203 billion by 2025.

Sources: Global Infrastructure Outlook Report (infrastructure development needed by 2040) 2019; McKinsey & Company, “A Better Road to the Future” 2018 report (road investments); American Pet
Products Association 2019-2020; Zulily Pets Survey, 2018; Grand View Research, Inc., March 2018, Global Pet Care market industry analysis; "Packaged Facts “Pet Population and Ownership Trends in
the U.S.: Dogs, Cats, and Other Pets, 3rd Edition" , 2019; eMarketer, Retail e-commerce sales worldwide from 2015 to 2023”, 2019 and “E-commerce share of total global retail sales from 2015 to 2023”
retrieved by Statista, June 2019

                                                                                                                                                                                                         8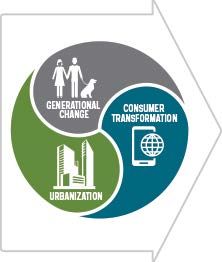
The Retail Disruption Opportunity

                                    9
The Retail Landscape Has Changed Rapidly
• Shopping is going digital
– Since 2014, 600 million more people have become digital buyers
– By 2020 year-end, over 2 billion people are expected to be
digital buyers
• Consumer habits are changing
– 75% of online consumers buy products online at least
monthly
• Not all online retailers are created equal
– Sales during Amazon’s 2019 Prime Day were estimated at $6
billion.
– Alibaba set a Singles Day record in 2019
• Sales hit approx. $38.3 billion by the end of the event.
Sources: eMarketer, 2019, IPC; Survey Sampling International, 2018; CNBC December 4, 2018; Yahoo Finance, 2019; Alibaba Sales CNBC
10Retail Disruption May Be in the Early Innings
Online % of Global Retail Sales
Source: eMarketer; 2019; * estimate
11The Amazon Juggernaut—Early Days
Retailer Net Sales (in millions)
Wal-Mart Stores Inc. $523,964
Amazon.com $280,522
CVS Health Corp. $256,776
Costco Wholesale Corp. $158,350
Walgreens Boots Alliance Inc. $138,704
Kroger Co. $122,286
Home Depot Inc. $110,225
Target Corp. $78,112
Lowe’s Cos. Inc. $72,148
Sysco Corp. $60,461
Best Buy Co. Inc. $43,638
Source: Net Sales Bloomberg, as of 4/17/20. As of 03/31/20, ONLN and CLIX included holdings to Amazon 27.03%, 24.05%..The Solactive-ProShares Bricks and Mortar Retail Store Index, which makes
up the short side of CLIX’s strategy, includes the following constituents as of 03/31/2020: Wal-Mart Stores Inc. 2.98%, Costco Wholesale Corp. 2.81%, Walgreens Boots Alliance Inc. 2.89%, Kroger Co.
3.05%, Home Depot Inc. 2.36%, Target Corp. 2.50%, Lowe’s Cos. Inc. 2.18%, and Best Buy Co. Inc. 2.09%. Constituents are subject to change.
12Traditional Retail Closings Continue
Retail Store Closings 2019
Payless Shoe Source
Gymboree
Dress Barn
Fred's
Charlotte Russe
Family Dollar
Shopko
Charming Charlie
Destination Maternity
Chico's
Gap
Avenue
Walgreens
0 500 1000 1500 2000 2500 3000
Source: Business Insider, “More than 9,300 stores closed in 2020 as the retail apocalypse drags on—here’s the full list,” 12/23/19.
The indexes and funds invest in or have exposure to companies that may have opened or closed stores in 2019. Constituents are subject to change.
13Never-Ending Need for
Infrastructure
14Defining Investable Infrastructure
Generally Grouped in
• Growing asset class offering a
Four Main Segments
potentially attractive investment
opportunity
• Provides benefits to enable Communication Transportation
orderly operation of society
– Essential, long-lived, capital-
intensive assets
• Unique investment characteristics
– Consistent demand, stable cash Energy Water
flows, high barriers to entry
15Growing Need for Infrastructure Creates Long-
Term Opportunity
• According to Global Infrastructure Hub/Oxford Economics,1 there are major needs throughout the world
– Most developed countries have not kept up with required investment
– Growing world population and urbanization trends in developing world fueling incremental demand
• According to American Society of Civil Engineers, our existing infrastructure is crumbling, and in need of
major investment
– Traditional funding sources like municipalities unable to meet future requirements given challenging economy; private
investment needed to fill gap
Cumulative global infrastructure
Infrastructure Category2 Grade
Outlook to 20231
$120
Aviation D
$100
$97
Energy D+
$79
$80
$ Trillions
Ports C+
$60
Roads D
$40
$18 Transit D-
$20
Cost to Improve $4.59T
$0
Current trends Investment Need Shortfall
1 Source: Global Infrastructure Outlook Report (infrastructure development needed by 2040) 2019. 2 American Society of Civil Engineers, https://www.infrastructurereportcard.org/
16Tailwinds Driving the Pet Care
Industry
17Proliferation in Pet Ownership: Measuring the
Trend Itself
• 7 out of 10 U.S. households have pets, more than have children
– Up from 56% in 1988, according to the American Pet Products Association (APPA)
• Number of pets has increased by 55 million in just the past 5 years
84.9 million households have pets
33.4 million households have children
• Increasing pet ownership isn’t just a North American trend
– Similar story taking place in Europe
– Pet ownership is rapidly gaining ground in emerging market economies as disposable income grows,
including in China, India, Southeast Asia and Latin America
Sources: APPA 2019-2020 National Pet Ownership Survey; U.S. Bureau Labor Statistics, 2020, Global Market Insights (pet care industry size) 2019; "Packaged Facts “Pet Population and Ownership
Trends in the U.S.: Dogs, Cats, and Other Pets, 3rd Edition" , 2019
18More and More Owners Are Caring for Their Pets
Like Family
• Pet owners are spending billions on premium-
quality foods, state-of-the-art health care, $30 billion $38 billion
insurance policies, luxury services and more Estimated 2020 Estimated annual
– Humanization spending on spending on pet
veterinary care food in the
• 82% of millennials consider pets to be and product
“starter children” United States
sales in the
United States
– Premiumization
• Pet owners are building an appetite for
premium and even luxury pet products 65% 52%
Owners buy Of pet owners
– State-of-the-art healthcare birthday or believe they feed
holiday gifts for their pets better
• Innovations in veterinary treatments, than themselves
preventive medications, diagnostic and their pets
screening tools, imaging (MRIs and other
scans), and wellness products and
therapies
Sources: American Pet Products Association, 2019-2020, Zulily Pets Survey, 2018; Michelson Found Animal Foundation, “Furred Lines Pet Trends”, 2019; Nielsen "Trends in Pet Care”, 2018
19Pet Care Industry Is Thriving
• Pets are loyal companions and
increasingly thought of as part of the Global Pet Care Industry Sales
family 2016 2025 Est.
– They’re also big business $132 billion $203 billion
• The U.S. pet care industry has grown
steadily since 2001, even through the
Great Recession J.M. Smucker’s
General Mills buyout
– And globally, the pet care industry is expected purchase of
of Blue Buffalo
to grow rapidly Ainsworth, maker of
premium pet food
Rachael Ray Nutrish
– Here in the United States, the pet care brand
brand
industry has seen twice the percentage
growth of GDP since 2007
• Corporate investment has been strong, too Animal health
company Zoetis’
– 163 mergers and acquisitions in 2018 and purchase of
2019 indicate that both established veterinary
companies and investors are attracted to pet diagnostics
care company Abaxis
Sources: APPA 2019-2020 National Pet Ownership Survey; Grand View Research, Inc., March 2018, Global Pet Care market industry analysis; “Capstone Head Waters, 2019 Year in Review,” 2020.
PAWZ has holdings in J.M. Smucker’s 0.66% and Zoetis 3.02% as of 3/31/2020. Constituents are subject to change.
20How to Capture the Investment
Opportunity
21Capturing the Trends
• Identify groups of companies to invest
in whose performance is driven by a Global Trend
specific theme.
– Are there individual companies
dedicated to the specific theme – or
is the new theme being exploited by Theme
incumbent diversified firms?
– Are the dedicated companies public
or private?
– Do the dedicated companies have Investment
any barriers to entry?
– Are there economies of scale?
22Retail Disruption – ONLN and CLIX
ProShares Online Retail ETF (ONLN) lets investors tap into the potential growth of
online retail by pinpointing retailers that principally sell online or through other non-
store channels, and then zeroing in on the largest, most iconic companies in the
space, like Amazon and Alibaba.
• Tracks the ProShares Online Retail Index
ProShares Long Online/Short Stores ETF (CLIX) is the first ETF designed to help
investors benefit from both sides of retail’s transformation—toward online shopping
and away from stores.
• Tracks the ProShares Long Online/Short Stores Index, which is:
– 100% long the ProShares Online Retail Index
– 50% short the Solactive-ProShares Bricks and Mortar Retail Store Index
Source: U.S. Department of Commerce, Feb 2020., ONLN and CLIX include allocations to Amazon 27.03%, 24.05%; and Alibaba 13.56%,12.07% as of 03/31/2020.
23ProShares Online Retail Index
• Tracks retailers that principally sell online or through other non-store channels.
Retailers include U.S. and non-U.S. companies.
• Uses a modified market-capitalization weighting approach, is rebalanced monthly
and is reconstituted annually.
• To be included, a retailer must:
– Be classified as an online retailer, an e-commerce retailer, or an internet or direct
marketing retailer, according to standard industry classification systems
– Have a market cap of at least $500 million, six-month daily average value traded of at
least $1 million, and meet other requirements
• When rebalanced, the index is weighted so that:
– No company exceeds 24% of the value of the index
– Sum of companies individually weighing more than 4.5% may not exceed 50%
– Non-U.S. companies are capped at 25%
24Index Characteristics as of March 31, 2020
ProShares Online Retail Index
Top 10 Companies Weight
Amazon.com Inc. 27.03%
Alibaba Group Holding Ltd.– Sponsored ADR 13.56%
Chewy Inc. – Class A 6.52%
Stamps.com Inc. 4.50%
eBay Inc. 4.23%
Grubhub Inc. 4.02%
Shutterstock Inc. 4.00%
Etsy Inc. 3.95%
Wayfair Inc. 3.83%
Qurate Retail Inc. 3.66%
Top Index Geographies Weight
United States 72.51%
China 23.83%
Argentina 2.09%
United Kingdom 1.05%
Source: ProShares. All data is as of 03/31/2020. Constituents are subject to change; for illustrative purposes only. Sum of weightings may not equal 100% due to rounding; weightings may fluctuate
between monthly rebalances; visit ProShares.com for a complete list of daily holdings.
25Solactive-ProShares Bricks and Mortar Retail
Store Index
• To be included in the index, a retailer must:
– Be characterized as receiving at least 50% of its revenue from retail operations
– Receive 75% or more of its retail revenues from in-store sales
– Be a U.S. company
– In addition, a retailer must have a market capitalization of at least $500 million,
a six-month daily average value traded of at least $1 million, and meet other
requirements
– The index is equally weighted, rebalanced monthly and reconstituted annually
26Index Characteristics as of March 31, 2020
Solactive-ProShares Bricks and Mortar Retail Store Index
Top 10 Companies Weight Top Index Segments Weight
B.J.’s Wholesale Club Holdings Inc. 3.80% Apparel Retail 21.23%
Weis Markets Inc. 3.44% Specialty Stores 16.94%
Sprouts Farmers Market Inc. 3.33% General Merchandise Stores 12.05%
Kroger Co. 3.05% Food Retail 9.82%
Walmart Inc. 2.98% Hypermarkets & Super Centers 9.60%
GameStop Corp. 2.95% Computer & Electronics Retail 6.50%
Tiffany & Co. 2.91% Automotive Retail 4.86%
Walgreens Boots Alliance Inc. 2.89%
Home Improvement Retail 4.54%
Costco Wholesale Corp. 2.81%
Department Stores 4.02%
Dollar General Corp. 2.81%
Source: ProShares. All data is as of 03/31/2020. Constituents are subject to change; for illustrative purposes only. Sum of weightings may not equal 100% due to rounding; weightings may fluctuate
between monthly rebalances. For a complete list of daily fund holdings, visit ProShares.com.
27ProShares Online Retail Index Outperformed
Solactive Bricks-and-Mortar Index
ProShares Online Retail Index vs. Select Retail Store Indexes
November 13, 2017 - March 31, 2020
160
150
140
130
120
110
100
90 S&P 500
80
70
60
11/13/17
12/13/17
10/13/18
11/13/18
12/13/18
10/13/19
11/13/19
12/13/19
1/13/18
2/13/18
3/13/18
4/13/18
5/13/18
6/13/18
7/13/18
8/13/18
9/13/18
1/13/19
2/13/19
3/13/19
4/13/19
5/13/19
6/13/19
7/13/19
8/13/19
9/13/19
1/13/20
2/13/20
3/13/20
ProShares Online Retail Index Solactive-ProShares Bricks and Mortar Retail Store Index S&P Retail Select Index
Source: Bloomberg, 11/13/17–03/31/2020. Index performance is for illustrative purposes only and does not represent fund performance. Index returns do not reflect any management fees, transaction costs
or expenses. Indexes are unmanaged and one cannot invest in an index. Past performance does not guarantee future results.
28CLIX Performance as of March 31, 2020
Since
Fund Inception 11/14/17 Year to Date 1-Year
Inception
ProShares Long Online/Short Stores ETF (CLIX)—NAV 14.00% 8.39% 15.13%
ProShares Long Online/Short Stores (CLIX)—Market Price 14.32% 8.79% 15.26%
ProShares Long Online/Short Stores Index 14.04% 8.30% 15.25%
Source: Bloomberg, 3/31/2020. This fund charges an expense ratio of 0.65%. The performance quoted represents past performance and does not
guarantee future results. Investment return and principal value of an investment will fluctuate so that an investor’s shares, when sold or redeemed, may
be worth more or less than the original cost. Current performance may be lower or higher than the performance quoted. Performance data current to the
most recent month end may be obtained by calling 866.776.5125 or by visiting ProShares.com. Shares are bought and sold at market price (not NAV)
and are not individually redeemed from the fund. Brokerage commissions will reduce returns. Index performance is since inception of ProShares Long
Online/Short Stores ETF on 11/14/17. Index returns are for illustrative purposes only and do not represent fund performance. Index returns do not reflect
any management fees, transaction costs or expenses. Indexes are unmanaged and one cannot invest in an index.
29ONLN Performance as of March 31, 2020
Since
Fund Inception 7/13/18 Year to Date 1 Year
Inception
ProShares Online Retail ETF (ONLN)—NAV -8.58% -13.23% -10.26%
ProShares Online Retail ETF (ONLN)—Market Price -8.35% -13.09% -10.22%
ProShares Online Retail Index -8.46% -12.84% -9.81%
Source: Bloomberg, 3/31/2020. This fund charges an expense ratio of 0.58%. The performance quoted represents past performance and does not
guarantee future results. Investment return and principal value of an investment will fluctuate so that an investor’s shares, when sold or redeemed, may
be worth more or less than the original cost. Current performance may be lower or higher than the performance quoted. Performance data current to the
most recent month end may be obtained by calling 866.776.5125 or by visiting ProShares.com. Shares are bought and sold at market price (not NAV)
and are not individually redeemed from the fund. Brokerage commissions will reduce returns. Index performance is since inception of ProShares Online
Retail ETF on 7/13/18. Index returns are for illustrative purposes only and do not represent fund performance. Index returns do not reflect any
management fees, transaction costs or expenses. Indexes are unmanaged and one cannot invest in an index.
30ProShares DJ Brookfield Global Infrastructure
Index ETF (Ticker: TOLZ)
• TOLZ follows the Dow Jones Methodology
Brookfield Global Infrastructure • Constituents derive more than 70% of
Composite Index cash flows from infrastructure business
– Includes equity securities, including • Developed and emerging markets
companies listed on developed markets
Master Limited Partnerships
exchanges
(MLPs), of global companies with
• Minimum liquidity requirements
strong infrastructure characteristics
• Weighted by float-adjusted market
– Represents all sectors of capitalization
infrastructure market
• Individual stock weights capped at 10%
• Airports, toll roads, ports,
• Country weights capped at 50%
communications, electricity
• Industry weights capped at 50%
transmission and distribution, oil
and gas storage and • MLPs capped at 25%
transportation, and water • Rebalanced quarterly
– Index inception: 7/14/08
31Investing in Infrastructure: Why Pure Play?
Type of Company General Characteristics
Tend to include more infrastructure-
related businesses than direct
Broad infrastructure assets
• Have related infrastructure side
businesses
• Lower margins
Core/Thematic • Not capital intensive
• Do not derive cash flows from long-
duration contracts
Own or operate assets that exhibit
fundamental infrastructure
characteristics:
Pure Play • High barriers to entry
• Relatively constant demand
32Risk Management Benefits: Low Beta
Beta for DJ Brookfield vs. MSCI World as of March 31, 2020
1.20
1.00 0.94
0.87 0.87
0.80 0.75
0.60
0.40
0.20
0.00
1-Year 3-Year 5-Year 10-Year
Source: Morningstar and Bloomberg, as of 03/31/2020. Index returns are for illustrative purposes only and do not represent fund performance. Index performance returns do not reflect any management
fees, transaction costs or expenses. Indexes are unmanaged, and one cannot invest in an index. Past performance does not guarantee future results.
33F
o
r
f
i
n
a
TOLZ Performance as of March 31, 2020
n
c
i
a
l Fund Inception 3/25/14 Year to 1-Year 3-Year 5-Year Since Inception
p Date
r
o ProShares DJ Brookfield Global Infrastructure ETF (TOLZ)—NAV -18.29% -16.91% -2.30% -0.40% 1.22%
f
e ProShares DJ Brookfield Global Infrastructure ETF (TOLZ)—Market Price -18.23% -17.07% -2.40% -0.60% 1.20%
s
s
i
Dow Jones Brookfield Global Infrastructure Composite -18.52% -17.51% -2.76% -0.87% 0.83%
o
n
a
l
u
s
e
o
n
l
y
.
N
o
t
f
o Source: Bloomberg, 3/31/2020. This fund charges operating expenses of 0.46%. The performance quoted represents past performance and does not
r guarantee future results. Investment return and principal value of an investment will fluctuate so that an investor’s shares, when sold or redeemed, may be
p
u
worth more or less than the original cost. Current performance may be lower or higher than the performance quoted. Performance data current to the most
b recent month end may be obtained by calling 866.776.5125 or by visiting ProShares.com. Shares are bought and sold at market price (not NAV) and are not
l individually redeemed from the fund. Brokerage commissions will reduce returns. Index performance is since inception of ProShares DJ Brookfield Global
i
c
Infrastructure ETF on 3/25/2014. Index returns are for illustrative purposes only and do not represent fund performance. Index returns do not reflect any
d management fees, transaction costs or expenses. Indexes are unmanaged and one cannot invest in an index.
i
s
t
r 35. 34
iPure-Play Approach Has Outperformed Since
Inception Growth of $10,000, Monthly Returns
August 2008—March 31, 2020
$30,000
Dow Jones Brookfield Global Infrastructure Composite
$25,000
S&P Global Infrastructure
$20,000
$15,000
MSCI World
$10,000
$5,000
$-
Source: Morningstar, 01/8/2008—3/31/2020. Index returns are for illustrative purposes only and do not represent fund performance. Index performance returns do not reflect any management fees,
transaction costs or expenses. Indexes are unmanaged, and one cannot invest in an index. Past performance does not guarantee future results.
35Consistently Higher Yields Historically
Quarter-End Yields for DJ Brookfield vs. MSCI World Q3 2008–Q1 2020
DJ Brookfield
MSCI World
Source: Bloomberg for S&P and MSCI World Indexes, index provider for Dow Jones Brookfield Global Infrastructure Composite Index. 9/30/2008–3/31/2020
Past performance is no guarantee of future results.
34. 36Dow Jones Brookfield Global Infrastructure
Composite Index: March 31, 2020
Sector Weightings
Oil & Gas Storage &
34.20%
Transportation
Top 10 Companies Weight Top 10 Country Weightings
Communications 21.18%
American Tower Corp.-Class A 9.36% United States 49.16%
Enbridge Inc. 6.20% Canada 15.16% Electricity
Transmission & 16.82%
Crown Castle International Corp. 5.82% United Kingdom 7.41%
Distribution
National Grid Plc 4.69% France 5.55%
Diversified 7.19%
VINCI SA 4.47% Spain 4.74%
Master Limited
TC Energy Corp. Australia 3.95% 6.58%
4.37% Partnerships
Sempra Energy 3.09% China 3.77% Water 6.35%
SBA Communications Corp. 2.95% Italy 3.41% Toll Roads 4.05%
Kinder Morgan Inc. 2.63% Hong Kong 2.55% Airports 3.24%
Consolidated Edison Inc. 2.52% Japan 1.76% Ports 0.39%
Constituents are subject to change.
37ProShares Pet Care ETF (Ticker: PAWZ)
• PAWZ follows the FactSet Pet Care Index Key Pet Care
– Principal revenue source must come from one Subindustries
of eight FactSet Revere Business Industry
Classification System subindustries (RBICS) Pet Food Veterinary
– Generates at least $1 billion in annual Manufacturing Services
revenue from one of the eight RBICS
subindustries
– Companies whose principal business is Internet Pet and Veterinary
identified by the FactSet as pet care related, Supply Retail Pharmaceuticals
but for which an RBICS subindustry has not
yet been created—for example, pet insurance
– At rebalance, the companies whose principal Pet and Pet Veterinary
revenue source comes from pet care related Supply Stores Diagnostics
products or services will make up 82.5% of
the portfolio, while companies that generate
$1 billion or more (but not a principal source) Veterinary
of their revenue from RBICS categories will Pet Supplies
Product
make up 17.5% of the index Manufacturing
Distributors
– The index uses a modified market cap
methodology
38FactSet Pet Care Index:
March 31, 2020
Top 10 Companies
Freshpet Inc. 10.29%
Country Breakdown
Dechra Pharmaceuticals Plc 10.03%
United States 63.90%
Chewy Inc–Class A 9.48%
United Kingdom 22.33%
IDEXX Laboratories Inc. 9.08%
Germany 4.70%
Pets At Home Group Plc 8.41%
Switzerland 4.67%
Zooplus AG 4.70%
France 4.38%
Nestle SA 4.67%
Japan 0.03%
Virbac SA 4.38%
Merck & Co. Inc. 4.30%
Covetrus Inc. 4.26%
Constituents are subject to change.
39PAWZ Performance as of March 31, 2020
Since
Fund Inception 11/5/18 Year to Date 1-Year
Inception
ProShares Pet Care ETF (PAWZ)—NAV -11.94% -2.44% -1.27%
ProShares Pet Care ETF (PAWZ)—Market Price -12.40% -3.09% -1.68%
FactSet Pet Care Index -11.93% -2.06% -0.79%
Source: Bloomberg, 3/31/2020. This fund charges an expense ratio of 0.50%. The performance quoted represents past performance and does not
guarantee future results. Investment return and principal value of an investment will fluctuate so that an investor’s shares, when sold or redeemed, may
be worth more or less than the original cost. Current performance may be lower or higher than the performance quoted. Performance data current to the
most recent month end may be obtained by calling 866.776.5125 or by visiting ProShares.com. Shares are bought and sold at market price (not NAV)
and are not individually redeemed from the fund. Brokerage commissions will reduce returns. Index performance is since inception of ProShares Pet Care
ETF on 11/5/18. Index returns are for illustrative purposes only and do not represent fund performance. Index returns do not reflect any management
fees, transaction costs or expenses. Indexes are unmanaged and one cannot invest in an index.
40Four ProShares ETFs to Tap Into Growing Global
Trends
Operating Expenses
ProShares Online Retail ETF
ProShares Online Retail Index 0.58%
Long Online/Short Stores ETF
ProShares Long Online/Short Stores Index 0.65%
ProShares DJ Brookfield Global Infrastructure ETF
Dow Jones Brookfield Global Infrastructure Composite Index 0.46%
ProShares Pet Care ETF
FactSet Pet Care IndexTM 0.50%
41A Reminder About Risk
This is not intended to be investment advice. Any forward-looking statements herein are based on expectations
of ProShare Advisors LLC at this time. Whether or not actual results and developments will conform to ProShare
Advisors LLC's expectations and predictions, however, is subject to a number of risks and uncertainties,
including general economic, market and business conditions; changes in laws or regulations or other actions
made by governmental authorities or regulatory bodies; and other world economic and political developments.
ProShare Advisors LLC undertakes no duty to update or revise any forward-looking statements, whether as a
result of new information, future events or otherwise.
Investing involves risk, including the possible loss of principal. ProShares ETFs are generally non-
diversified and entail certain risks, including imperfect benchmark correlation and market price variance, that
may decrease performance. Some ETFs may concentrate their investments in certain sectors. Narrowly
focused investments typically exhibit higher volatility. Investments in smaller companies typically exhibit higher
volatility. Small- and mid-cap companies may have limited product lines or resources, may be dependent upon a
particular market niche and may have greater fluctuations in price than the stocks of larger companies. Small-
and mid-cap companies may lack the financial and personnel resources to handle economic or industry-wide
setbacks and, as a result, such setbacks could have a greater effect on small- and mid-cap security prices.
International investments may involve risks from: geographic concentration, differences in valuation and
valuation times, unfavorable fluctuations in currency, differences in generally accepted accounting principles,
and from economic or political instability. In emerging markets, many risks are heightened, and lower trading
volumes may occur. Please see summary and full prospectuses for a more complete description of risks. There
is no guarantee any ProShares ETF will achieve its investment objective.
Shares of any ETF are generally bought and sold at market price (not NAV) and are not individually redeemed
from the fund. Brokerage commissions will reduce returns.
42Important Disclosures
PAWZ is subject to the risks faced by companies in the pet care industry. Although the pet care industry has historically seen steady
growth and has been resilient to economic downturns, these trends may not continue or may reverse. Consumer tastes and
preferences are difficult to forecast. Changing consumer preferences could have a negative impact on the revenue streams of
companies in the pet care industry. Many companies in the pet care industry are small, independent producers and retailers.
TOLZ is subject to risks faced by companies in the infrastructure, energy and utilities industries to the same extent as the Dow
Jones Brookfield Global Infrastructure Composite Index is so concentrated. TOLZ invests in master limited partnerships (MLPs).
Investments in MLPs expose the ETF to certain tax risks associated with investing in partnerships. Changes in U.S. tax laws could
revoke the pass-through attributes that provide the tax efficiencies that make MLPs attractive investment structures. MLPs may
also have limited financial resources, may be relatively illiquid, and may be subject to more erratic price movements because of the
underlying assets they hold. In addition, a portion of TOLZ's distributions may be a return of capital, which constitutes the return of
a portion of a shareholder's original investment. Under tax rules, returns of capital are generally not currently taxable, but lower a
shareholder's tax basis in their shares. Such a reduction in tax basis will result in larger taxable gains and/or lower tax losses on a
subsequent sale of shares.
CLIX’s short positions are not intended to hedge the portfolio in market downturns, but rather to allow stocks with unfavorable
outlooks to contribute to performance. Short positions lose value as security prices increase. CLIX’s and ONLN’s investments in the
consumer discretionary and retailing industries are subject to risks such as changes in domestic and international economies,
interest rates, competition and consumer confidence; disposable household income; consumer tastes and preferences; intense
competition; changing demographics; marketing and public perception; and dependence on third-party suppliers and distribution
systems.
43Important Disclosures
Carefully consider the investment objectives, risks, charges and expenses of ProShares before
investing. This and other information can be found in their summary and full prospectuses. Read
them carefully before investing. Obtain them from your financial advisor or broker-dealer
representative or visit ProShares.com.
The "FactSet Pet Care Index" and "FactSet" are trademarks of FactSet Research Systems Inc. The "Dow
Jones Brookfield Global Infrastructure Composite" Index is a product of S&P Dow Jones Indices LLC and its
affiliates. "S&P®" is a registered trademark of Standard & Poor's Financial Services LLC ("S&P") and "Dow
Jones®" is a registered trademark of Dow Jones Trademark Holdings LLC ("Dow Jones") and have been
licensed for use by S&P Dow Jones Indices LLC and its affiliates. Solactive AG serves as index calculation
agent for the ProShares Online Retail Index and performs routine daily calculations and maintenance (e.g.,
reconstitution, rebalancing, and corporate actions). "Solactive AG," is a registered trademark of Solactive
AG. All have been licensed for use by ProShares. ProShares have not been passed on by these entities or
their affiliates as to their legality or suitability. ProShares based on these indexes are not sponsored,
endorsed, sold, or promoted by these entities and their affiliates, and they make no representation regarding
the advisability of investing in ProShares. THESE ENTITIES AND THEIR AFFILIATES MAKE NO
WARRANTIES AND BEAR NO LIABILITY WITH RESPECT TO PROSHARES. FactSet Research Systems
Inc. does not guarantee the accuracy and/or the completeness of the FactSet Pet Care Index or any data
included therein, and FactSet Research Systems Inc. shall have no liability for any errors, omissions, or
interruptions therein. Solactive AG and its affiliates make no warranties, express or implied, and bear no
liability with respect to the ProShares Online Retail Index, ProShares, or the ProShares Pet Care ETF.
ProShares are distributed by SEI Investments Distribution Co., which is not affiliated with the funds' advisor or sponsor.
ProShares is not affiliated with Interactive Brokers LLC, or any other FINRA broker-dealer.
44How to Contact ProShares
ProShares
ProShares.com
866.PRO.5125
info@ProShares.com
45Thank You
46You can also read