How Tight is the Labor Market? - Katharine G. Abraham and John C. Haltiwanger University of Maryland - Federal Reserve Bank of ...
←
→
Page content transcription
If your browser does not render page correctly, please read the page content below
How Tight is the Labor
 Market?
 Katharine G. Abraham and John C. Haltiwanger
 University of Maryland
Challenging to assess slack in the labor market
…with the unemployment rate well below estimates of its longer-term normal
level, why isn’t the FOMC tightening monetary policy more sharply to head
off overheating and inflation?
…while the unemployment rate is below the Committee’s estimate of the
longer-run natural rate, estimates of this rate are quite uncertain.
Federal Reserve Chair Jerome Powell, August 2018, Jackson Hole

… factors determining maximum employment “may change over time and
may not be directly measurable,” and… assessments of the level of maximum
employment “are necessarily uncertain and subject to revision.
…(I)n its 2012 statement,… the FOMC explicitly recognized that our
assessments of the degree of slack must be based on a wide range of variables
and will require difficult judgments about the cyclical and structural
influences in the labor market.
Federal Reserve Chair Janet Yellen, August 2014, Jackson Hole
Overview
• Labor market tightness commonly discussed in terms of U-U*
 ‒ Gap measures at core of New Keynesian models
 ‒ Framing grew out of focus on Phillips Curve
• Modern macro labor models (e.g., Diamond-Mortensen-Pissarides
 (DMP)) use flow approach with focus on labor market tightness
 ‒ In canonical DMP model, labor market tightness measured as θ = V/U
 ‒ Job finding rate (H/U) and job filling rate (H/V) driven by variation in θ
 ‒ Increases in θ create upward pressure on wages (and in turn on prices)
• Defining and measuring labor market tightness the central theme of
 our paper
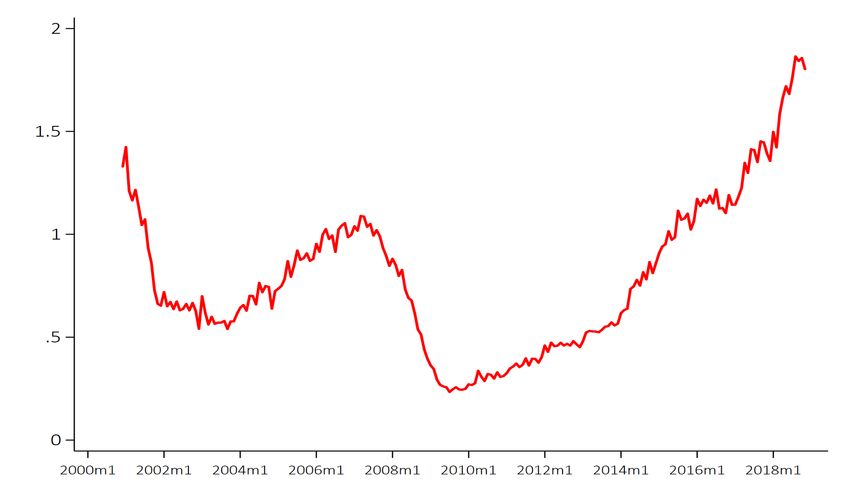
Standard measure of labor market tightness (V/U)
higher than any time in past 20 years…

 Normalized to be equal to one (on average) in 2007
… but little sign of accelerating wages or prices

Source: BLS
Many potential explanations for disconnect
between V/U and wage/price inflation
• Inflation expectations better anchored than in past (Ball and
 Mazumder 2014, Blanchard 2016)
• Globalization has flattened the Phillips curve (Bean 2006; Auer, Borio
 and Filardo 2017; Jasova, Moessner and Takats 2018)
• Workers have less bargaining power than in past (Krueger 2018)
• Labor market tightness has been mis-measured
 ‒ Focus of this paper
Standard model of labor market tightness
• Matching function = , = 1−
 ‒ H is hires, V is job openings, U is unemployment

• In this framework, θ = measures labor market tightness

• Job finding rate (job filling rate) related directly (inversely) to θ
 1−
 ‒ Job finding rate: / = ( ) = (θ )1−

 1− 1
 ‒ Job filling rate: / = ( ) = ( )
 θ
What is missing from standard model of labor market
tightness? Unemployed ≠ effective searchers
• Unemployed are heterogeneous
 ‒ Demographics (e.g., Perry 1970, Shimer 2001, Barnichon and Mesters 2018)
 ‒ History (e.g., Fujita and Moscarini 2017, Kudlyak and Lange 2019)
 ‒ Duration (e.g., Kaitz 1970, Krueger, Cramer and Cho 2014)
• Many job searchers out of labor force (e.g., Flinn and Heckman 1983,
 Jones and Riddell 1999, Hornstein, Kudlyak and Lange 2014)
• Many job searchers already employed (e.g., Faberman et al 2016, Hall and
 Schulhofer-Wohl 2018, Haltiwanger, Hyatt and McEntarfer 2018,
 Haltiwanger, Hyatt, Kahn and McEntarfer 2018)
• Job search intensity may vary with labor market conditions
 ‒ Studies using direct measures find conflicting results (e.g., Shimer 2004, Deloach and
 Kurt 2013, Gomme and Lkagvasuren 2015, Mukoyama, Patterson and Sahin 2018)
 ‒ Nascent literature makes inferences from relative job finding rates (e.g., Varacierto
 2011, Hornstein and Kudlyak 2016, Sedlacek 2016, Hall and Schulhofer-Wohl 2018)
What is missing from standard model of labor market
tightness? Vacancies ≠effective vacancies

• Employer recruiting intensity may vary with labor market conditions
 ‒ Reports of changes in employer recruiting behavior in tighter labor markets
 (e.g., Casselman 2018, Smialek 2019)
 ‒ Evidence from job boards on stated job requirements (Modestino, Shoag and
 Balance 2019)
 ‒ Analysis of relationship in microdata between job filling rate by
 establishments and hires (Davis, Faberman and Haltiwanger 2013)

 ≠
Generalized labor market tightness
• Our objective: Use estimates in the literature to construct a
 generalized measure of labor market tightness
 ‒ Want a measure of Effective Vacancies/Effective Job Searchers
 ‒ Requires adjustments to both numerator and denominator
• Compare and contrast with standard V/U measure (and other
 measures), explore sources of differences
Generalized labor market tightness (cont’d)
Challenge: How to measure search and recruiting intensities?

• Build on Hall and Schulhofer-Wohl (2018) (hereafter HSW) to construct
 effective searchers. In simplified form (actual implementation uses 16
 groups rather than 3 groups):
 = + +
 where is search intensity for job search group i in period t
• Use measures of recruiting intensity based on Davis, Faberman and
 Haltiwanger (2013) (hereafter DFH) to construct effective vacancies:
 =
 where is recruiting intensity in period t
Preview: Generalized measure(s) of tightness imply
substantially less tightness than standard measure

 Generalized measure
 reduces RMSE for difference
 between predicted and
 actual job filling rates

Both series normalized to be equal to one (on average) in 2007
Building on HSW for effective searchers
• Hall and Schulhofer-Wohl (2018) define 16 distinct labor market groups
 ‒ Thirteen groups among the unemployed (duration by reason for those unemployed
 less than 4 weeks or 4-26 weeks; unemployed 27 plus weeks not further
 disaggregated
 • Reasons are job leaver, permanent layoff, temporary layoff, temporary job ended, entrant, re-
 entrant
 ‒ Two OLF groups (want a job, do not want a job)
 ‒ Employed the 16th group
• Use CPS microdata to estimate job finding rates for members of each group
 ‒ For further analysis, use adjusted estimates of that control for demographic
 structure (but demographics explain little of group-specific variation)
 ‒ Variation in relative job finding rates most naturally interpreted as variation in
 relative search intensity
Building on HSW for effective searchers (cont’d)
• Model group-specific job-finding rates allowing for base period
 differences, group-specific variation in response to labor market
 tightness (T=V/H) and group-specific trends

 log = log + � log +

 log = log + �

 ‒ Estimated over different horizons; we use short-span (3-month) estimates
 ‒ � = + . We construct estimate of as population-weighted average
 (using 2007 population weights) and use only i in calculation of relative
 search intensities
 ‒ Similar approach for ̃ = + (and for additional post 2008 trend).
Building on HSW for effective searchers (cont’d)

• HSW estimates allow us to construct = ,
 which gives us
 information needed to construct three versions of the effective
 searcher series
 ‒ First version uses only the , base period job finding rates (defined relative to
 rate for unemployed who were recently laid off)

 ‒ Second version incorporates
 ‒ Third version additionally incorporates (and post-2008 trend)
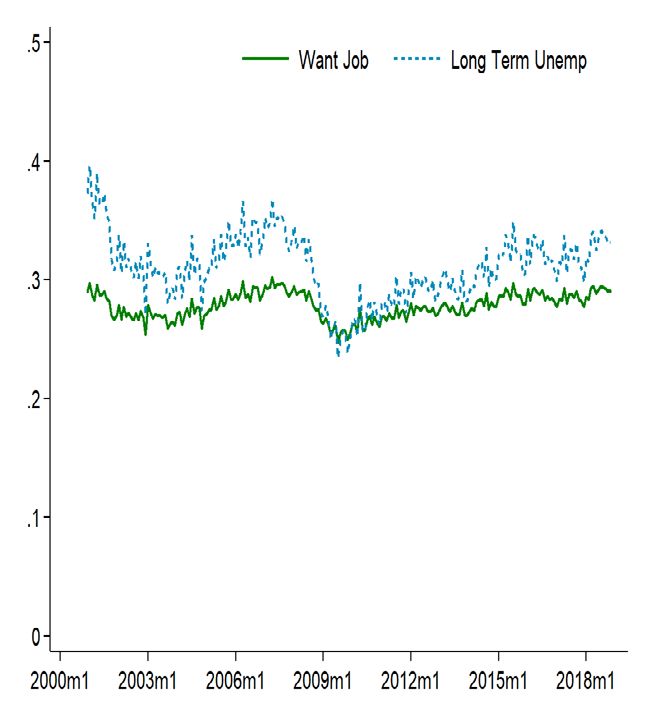
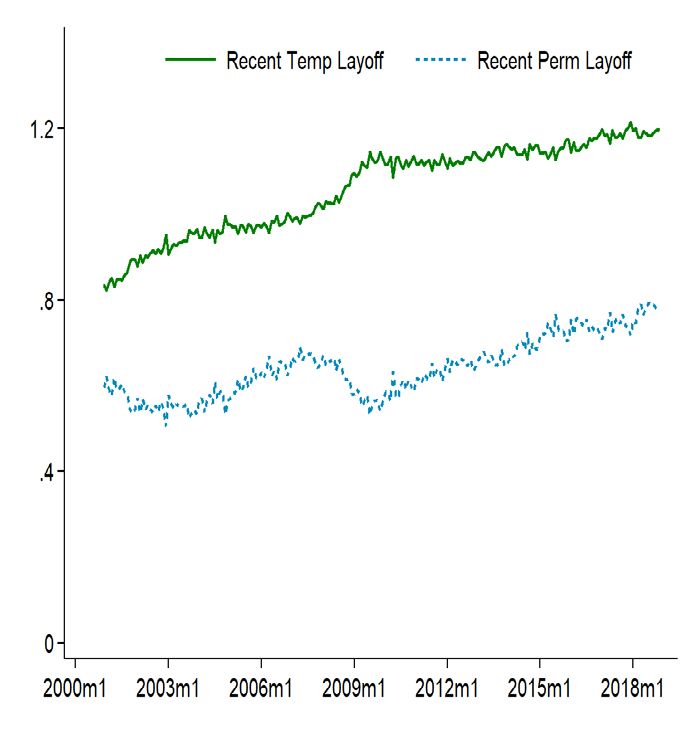
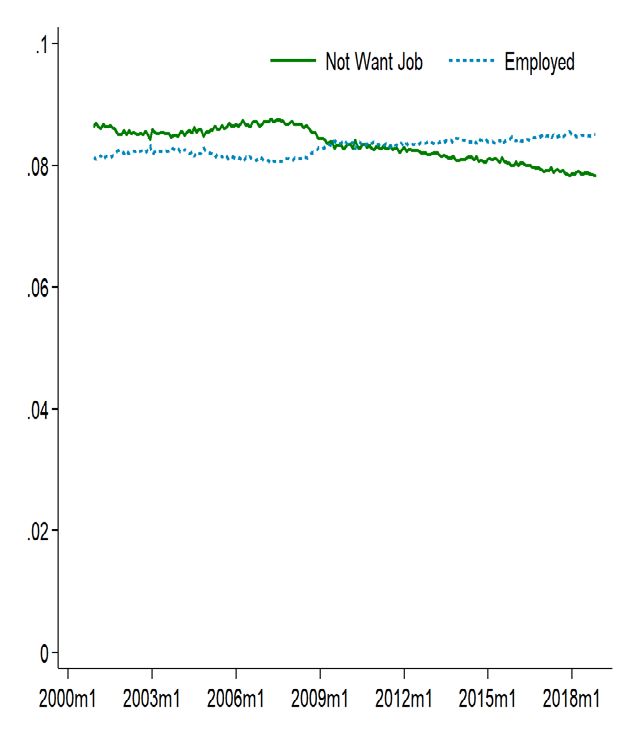
Selected search intensities

 Weight (search intensity) for some groups rising over time, while weight for others falling due to group specific trends.

 These trends abstract from common trends that influence common job finding rate for effective searchers.
Shares of effective searchers
Recruiting intensity (DFH 2013, updated)

 Uses micro data
 on relationship
 between job filling
 rate by establishments
 and hires to construct
 measure
Effective searchers versus standard searchers

All series are relative to 16+ population
Other expanded measures of available labor/searchers

• Index based on Bureau of Labor Statistics U6 measure
 ‒ U6 alternative measure of labor underutilization that adds marginally
 attached and part-time for economic reasons to unemployed in both
 numerator and denominator of the unemployment rate
 ‒ U6 index is sum of unemployed, marginally attached and part-time for
 economic reasons as a share of the population age 16 and older
• Richmond Fed Non-Employment Index (Kudlyak 2017)
 ‒ Based on disaggregation of non-employed into nine mutually exclusive groups
 • Groups are: 1) short term unemployed (
Comparison to U6 and Richmond Fed Non-Employment Indexes
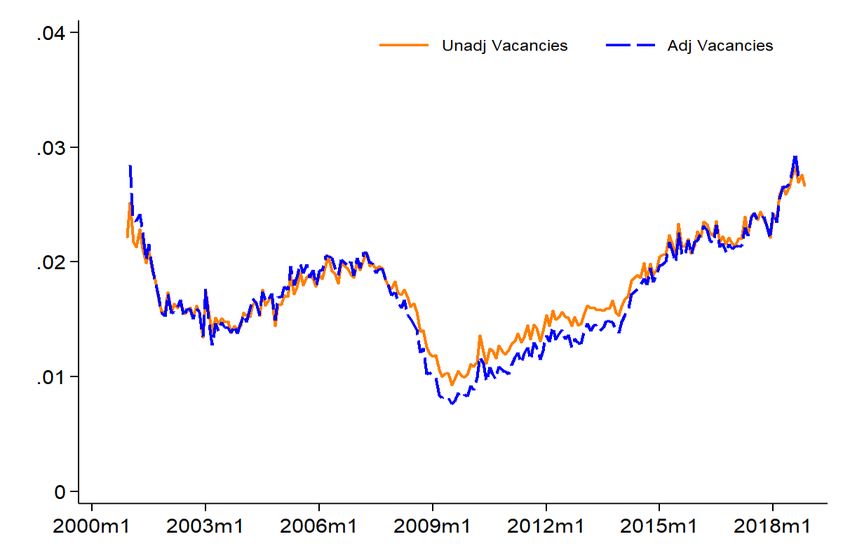
Effective vacancies vs. standard vacancies

Both series normalized by 16+ population
Putting the pieces together: Generalized measure(s) of tightness
imply substantially less tightness than standard measure
Evaluation
• Matching function given by:
 = , = 1−
• The (common) matching
 1
 function elasticity derived from HSW estimates
 (can show = )
 1+
• Evaluate through lens of hires per vacancy:

 ‒ Standard model: / = ( )

 1−
 ‒ Generalized Model: / = ( ) = ( ) ( )

• Compare actual hires per vacancy (LHS) to predicted for standard and
 generalized model
 ‒ Effective searchers don’t rise as much in recessions as standard searchers.
 ‒ Recruiting intensity declines in recessions
 ‒ Both work to dampen cyclicality of job filling rate
Generalized measures better predict job filling rate

 Generalized model tracks H/V
 much more closely.

 RMSE for generalized models
 less than 25% of standard model

 Estimated ≈ 0.7 based on
 estimate of η.

 If we use ≈ 0.5 for standard
 model, RMSE of standard
 model is reduced, but still more
 than twice that of generalized
 model.

Uses fully generalized measure with trend. Series normalized to one in 2007.
Using U6 yields no
 improvement over
 standard measure in
 predicting job filling
 rate

Series normalized to one in 2007.
Richmond Fed
 Index improves
 performance
 of matching
 function quite a
 bit, but not nearly
 so much as
 generalized
 measure

Series normalized to one in 2007.
Eliminating employed and out of the labor force yields
greater cyclicality in effective searchers
Eliminating
 employed from
 effective searchers
 yields poorer
 performance in
 predicting job filling
 rate

 RMSE is about 40%
 of standard

Series normalized to one in 2007.
Eliminating employed
 and out of the labor
 force from effective
 searchers yields
 substantially
 poorer performance

 RMSE is about 70%
 of standard

Series normalized to one in 2007.
Taking stock
• Generalized measure of labor market tightness implies labor market is
 not currently as tight as suggested by standard V/U measure
• V/U much more cyclical than EV/ES!
• Generalized measure improves fit of hiring function substantially
 ‒ Accounting for changes in the composition of the unemployed helps
 ‒ Accounting for search among the employed and those out of the labor force
 even more important
 ‒ Do somewhat better if allow for variation in search intensities over time
 ‒ Variations in employer recruiting intensity also play a role
Next steps
• HSW estimates provide proof of concept for effective searchers, DFH for
 effective vacancies; undoubtedly can be improved upon
 ‒ Return to micro data to explore best effective searcher groupings
 • Revisit role of demographics
 • Break out those out of the labor force by reason? Distinguish between those who are part-
 time for economic reasons and other employed?
 ‒ Reconcile direct and indirect evidence on cyclical variation in group-specific search
 intensities
 ‒ Seek more direct evidence on employer recruiting intensity
• Practical immediate step: Begin real-time construction of a generalized
 labor market tightness measure based on assumption of constant relative
 job finding rates
 ‒ Straightforward and even proof-of-concept measure we have presented significantly
 outperforms other measures
Next steps (continued)
• Explore performance of alternative measures of labor market
 tightness in explaining wages and prices.
 ‒ If labor markets not as tight as implied by standard measure, easier to
 reconcile lack of wage and price pressure from the labor market
 ‒ Have left this ambitious task for future research
Thank you!
You can also read