HOWARD COUNTY PUBLIC SCHOOL SYSTEM - ATTENDANCE AREA COMMITTEE MEETING #3 JULY 2, 2019 - hcpss
←
→
Page content transcription
If your browser does not render page correctly, please read the page content below

HOWARD COUNTY PUBLIC SCHOOL
                                                SYSTEM

                                     ATTENDANCE AREA COMMITTEE MEETING #3

                                                  JULY 2, 2019

HOWARD COUNTY PUBLIC SCHOOL SYSTEM
AGENDA

  •    Approval of 6/25/19 Meeting Minutes
  •    Title I
  •    Meeting 2 Review
  •    Feasibility Study Review
  •    Next Meeting
  •    Adjourn

HOWARD COUNTY PUBLIC SCHOOL SYSTEM            1

COMMITTEE DELIVERABLE
• Objective Feedback on the Feasibility Study Relative to Policy
• Discussion and consensus around policy parameters
• Example:
Prioritize parameter X over parameter Y.
• Majority Opinion
• Minority Opinion
Minimize changes when not adding capacity
• Majority Opinion
• Minority Opinion
Guidance
• Tonight’s Focus – Discussion around high level concepts.
• Next Meeting Focus – Applying discussion topics to the feasibility study.
HOWARD COUNTY PUBLIC SCHOOL SYSTEM 2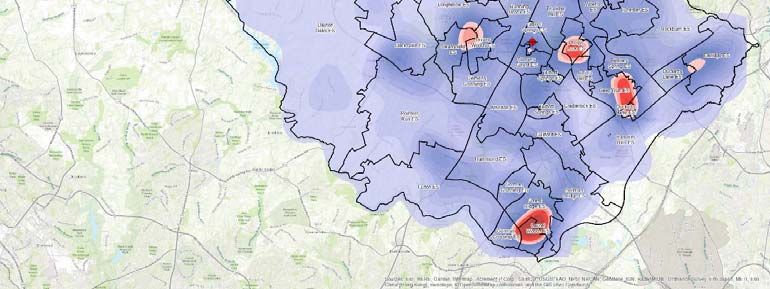
MEETINGS 1&2 REVIEW

HOWARD COUNTY PUBLIC SCHOOL SYSTEM
ROLES & RESPONSIBILITIES

   Attendance Area Committee (AAC)
   •   AAC reviews options presented in the Feasibility Study and Policy 6010
   •   AAC provides feedback to the Superintendent to help inform his proposal
   •   AAC members represent community diversity and every planning region in the county, and include
       individuals who have served HCPSS in advisory roles or partners.
   •   AAC is not responsible for gathering public input or developing attendance area plans.

   Community Members
   •   This is a working meeting and we will not be taking ANY public input at this time.
   •   Community members are allowed to attend, we ask that you are courteous and allow the committee to
       proceed with their work.
   •   The superintendent is collecting feedback through surveys and community meetings:
         • Feasibility Study Survey
         • Alternative Boundary Scenarios Survey

HOWARD COUNTY PUBLIC SCHOOL SYSTEM                                                                         4
SCOPE
  In Scope
  •    Review and audit the Feasibility Study
  •    Provide feedback to the Superintendent
  •    Feedback should be based on your understanding of the policy and how the feasibility study meets those goals.
  •    Have a county‐wide perspective and consider the needs of ALL students

  Out of Scope
  •    This committee is NOT charged with the creation of any boundary plans
  •    Receiving public input, this all goes through the superintendent
  •    Attend or accept invitations to additional meetings on behalf of the committee

  How is the feedback of this committee different than that of the community as a whole?
  • This group is a diverse, independent body, focused on a county‐wide perspective
  • The value that this group adds is the diverse discussion and consensus building

HOWARD COUNTY PUBLIC SCHOOL SYSTEM                                                                                     5
SCHEDULE

                                                  June   July    August   September   October   November
Feasibility Study Process
Feasibility Study Survey
AAC Meetings
Public Input Meetings
Superintentent Process
Superintentent Presents Recommendation to Board
School Board Process
Board Public Hearings
Board Public Work Sessions
Board Decision on any boundary adjustments

   AAC Meeting Schedule – Tuesday for the next 4 weeks
   •      Tuesday, June 18, 6 p.m. – Atholton HS
   •      Tuesday, June 25, 6 p.m. – Atholton HS
   •      Tuesday, July 2, 6 p.m. – Atholton HS
   •      Tuesday, July 9, 6 p.m. – Atholton HS

   Community Input Sessions – Asking Community members to register ahead of time, and attend
   only one of the meetings.
   •      July 10 Wednesday Oakland Mills HS 6:00 PM ‐ 9:30 PM
   •      July 13 Saturday Long Reach HS 8:00 AM ‐ 11:30 AM
   •      July 16 Tuesday Wilde Lake HS 6:00 PM ‐ 9:30 PM
   •      July 18 Thursday River Hill HS 6:00 PM ‐ 9:30 PM

HOWARD COUNTY PUBLIC SCHOOL SYSTEM                                                                         6
POLICY 6010

  •    Link to policy ‐ https://www.hcpss.org/policies/6000/6010‐school‐attendance‐areas/

  •    The AAC will consider the impact of the following factors in the review or development of any school
       attendance area adjustment plan.

        1) Facility Utilization
            a. Efficient use of available space. For example, maintain a building’s program capacity utilization
                between 90% and 100%.
            b. Long‐range enrollment, capital plans and capacity needs of school infrastructures (e.g., cafeterias,
                restrooms and other shared core facilities).
            c. Fiscal responsibility by minimizing capital and operating costs.
            d. The number of students that walk or receive bus service and the distance and time bused students
                travel.
            e. Location of regional programs, maintaining an equitable distribution of programs across the county.
        2) Community Stability
            a. Feeds that encourage keeping students together from one school to the next. For example, avoiding
                feeds of less than 15% at the receiving school.
            b. Areas that are made up of contiguous communities or neighborhoods.
            c. Frequency with which any one student is reassigned, making every attempt to not move a student
                more than once at any school level or the same student more frequently than once every five years.

HOWARD COUNTY PUBLIC SCHOOL SYSTEM                                                                                    7
POLICY 6010

        3) Demographic Characteristics of Student Population
            a. The racial/ethnic composition of the student population.
            b. The socioeconomic composition of the school population as measured by participation in the federal
               FARMS program.
            c. Academic performance of students in both the sending and receiving schools as measured by current
               standardized testing results.
            d. The level of English learners as measured by enrollment in the English for Speakers of Other
               Languages (ESOL) program.
            e. Number of students moved, taking into account the correlation between the number of students
               moved, the outcomes of other standards achieved in Section IV.B. and the length of time those results
               are expected to be maintained.
            f. Other reliable demographic and diversity indicators, where feasible.

HOWARD COUNTY PUBLIC SCHOOL SYSTEM                                                                                     8
FEASIBILITY STUDY
• Presentation to the board – June 13th
Resources
• Feasibility Study Board Presentation Video ‐ https://hcpsstv.new.swagit.com/videos/29198
• Feasibility Study Board Presentation ‐
https://go.boarddocs.com/mabe/hcpssmd/Board.nsf/files/BD4KBR4F5CF3/$file/06%2013%202019%20Presentation%20of%20Feasabilit
y%20Study%20PowerPoint.pdf
• School Locator‐ https://hcpss‐gis.maps.arcgis.com/apps/webappviewer/index.html?id=06528401636a4a48b1ef681c66a61a07
• Polygon PDF Map (More Detail) ‐ https://www.hcpss.org/f/schoolplanning/planning‐polygon‐map‐1617.pdf
• Policy 6010 ‐ https://www.hcpss.org/policies/6000/6010‐school‐attendance‐areas/
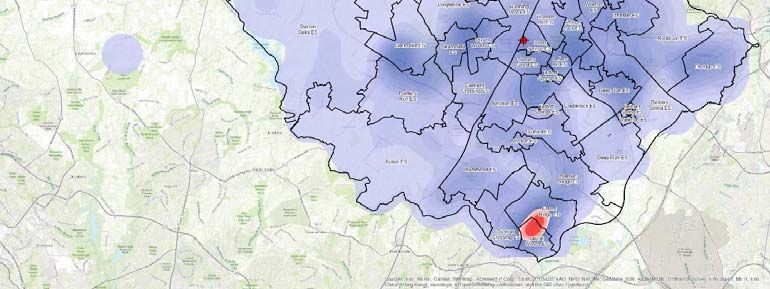
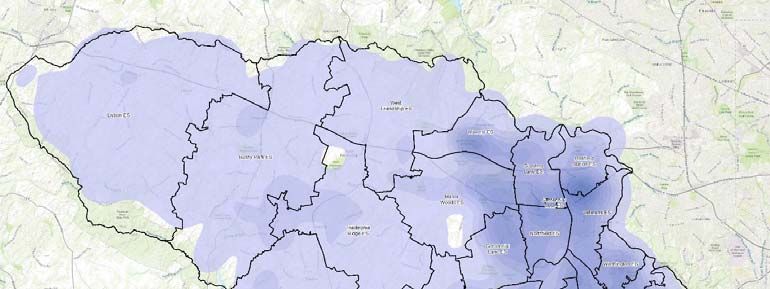
HOWARD COUNTY PUBLIC SCHOOL SYSTEM 9Student Density 2018‐19 School Year 2008‐09 School Year 2018‐19 School Year HOWARD COUNTY PUBLIC SCHOOL SYSTEM
P R I VAT E S C H O O L S T U D E N T S
% of Age Group Enrolled in School
• Based on American Factfinder Data: US Census 3‐4
2009
62.2%
2010
59.6%
2011
57.1%
2012
57.9%
2013
58.5%
2014
57.8%
2015
58.7%
2016
60.6%
2017
61.6%
Bureau 5‐9 96.7% 97.1% 97.1% 97.1% 96.7% 96.9% 96.5% 96.9% 96.9%
• Howard County Public School market share is 10‐14
15‐17
98.7%
98.1%
98.6%
97.8%
98.1%
98.4%
98.0%
97.6%
98.4%
98.3%
98.2%
98.4%
98.5%
98.5%
98.8%
98.4%
98.6%
99.2%
increasing relative to the private school market 18‐19 83.3% 82.7% 85.5% 85.0% 85.4% 83.0% 85.2% 84.5% 82.7%
Source: U.S. Census Am erican Com m unity Survey 5‐Year Estim ates 2005‐2009, 2006‐2010, 2007‐2011, 2008‐2012, 2009‐2013, 2010‐
share. 2014, 2011‐2015, 2012‐2016, 2013‐2017
% of Age Group Enrolled in Public School
2009 2010 2011 2012 2013 2014 2015 2016 2017
3‐4 30.1% 28.3% 26.7% 29.2% 31.2% 33.4% 34.9% 34.5% 33.0%
5‐9 79.9% 82.3% 82.3% 83.3% 85.0% 85.8% 87.3% 87.4% 87.3%
10‐14 88.5% 89.9% 89.3% 89.7% 89.6% 90.2% 90.0% 89.5% 89.1%
15‐17 87.7% 88.0% 88.8% 88.2% 87.1% 88.3% 88.3% 89.1% 89.1%
18‐19 83.8% 83.4% 81.2% 83.6% 84.5% 85.3% 86.6% 89.4% 88.1%
Source: U.S. Census Am erican Com m unity Survey 5‐Year Estim ates 2005‐2009, 2006‐2010, 2007‐2011, 2008‐2012, 2009‐2013, 2010‐
2014, 2011‐2015, 2012‐2016, 2013‐2017
% of Age Group Enrolled in Private School
2009 2010 2011 2012 2013 2014 2015 2016 2017
3‐4 69.9% 71.7% 73.3% 70.8% 68.8% 66.6% 65.1% 65.5% 67.0%
5‐9 20.1% 17.7% 17.7% 16.7% 15.0% 14.2% 12.7% 12.6% 12.7%
10‐14 11.5% 10.1% 10.7% 10.3% 10.4% 9.8% 10.0% 10.5% 10.9%
15‐17 12.3% 12.0% 11.2% 11.8% 12.9% 11.7% 11.7% 10.9% 10.9%
18‐19 16.2% 16.6% 18.8% 16.4% 15.5% 14.7% 13.4% 10.6% 11.9%
Source: U.S. Census Am erican Com m unity Survey 5‐Year Estim ates 2005‐2009, 2006‐2010, 2007‐2011, 2008‐2012, 2009‐2013, 2010‐
2014, 2011‐2015, 2012‐2016, 2013‐2017
HOWARD COUNTY PUBLIC SCHOOL SYSTEM 11DISCUSSION QUESTIONS HOWARD COUNTY PUBLIC SCHOOL SYSTEM
DISCUSSION QUESTIONS
  •    How do you feel about “island” boundaries vs. complex “domino” moves?

  •    Should boundary changes be less frequent and more extensive or more frequent and less
       extensive?

  •    Should students be rezoned to permanent space or remain in the current school knowing they
       will be in a relocatable?

HOWARD COUNTY PUBLIC SCHOOL SYSTEM                                                                  13
DISCUSSION QUESTIONS
How do you feel about “island” boundaries vs. complex “domino” moves?
Considerations:
• “Island” boundaries generally impact fewer students than “domino” moves.
• “Domino” changes generally impact more students but result in contiguous boundaries that are typically more
efficient for transportation.
• Some of the existing boundaries including islands are smaller geographically than some of our larger
contiguous boundary schools.
• Some “islands” result in small percentage feeds.
Island Move Domino Move
100 100 100
School A School B School C School A School B School C
HOWARD COUNTY PUBLIC SCHOOL SYSTEM 14DISCUSSION QUESTIONS
Should boundary changes be less frequent and more extensive or more frequent and less
extensive?
• How long should a boundary change keep its effected facilities within desired utilization parameters?
Considerations:
• Typically, the more extensive changes (more students impacted) are, the longer changes will keep utilizations
within parameters.
• When considering impact on demographic factors, there is a “law of diminishing returns” relative to the extent
of the change.
Demographics shift over time independent of boundaries.
HOWARD COUNTY PUBLIC SCHOOL SYSTEM 15DISCUSSION QUESTIONS
Should students be rezoned to permanent space or remain in the current school knowing they will
be in a relocatable?
• Should additional relocatables be purchased when there is permanent capacity accessible via boundary
changes.
Considerations:
• The district has 224 classrooms in relocatable buildings (2018‐19).
• Depending on site needs the cost to add a relocatable is around $150,000.
• As more relocatable classrooms are added to a campus, more pressure is added to the core spaces.
HOWARD COUNTY PUBLIC SCHOOL SYSTEM 16TITLE I PRESENTATION HOWARD COUNTY PUBLIC SCHOOL SYSTEM
Title I of ESSA

                                           Amy Tieperman,
                                           Program Manager, Title I

                                           Julie Knauer,
                                           Specialist, Title I

HOWARD COUNTY PUBLIC SCHOOL SYSTEM
Title I
● Title I is the largest federal compensatory education
program
● Title I is part of the Elementary and Secondary Education Act
of 1965 (ESEA) ‐ as amended as the Every Student Succeeds
Act (ESSA), “Improving Basic Programs Operated by State
and Local Education Agencies”
● Nationally, over $15 billion is appropriated annually
● HCPSS is allocated around $5 million
HOWARD COUNTY PUBLIC SCHOOL SYSTEMPurpose of Title I
● Title I, Part A funds are formula funds allocated in order to:
○ Ensure all children have fair, equal, and significant opportunity to
obtain a high‐quality education;
○ provide supplemental educational opportunities for children
living in high poverty areas and most at risk of failing to meet the
state’s standards; and
○ provide school‐based programs and services to address
identified student needs.
HOWARD COUNTY PUBLIC SCHOOL SYSTEMTitle I Funds Must Be
● Supplemental to existing funds available to participating
students
● Awarded to the highest-poverty schools
● Designed to meet the educational needs of the most at-risk
students
● Expended in support of school-level activities designed to
meet the needs of students as part of the school planning
process
HOWARD COUNTY PUBLIC SCHOOL SYSTEMTitle I Funds and Selecting Schools
Federal Allocations State‐level Distribution District Selection
District In Maryland, Schools are eligible
appropriations districts use based on the
are calculated FARMS data to school’s
federally and determine percentage of
are based on US poverty poverty compared
Census data percentages to other schools in
the district
HOWARD COUNTY PUBLIC SCHOOL SYSTEMSchool Ranking
Districts must rank the schools by poverty percentages in order to:
● Identify schools eligible for Title I funding ‐ schools at or above the
comparison average are eligible for Title I services.
● Allocate funds to each school
Options are available:
Districtwide Grade Span
Ranking Grouping
HOWARD COUNTY PUBLIC SCHOOL SYSTEMHCPSS Title I
● Using the grade span option, HCPSS currently serves 13 elementary
schools.
Bollman Bridge Guilford Running Brook
Bryant Woods LaurelWoods Stevens Forest
Cradlerock Longfellow Swansfield
Deep Run Phelps Luck Talbott Springs
Ducketts Lane
● There are two types of programs Schoolwide and Targeted Assistance
Schools.
● During SY19‐20, all 13 schools will operate as Schoolwide Schools.
HOWARD COUNTY PUBLIC SCHOOL SYSTEMTAS vs. SW
● The Targeted Assistance School (TAS) program allows Title I teachers to
provide services to a select group of children. Title I funds may only be used
to provide services to children who are identified as having the greatest need
for educational assistance.
● The Schoolwide (SW) program allows all students to be eligible for additional
academic support. Federal funds are used to support and enhance the
overall school program. Title I funds may be used to upgrade the entire
school’s educational program so that the overall education of ALL children
who attend the school can be improved. Currently, all Title I schools in
Howard County operate as Schoolwide programs. Schools must be at least
40% FARMs to qualify for Schoolwide.
HOWARD COUNTY PUBLIC SCHOOL SYSTEMQuestions HOWARD COUNTY PUBLIC SCHOOL SYSTEM
CONSENSUS BUILDING

HOWARD COUNTY PUBLIC SCHOOL SYSTEM
C AT E G O R I E S O F I N P U T

  •    Countywide View (Applies to All scenarios)

  •    Tactical View (Depends on needs, geography, and other factors)

  •    Future Improvement (Consider for future Process)

  •    Concerns that are out of AAC scope (Can be shard with other HCPSS
       staff for consideration)

HOWARD COUNTY PUBLIC SCHOOL SYSTEM                                         28
C AT E G O R I E S O F I N P U T
COUNTYWIDE VIEW
Input Agree Disagree Abstain
Use lens of equity as the driving factor for any boundary adjustment 9 1
Consider the students with the greatest needs. “Because the impact of change may be harder
on students with need.”
Additional Ideas:
• Consider needs over comfort.
• Strive to increase parent involvement
• Insure students are not singled out in moves.
Define first filter: What is the effect on equity that this move will have?
Make more extensive reassignments less frequently (rather than smaller adjustments more 10 0
frequently) if results (target utilization, etc.) can be maintained longer; more productive use of
buildings and less anxiety for parents annually
Keep walkers as walkers whenever possible 10
Temporary use of relocatables is understood to provide immediate (short‐term) need for 10
space, but permanent use of relocatables in place of boundary line adjustments is not
acceptable
HOWARD COUNTY PUBLIC SCHOOL SYSTEM 29C AT E G O R I E S O F I N P U T
TACTICAL VIEW
Input Agree Disagree Abstain
Islands are acceptable, but it depends…: 10
• Consider the following factors:
• Focus on areas that are not walkable to any school.
• Do not create low percentage feeders, consider vertical feeder alignment.
• Ensure that travel times are reasonable, consider express routes for island zones.
• Keep neighborhoods together
Domino moves are acceptable, but it depends: 10
• Consider the following factors:
• Ensure that walkable areas stay walkable.
• Do not create low percentage feeds, consider vertical feeder alignment.
• Due to the higher impact of the change, consider longevity of impacts.
All things being equal, consider Domino over Island 5 4 1
All things being equal, consider Island over Domino 4 4 2
HOWARD COUNTY PUBLIC SCHOOL SYSTEM 30REVIEW OF FEASIBILITY STUDY HOWARD COUNTY PUBLIC SCHOOL SYSTEM
Option: Western ES Option #1
                                      Area: Ellicott City/Turf Valley
                                      No. of Students Moved: 355

                                                                               Appx. # of          Polygons Proposed
                                     Sending              Receiving
                                                                               Students             for Reassignment
                                     St. John's Lane ES   Waverly ES               117                  161, 1161
                                     Waverly ES           Bushy Park ES            134                     304
                                     West Friendship ES   Bushy Park ES            54                      232
                                     West Friendship ES   Waverly ES               50             226, 1226, 2226, 3226
                                     Total                                         355

                                                                        Pre-Measures                 Western Option 1
                                                                 Capacity        2020-21        Capacity        2020-21
                                     School                       2020        Proj   % Util.     2020        Proj    % Util.
                                     Bushy Park ES                 744        597      80.2       725        785      108.3
                                     St Johns Lane ES              612        726     118.6       612        609      99.5
                                     Waverly ES                    788        886     112.4       788        919      116.6
                                     West Friendship ES            414        426     102.9       414        322      77.8

                                                                                            HCPSS - 2019 Feasibility Study
HOWARD COUNTY PUBLIC SCHOOL SYSTEM
                                                                                                                             32
HOMEWORK • Consider July 2 discussion on identified option in the Feasibility Study. • Consider any final thoughts or philosophies. Resources • Feasibility Study Board Presentation Video • Feasibility Study Board Presentation • School Locator • Polygon PDF Map (More Detail) • Policy 6010 HOWARD COUNTY PUBLIC SCHOOL SYSTEM 33
NEXT MEETING
                                     Tuesday, July 9, 6 p.m. – Atholton HS

HOWARD COUNTY PUBLIC SCHOOL SYSTEM
You can also read