HPV Infection Significantly Accelerates Glycogen Metabolism in Cervical Cells with Large Nuclei: Raman Microscopic Study with Subcellular ...
←
→
Page content transcription
If your browser does not render page correctly, please read the page content below
International Journal of
            Molecular Sciences

Article
HPV Infection Significantly Accelerates Glycogen
Metabolism in Cervical Cells with Large Nuclei:
Raman Microscopic Study with
Subcellular Resolution
Katarzyna Sitarz 1,2 , Krzysztof Czamara 3 , Joanna Bialecka 4 , Malgorzata Klimek 5 ,
Barbara Zawilinska 1 , Slawa Szostek 1, * and Agnieszka Kaczor 2,3, *
 1    Department of Virology, Chair of Microbiology, Faculty of Medicine, Jagiellonian University Medical
      College, 18 Czysta Street, 31-121 Krakow, Poland; katarzyna.sitarz@doctoral.uj.edu.pl (K.S.);
      barbara.zawilinska@uj.edu.pl (B.Z.)
 2    Faculty of Chemistry, Jagiellonian University, 2 Gronostajowa Street, 30-387 Krakow, Poland
 3    Jagiellonian Centre for Experimental Therapeutics (JCET), Jagiellonian University, 14 Bobrzynskiego Street,
      30-348 Krakow, Poland; krzysztof.czamara@uj.edu.pl
 4    Centre of Microbiological Research and Autovaccines, 17 Slawkowska Street, 31-016 Krakow, Poland;
      joanna.bialecka@gmail.com
 5    National Research Institute of Oncology, Krakow Branch, Clinic of Radiotherapy, 11 Garncarska Street,
      31-115 Krakow, Poland; malgorzata.klimek@onkologia.krakow.pl
 *    Correspondence: slawa.szostek@uj.edu.pl (S.S.); agnieszka.kaczor@uj.edu.pl (A.K.)

 Received: 20 March 2020; Accepted: 8 April 2020; Published: 11 April 2020

 Abstract: Using Raman microscopy, we investigated epithelial cervical cells collected from 96 women
 with squamous cell carcinoma (SCC) or belonging to groups I, IIa, IIID-1 and IIID-2 according to Munich
 III classification (IIID-1 and IIID-2 corresponding to Bethesda LSIL and HSIL groups, respectively).
 All women were tested for human papillomavirus (HPV) infection using PCR. Subcellular resolution
 of Raman microscopy enabled to understand phenotypic differences in a heterogeneous population
 of cervical cells in the following groups: I/HPV− , IIa/HPV− , IIa/HPV− , LSIL/HPV− , LSIL/HPV+ ,
 HSIL/HPV− , HSIL/HPV+ and cancer cells (SCC/HPV+ ). We showed for the first time that the glycogen
 content in the cytoplasm decreased with the nucleus size of cervical cells in all studied groups
 apart from the cancer group. For the subpopulation of large-nucleus cells HPV infection resulted
 in considerable glycogen depletion compared to HPV negative cells in IIa, LSIL (for both statistical
 significance, ca. 45%) and HSIL (trend, 37%) groups. We hypothesize that accelerated glycogenolysis
 in large-nucleus cells may be associated with the increased protein metabolism for HPV positive cells.
 Our work underlines unique capabilities of Raman microscopy in single cell studies and demonstrate
 potential of Raman-based methods in HPV diagnostics.

 Keywords: human papillomavirus; glycogen; cervical cancer; cervical dysplasia; Raman microscopy;
 glycogenolysis

1. Introduction
      Cervical cancer, associated with the sexually transmitted human papillomavirus (HPV) was the
fourth most common cancer among women in the world in 2018 [1], although it is the most suitable
cancer for both primary and secondary prevention [2]. This is mainly due to its slow development and
wide access to screening and availability of vaccinations against HPV—the causative agent of almost
all cervical cancers [2]. HPV is an 8000 base pair virus with eight early genes (E1–E8), two late genes
(L1, L2) and long control region (LCR). Early genes code for non-structural proteins that regulate the

Int. J. Mol. Sci. 2020, 21, 2667; doi:10.3390/ijms21082667                             www.mdpi.com/journal/ijms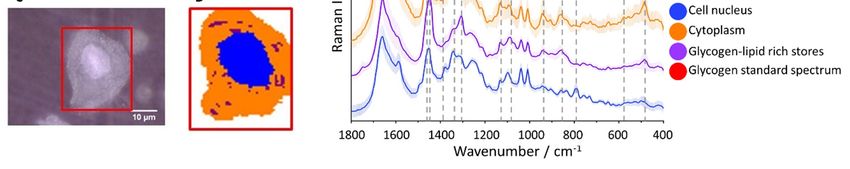
Int. J. Mol. Sci. 2020, 21, 2667                                                                      2 of 15

maintenance and replication of the HPV genome in the infected cell, as well as the transition to the
lytic cycle. The late genes in turn encode capsid proteins, which are also involved in the assembly
of the virion [3]. Integration of the HPV genome in a host cell DNA is an important stage in the
development of cervical neoplastic changes because it enables continuous overexpression of E6 and E7
oncoproteins [3,4]
      Cytological examination, i.e., Pap smear, sometimes combined with an HPV test, is the basic
method of cervical cancer screening [5]. However, a Pap smear is not a modern study—it was
developed in the 1920s and is based solely on microscopic assessment that largely depends on the
experience of a person evaluating the smear [6,7]. Additionally, the Pap test has a probability of a false
positive cervical cancer result (0.8–1.2%) and, in particular, a false negative result that has been recently
estimated to be 27.1% in the case of cervical cancer [8,9].
      Tests for detecting HPV are divided into three groups: nucleic acid hybridization assays, signal
amplification assays and nucleic acid amplification assays [10]. All tests detect DNA or mRNA of
the virus. Tests can detect different types of virus, both low-oncogenic and high-oncogenic, and can
specifically show infection with a specific type of virus or non-specifically indicate infection with one
of the types of the group being detected [10].
      According to the latest data, the HPV test is more effective at detecting cervical neoplasia vs.
the Pap test. In fact, 2.3 and 5.5 of 1000 women developed CIN3 within 48 months of receiving
a negative HPV and Pap test result, respectively [11]. However, the disadvantage of HPV testing is
that the infection finally leads to neoplasia in only a very low percentage of women [12]. In addition,
in some countries such as Poland, HPV infection testing is not a part of the national cervical cancer
screening program [13]. Nevertheless, 99% of cases of cervical cancer coexist with infection of human
papillomavirus [14]. HPV infection also causes most cases of oropharyngeal cancers and anal cancer [13].
Majority (ca. 95%) of cases of cervical cancer are associated with infection with high-risk HPV types,
in particular strains 16 and 18 cause about 70% of cases of cervical cancer [15,16]. Interestingly, a viral
infection can be cured spontaneously, especially for young women, which is why some researchers
postulate not so much for a single detection of infection as for tests that confirm its persistence [17].
      In the case of cervical cancer, the nucleus to cytoplasm ratio is used as a cytological feature to
identify abnormal cells [18]. Interestingly, it does not depend on the amount of chromatin, which is
also confirmed by research on yeast studies [18,19]. The size of the cell nucleus is primarily influenced
by proteins associated with histone remodeling, such as histone acetyltransferase p300, internal nuclear
membrane proteins, such as lamins and laminated proteins, and proteins related to the organization of
the cell cytoskeleton [20–22]. In the first decade of the 21st century, when more and more works began
to show that heterogeneity is a common phenomenon in cell populations, more attention was paid to
this phenomenon in cell cultures [23]. The concept of “single cell analysis” was created in genetic and
proteomic studies [24], but functioning of a cell cannot be fully understood solely based on its genome
and proteome. In biochemical studies of cells, optical methods, particularly fluorescence microscopy,
are becoming more and more popular. However, the use of labels may be associated with cytotoxicity
and sometimes the procedure for its introduction into the cell is difficult and lengthy [25].
      Therefore, other spectroscopic techniques are proposed, including Raman spectroscopy, a label-free,
unbiased technique suited to study cells in their natural environment [26]. This method is based
on the phenomenon of inelastic light scattering and is used to determine the chemical composition
of samples [26]. A Raman spectrum is characteristic for a compound or a group of compounds
enabling their identification in the tested sample. The combination of Raman spectroscopy and
microscopy gives the opportunity to study non-invasively the distribution of chemical compounds
with subcellular spatial resolution [27]. Moreover, with the incorporation of statistical methods,
Raman microscopy becomes a powerful tool to study single cells and changes in them related to
pathology development [28–30]. Some attempts have been made to identify neoplastic lesions using
Raman spectroscopy [31,32]. Research on cervical cancer using Raman and infrared spectroscopy
have been also carried out [33–35]. There has also been an attempt to detect HPV infections using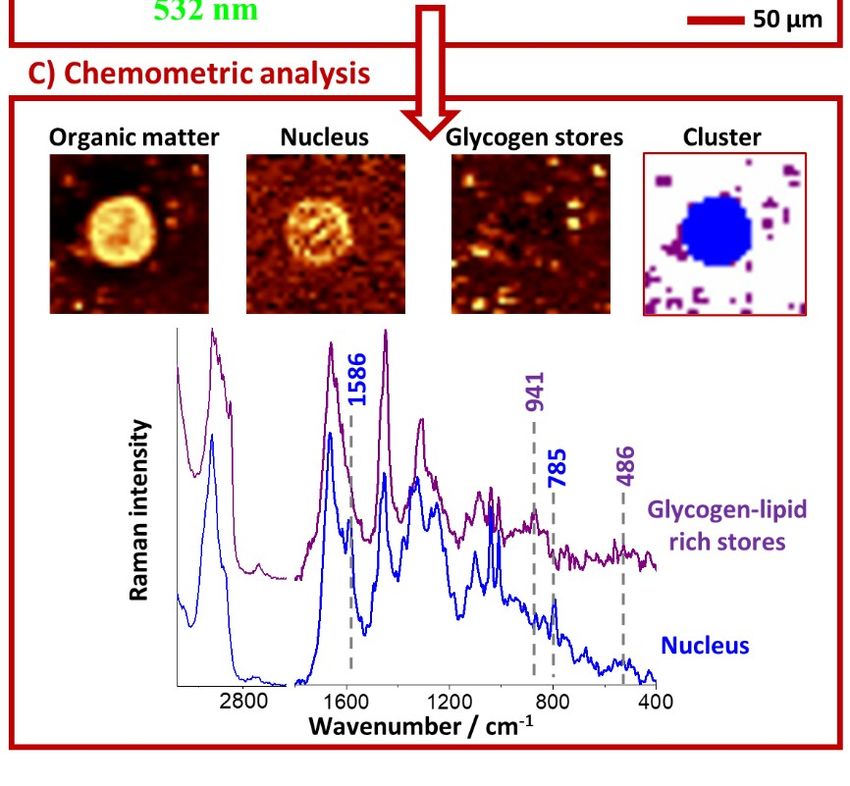
Int. J. Mol. Sci. 2020, 21, 2667                                                                     3 of 15

Raman spectroscopy, where analysis of dry cell pellets was undertaken and global changes in the
Raman signatures of cervical cells due to the presence of HPV infection were described [36]. Studies
on cervical epithelial cells based on Fourier Transform Infrared Spectroscopy (FTIR) suggested that
for dysplastic and neoplastic changes, a characteristic decrease in the intensity of glycogen-specific
bands was observed [37]. Glycogen is one of the compounds accumulated intracellularly in animal
cells in the form of stores with a diameter of 10 to 40 nm [38]. Already in the 1930s, Schiller
determined that cervical cancer cells, unlike healthy cells, lack glycogen [39]. The most commonly
accepted hypothesis explaining this phenomenon is the Warburg effect [40]. It assumes that cancer
cells, often living under conditions with limited oxygen access, derive energy through glycolysis,
not oxidative phosphorylation [40]. Additionally, recently, the Warburg reverse effect have been
discovered, a phenomenon in which cancer-related fibroblasts (CAFs) provide cancer cells with
substrates of the tricarboxylic cycle [41]. According to a recent study [42], this is not a one-sided CAFs
action, but a two-sided interaction of CAFs and cancer cells. Cancer cells produce transforming growth
factor beta 1 (TGF-β1), which by phosphorylation activates p38 mitogen-activated protein kinase
(p38 MAPK kinase) in CAFs, which drives glycolysis in them. CAFs, in response to this stimulation,
produce cytokines and chemokines that drive phosphoglyceromutase in cancer cells, which in turn
leads to glycolysis and metastasis stimulation [42].
       In the case of cervical epithelial cells, glycogen levels vary in different phases of the menstrual
cycle, and after menopause it decreases significantly [43]. Interestingly, this phenomenon only affects
ectocervical cells, while in endocervical cells, changes in glycogen levels during the menstrual cycle
are small, and its level after menopause is not lower than on most days of the cycle in menstruating
women [43]. In turn, in the case of cervical cancer, the level of glycogen decreases in both ecto- and
endocervical cells, compared to the average level in the secretory phase [43].
       Changes of the glycogen content in cancer cells are related to different signal transduction
pathways in these cells [44]. Akt, i.e., protein kinase B is the main transmitter of the phosphoinositide
3-kinase (PI3K) pathway in cells [45]. A complex relationship has been found between Akt activity
and the metabolism of carbohydrates in cancer cells [46]. In addition to Akt, glycolysis can also be
promoted by p38 MAPK and Smad, all of these pathways show increased activity in cervical cancer and
can be activated by TGF-β, which is a factor promoting metastasis [47,48]. Activation of the PI3K/Akt
pathway is also associated with HPV infection. Both of its oncogenic E6 and E7 proteins affect the
activation of Akt in infected cells [49,50].
       It is apparent that changes in the cell metabolism in the course of tumorigenesis affect the chemical
content of various cell components. As HPV induces activation of various signal transduction pathways
related to metabolic activity of cervical cells, in this work, Raman microscopy with subcellular resolution
has been used to study distribution of chemical components in epithelial cervical cells collected from
HPV positive or negative patients. Patients were classified according to the Munich III system [51,52] to I,
IIa, IIID-1 IIID-2 (IIID-1 and IIID-2 corresponding to Bethesda LSIL-low-grade squamous intraepithelial
lesion and HSIL-high-grade squamous intraepithelial lesion groups, respectively) and cancer groups,
in the followed text called I, IIa, LSIL and HSIL as Bethesda nomenclature is commonly used in the
literature. Investigation of Raman data, supported by the chemometric data analysis and periodic
acid-Schiff (PAS) staining, demonstrates that for cervical cells with large (diameter over 10 µm) cell
nuclei, the level of glycogen is significantly decreased in comparison to low-diameter nuclei cells.
Additionally, the glycogen level in both large and small-nucleus cells depends significantly on the
dysplasia advancement and HPV presence showing clearly that metabolism of cervical cells is affected
by HPV infection. This finding has a diagnostic potential and shows that transforming properties of
HPV are related with accelerated glycogen metabolism.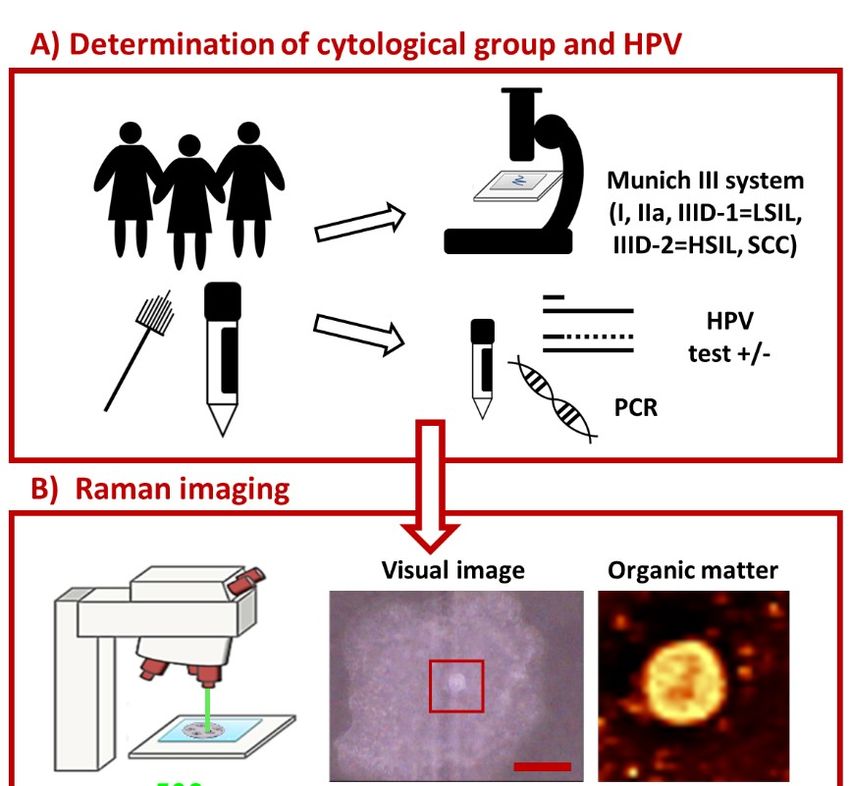
Int. J. Mol. Sci. 2020, 21, 2667 4 of 15
2. Results and Discussion
Int. J. Mol. Sci. 2020, 21, x FOR PEER REVIEW 4 of 15
2.1. Subcellular Distribution of Glycogen in Cervical Epithelial Cells
Raman imaging
imaging was used to analyze human epithelial cervical cells obtained from 96 patients
classified to eight groups
groups according
according toto Munich
Munich IIIIII system
system [51]
[51]and
andHPV
HPVtests: I/HPV−−, IIa/HPV
tests: I/HPV IIa/HPV−−,,
+
IIa/HPV+, , LSIL/HPV −
LSIL/HPV−, , LSIL/HPV +
LSIL/HPV+, ,HSIL/HPV
HSIL/HPV − +
−, HSIL/HPV+ and cancer cells – squamous cell
, HSIL/HPV and cancer cells – squamous
+
carcinoma (SCC/HPV ; ;for
+
for number
number of of patients
patients see
see Table
Table S1). TheThe cluster
cluster analysis
analysis (CA, a statistical
method enabling to classify spectra according to a chemical composition) was used to determine
distribution ofmain
distribution of mainsubcellular
subcellularstructures.
structures.AsAsthethe representative
representative microphotographs
microphotographs (Figure
(Figure 1A,C)1A,C)
and,
and, in particular
in particular CA images
CA images (Figure(Figure 1B,D)the
1B,D) show, show,
size ofthe
cellsize of cell
nuclei nuclei incells
in epithelial epithelial cells varies
varies significantly
significantly
spanning thespanning the range
range of 4.5–15.8 µmof(the
4.5–15.8
classµm (the class
denoted denoted
in blue in blue
in Figure 1B,D,in the
Figure
marker1B,D, the marker
Raman band
Raman band due to the symmetric phosphodiester stretching −1
vibration
due to the symmetric phosphodiester stretching vibration at 785 cm , Figure 1E). at 785 cm −1, Figure 1E).
Figure 1. Glycogen-rich cytoplasm
1. Glycogen-rich cytoplasm and and stores in cervical
cervical epithelial
epithelial cells. Microphotographs of
cells. Microphotographs
representative cells ((A): IIa/HPV − ; (C): IIa/HPV + ) with a cell nucleus of diameter smaller and bigger
IIa/HPV ; (C):
− + ) with a cell nucleus of diameter smaller
than 10 µm,µm, respectively, and CA images (B,D) showing distribution of cell nuclei (blue class) and
glycogen/lipid-rich stores (maroon class) in the cytoplasm (orange class). The average Raman spectra
of cell
of cell nuclei,
nuclei,cytoplasm
cytoplasmandandglycogen/lipid
glycogen/lipid stores (E) averaged
stores over over
(E) averaged all measured cells from
all measured cellsallfrom
groups
all
(in total 560 cells) along with the spectrum of the glycogen standard.
groups (in total 560 cells) along with the spectrum of the glycogen standard.
Cytoplasm (denoted
Cytoplasm (denoted in in orange)
orange) is is rich
rich in
in glycogen (Figure 1B,D)
glycogen (Figure 1B,D) asas the
the averaged
averaged spectrum
spectrum
clearly demonstrates due to presence of characteristic marker bands at 486, 577,
clearly demonstrates due to presence of characteristic marker bands at 486, 577, 860, 941, 1083, 1129, 860, 941, 1083, 1129,
1335 and 1382 cm −1 (Figure 1E). Additionally, structures of changeable size and number spread in
1335 and 1382 cm (Figure 1E). Additionally, structures of changeable size and number spread in
−1
whole −1
whole cytoplasm
cytoplasmcontaining
containinglipids
lipids(exhibiting
(exhibiting characteristic
characteristicbands duedue
bands to lipids at 1307
to lipids at and
13071445andcm1445)
and−1)glycogen
cm can becan
and glycogen separated (denoted
be separated in maroon,
(denoted FigureFigure
in maroon, 1B,D). 1B,D).
Glycogen plays an
Glycogen important
plays role in
an important
early metastasis [42], fuels glycolysis in cancer cells [42] and it is known that its content
role in early metastasis [42], fuels glycolysis in cancer cells [42] and it is known that its content decreases due
to carcinogenesis [45]. Therefore, based on Raman microscopy and statistical methods,
decreases due to carcinogenesis [45]. Therefore, based on Raman microscopy and statistical methods, we evaluated
the evaluated
we glycogen level in epithelial
the glycogen levelcells in all studied
in epithelial cellsgroups to determine
in all studied groupshow it is related
to determine to the
how it isnucleus
related
size, cervical precancerous changes, and HPV infection.
to the nucleus size, cervical precancerous changes, and HPV infection.
2.2. Glycogen Content Decreases with the Increase of Nuclei Size of Cervical Epithelial Cells in I, IIa, LSIL and
2.2. Glycogen Content Decreases with the Increase of Nuclei Size of Cervical Epithelial Cells in I, IIa, LSIL
HSIL Groups, but Not the Cancer Group
and HSIL Groups, but Not the Cancer Group
In neoplastic cells, the diameter of nuclei is bigger than in healthy cells [53]. This phenomenon
In neoplastic cells, the diameter of nuclei is bigger than in healthy cells [53]. This phenomenon
is used in pathomorphology to assess pathological changes in cells, including cervical cancer [53].
is used in pathomorphology to assess pathological changes in cells, including cervical cancer [53].
Subcellular resolution of Raman microscopy and the chemical characteristics of cell components
Subcellular resolution of Raman microscopy and the chemical characteristics of cell components
enabled to separate cells differing by the size of nuclei. The chemical composition of nuclei for cells
enabled to separate cells differing by the size of nuclei. The chemical composition of nuclei for cells
with nuclei of large and small diameter (defined arbitrarily as d ≥ 10 µm and < 10 µm, respectively) is,
with nuclei of large and small diameter (defined arbitrarily as d ≥ 10 µm and < 10 µm, respectively)
is, however, uniform independently on the group considered (Figure S1). It is in line with the finding
that regardless of its size, the amount of chromatin in the nuclei of cervical epithelial cells is similar
[18].
Nevertheless, the glycogen content (evaluated as the integral intensity of the characteristic band
at 486 cm−1 both due to glycogen dispersed in the cytoplasm and glycogen in the form of glycogen-
Int. J. Mol. Sci. 2020, 21, 2667                                                                                                 5 of 15

however, uniform independently on the group considered (Figure S1). It is in line with the finding that
regardless of its size, the amount of chromatin in the nuclei of cervical epithelial cells is similar [18].
     Nevertheless, the glycogen content (evaluated as the integral intensity of the characteristic
band atInt.486   cm   −1 both due to glycogen dispersed in the cytoplasm and glycogen in the form of
             J. Mol. Sci. 2020, 21, x FOR PEER REVIEW                                                                    5 of 15
glycogen-lipid-rich stores) occurs to be significantly decreased in cells with large cell nuclei in I/HPV− ,
         lipid-rich stores) occurs       to be significantly decreased in cells with large cell   nuclei in I/HPV−, IIa/HPV+
IIa/HPV+ and LSIL/HPV                + (Figure   2). Additionally, in groups IIa/HPV− and both HSIL groups there is
         and LSIL/HPV+ (Figure 2). Additionally, in groups IIa/HPV− and both HSIL groups there is a clear
a clear tendency
         tendency totoa areduced
                              reduced      amount
                                        amount        of glycogen
                                                 of glycogen  in cellsinwith
                                                                         cells with
                                                                             large    largealthough
                                                                                    nuclei,  nuclei, this
                                                                                                      although      this relationship
                                                                                                           relationship   is not
is not statistically      significant,forfor
         statistically significant,            HSIL
                                            HSIL      groups
                                                   groups  quitequite   obviously
                                                                 obviously            due to number
                                                                              due to limited  limitedofnumber
                                                                                                          cells withofthe
                                                                                                                       cells  with the
                                                                                                                           large
large cell  nuclei.
         cell  nuclei. For    thecancer
                         For the     cancergroups
                                             groups thethe glycogen
                                                        glycogen  contentcontent
                                                                            is not is not related
                                                                                   related  with thewith   the
                                                                                                     size of  thesize of the nucleus.
                                                                                                                   nucleus.

      Figure 2. Glycogen
              Figure          content
                      2. Glycogen        in epithelial
                                    content              cervical
                                              in epithelial cervicalcells
                                                                     cells depending
                                                                           depending onon thethe nucleus
                                                                                               nucleus  size.size. The analysis
                                                                                                              The analysis of   of
      the glycogen content in the cytoplasm of cervical epithelial cells with cell nuclei of a diameter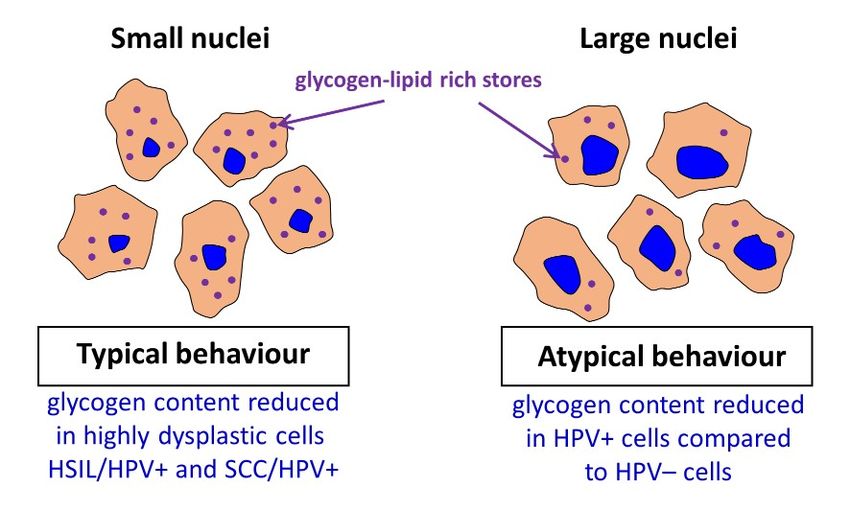
Int. J. Mol. Sci. 2020, 21, 2667 6 of 15
Int. J. Mol. Sci. 2020, 21, x FOR PEER REVIEW 6 of 15
AAdecreased
decreasedlevel levelofof glycogen
glycogen in in cervical
cervical cells
cells is usually
is usually attributed
attributed to increased
to increased glycogenolysis
glycogenolysis [40].
[40]. Our results show that for cervical cells, particularly with cell
Our results show that for cervical cells, particularly with cell nuclei of large diameter, show glycogennuclei of large diameter, show
glycogenthat
depletion depletion
may bethat maywith
related be related withglycogenolysis.
accelerated accelerated glycogenolysis.
Moreover, theMoreover,
presence ofthe HPVpresence
infection of
HPV infection additionally influences the glycogen metabolism
additionally influences the glycogen metabolism as the differences between the glycogen levels in as the differences between the
glycogen
cells with levels
large andin cells with large and
small-diameter small-diameter
cell nuclei are bigger cell nuclei
in HPV are+ bigger
groupsincompared
HPV+ groups compared
to HPV − (the
to HPV − (the decrease in the glycogen level for cells with nuclei d ≥
decrease in the glycogen level for cells with nuclei d ≥ 10 compared to d < 10 µm equals for IIa/HPV− 10 compared to d < 10 µm equals
forIIa/HPV
vs. IIa/HPV+−: vs. 24%IIa/HPV
vs. 60%;: 24%
+ vs. 60%;
LSIL/HPV − vs.LSIL/HPV
LSIL/HPVvs.
− + LSIL/HPV
: 5%
+: 5% vs. 60% and
vs. 60% and HSIL/HPV− vs. HSIL/HPV
HSIL/HPVvs.
− +
:
HSIL/HPV
35% vs. 41%).
+: 35% vs. 41%).
Patientsclassified
Patients classifiedas asgroup
groupIIa IIausually
usually present
present as as both
both cytologically
cytologically and and histologically
histologically negative.
negative.
Interestingly, the presence of large-diameter nucleus cells of
Interestingly, the presence of large-diameter nucleus cells of modified glycogen metabolism in modified glycogen metabolism inthe
the
IIa/HPV+ group
IIa/HPV
+ groupsuggests
suggeststhat thatpathological
pathological changes
changes already
already maymay occur
occur in cells
in cells ingroup,
in this this group,
whichwhich
until
until now were considered dysplasia-free, although this hypothesis
now were considered dysplasia-free, although this hypothesis undoubtedly requires further studies. undoubtedly requires further
studies.
To To investigate
investigate in more detail in more howdetail how a level
a glycogen glycogen level is influenced
is influenced by the progress
by the dysplasia dysplasiaand progress
HPV
and HPV presence, the statistical analysis of the cytoplasm glycogen
presence, the statistical analysis of the cytoplasm glycogen content in cells from all groups was content in cells from all groups
was performed
performed without without
separation separation
for cells for cells according
according to the nucleusto thesizenucleus
(Figuressize (Figures
S2 and S2 and S3).
S3). Interestingly,
Interestingly,
our results show our results
that if theshow that if the(that
large-diameter large-diameter
are less numerous(that areinless numerous
population of aingiven
population of a
group) cell
given group) cell nuclei are not excluded, the cells in various groups
nuclei are not excluded, the cells in various groups behave as previously reported, i.e., the glycogen behave as previously reported,
i.e., the is
content glycogen
decreased content is decreased
in cancer cells [40],in[54]
cancerandcells [40], [54]
increased and increased
glycogen metabolism glycogen
in HPV metabolism
+ vs. HPVin −
HPVcannot
cells
+ vs. HPV − cells cannotItbe
be observed. observed. importance
underlines It underlinesofimportance of theapproach
the single cells single cells andapproach
subcellularand
subcellular resolution of Raman
resolution of Raman microscopy used in this work. microscopy used in this work.
2.3. HPV
2.3. HPV Accelerates
Accelerates Glycogen
Glycogen Metabolism
Metabolism in
in Cervical
Cervical Epithelial
Epithelial Cells
Cells
Theresults
The resultsofof
thethe statistical
statistical analysis
analysis of theofglycogen
the glycogen level (Kruskal–Wallis
level (Kruskal–Wallis test, U’Mann–
test, U’Mann–Whitney
Whitney
test) in alltest) in all
studied studied
cells cells are presented
are presented in Figure 3in(also
Figure 3 (also
in Table in Table S2).
S2).
Figure3.3.Glycogen
Figure Glycogen content
content inin the
thecytoplasm
cytoplasm of of cervical
cervical epithelial
epithelial cells
cells depending
depending on on HPV
HPV presence.
presence.
The
Thecomparison
comparisonof ofthe
theglycogen
glycogencontent
contentininthe
thecytoplasm
cytoplasmof of cervical
cervical epithelial
epithelialcells
cells in
in studied
studied groups:
groups:
I/HPV−− (bright
I/HPV (brightgreen), IIa/HPV−− (dark
green),IIa/HPV (darkgreen), IIa/HPV++ (dark
green),IIa/HPV (darkgreen), LSIL/HPV−− (orange),
green),LSIL/HPV LSIL/HPV++
(orange),LSIL/HPV
(orange), HSIL/HPV−− (pink),
(orange), HSIL/HPV HSIL/HPV++ (pink), SCC/HPV
(pink), HSIL/HPV SCC/HPV++ (red) obtained by calculations
calculations ofof the
the
integral
integralintensity
intensityofofthe band
the bandat at
486486 −1
cmcmforfor
−1 cells with
cells thethe
with nuclei of aof
nuclei diameter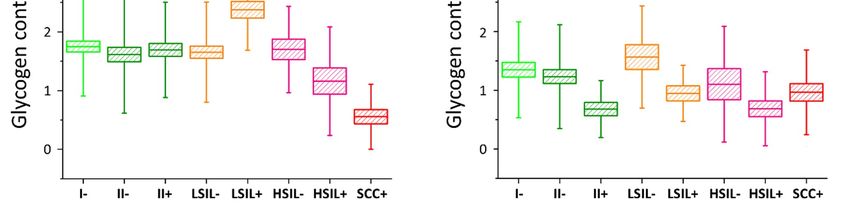
Int. J. Mol. Sci. 2020, 21, 2667 7 of 15
Int. J. Mol. Sci. 2020, 21, x FOR PEER REVIEW 7 of 15
nuclei (Figure 3A) for I/HPV− , IIa/HPV− , IIa/HPV+ , LSIL/HPV− , and HSIL/HPV− there are no
significant
statisticallydifferences between thebetween
significant differences level ofthe glycogen
level of in the cytoplasm.
glycogen The LSIL/HPV
in the cytoplasm. + shows a
The LSIL/HPV +
difficult
shows a to rationalize
difficult increase increase
to rationalize in the glycogen level. Contrarily,
in the glycogen the cells the
level. Contrarily, of patients with the with
cells of patients cervical
the
cancer
cervicalhavecancer accelerated glycogen
have accelerated metabolism
glycogen compared
metabolism to all the
compared above-mentioned
to all the above-mentioned groups, what
groups,
agrees with previous
what agrees findingsfindings
with previous showingshowingthat glycogenolysis is increased
that glycogenolysis in cancer cells
is increased [40]. This
in cancer cellseffect
[40].
is also observed by us for the for HSIL/HPV + group+ confirming their
This effect is also observed by us for the for HSIL/HPV group confirming their phenotypic similarity phenotypic similarity to
SCC/HPV
to SCC/HPV + +
cells.
cells.
In
In the case of
the case of cells possessing large-diameter
cells possessing large-diameter cell cell nuclei
nuclei (Figure
(Figure 3B) 3B) the
the results
results areare strikingly
strikingly
different. The level of glycogen in the cytoplasm of large-nucleus cells in
different. The level of glycogen in the cytoplasm of large-nucleus cells in HPV groups I, IIa, LSIL andHPV −− groups I, IIa, LSIL and
HSIL
HSIL is is similar.
similar. However,
However, the the results
results clearly
clearly show
show aa decrease
decrease of of the
the glycogen
glycogen content
content forfor cells
cells infected
infected
with HPV that is statistically significant for IIa and LSIL groups and shows
with HPV that is statistically significant for IIa and LSIL groups and shows a trend for the HSIL group. a trend for the HSIL
group.
Reduction Reduction in the glycogen
in the glycogen level equals
level equals to 45%tofor45%
IIa/HPV +
for IIa/HPV + vs. IIa/HPV
vs. IIa/HPV − , 46%− , 46% for LSIL/HPV
for LSIL/HPV + vs.
+
vs. LSIL/HPV
LSIL/HPV − and− and
37% 37%forfor HSIL
HSIL HPVHPV + vs.
+ vs.HSIL/HPV
HSIL/HPV− ,, respectively.
− respectively. Moreover,
Moreover, these these changes
changes of of the
the
glycogen content are not dependent on
glycogen content are not dependent on age (Figure S4). age (Figure S4).
For
For the SCC/HPV++ group
the SCC/HPV group thethe average
average glycogen
glycogen content
content does does notnot significantly
significantly differ
differ from
from most
most
of the groups (Figure 3B). In combination with the data in Figure 3A,
of the groups (Figure 3B). In combination with the data in Figure 3A, showing the lowest glycogen showing the lowest glycogen
level
level for
for the SCC/HPV+ +group,
theSCC/HPV group, these
theseresults underline
results underline thetheimportance
importance of separate
of separate analysis of theofcells
analysis the
with largelarge
cells with and andsmall cell cell
small nuclei.
nuclei.TheThekeykeyobservation
observation of ofthis study
this studyisisaavery verysignificant
significant glycogen
glycogen
depletion
depletion in these large-nucleus
in these large-nucleus cells cells in HPV++ groups
in HPV compared with
groups compared with the the respective
respective HPV HPV−− groups
groups
(results summarized in
(results summarized in Figure
Figure 4).
4).
Figure 4. Summary of obtained key results.
Figure 4. Summary of obtained key results.
Previously Curtis et al. [42] reported a considerable decrease in the glycogen level (the mobilization
Previously Curtis et al. [42] reported a considerable decrease in the glycogen level (the
of glycogen stores) in late metastatic cells compared to early ones. The additional energy obtained in
mobilization of glycogen stores) in late metastatic cells compared to early ones. The additional energy
cancer cells is necessary to begin high-energy tasks such as migration, invasion, and further metastasis.
obtained in cancer cells is necessary to begin high-energy tasks such as migration, invasion, and
It is hypothesized that the process of glycogen mobilization and possible increased glycolysis is used
further metastasis. It is +hypothesized that the process of glycogen mobilization and possible increased
by large-nucleus HPV cells for increased protein synthesis [55]. We also conclude that the factors
glycolysis is used by large-nucleus HPV+ cells for increased protein synthesis [55]. We also conclude
causing expanding of a cell nucleus considerably change also cellular carbohydrate metabolism and
that the factors causing expanding of a cell nucleus considerably change also cellular carbohydrate
that it may be related with neoplastic transformation. This interesting phenomenological observation
metabolism and that it may be related with neoplastic transformation. This interesting
has to be studied in the future to understand a genetic background of this phenomenon. To confirm
phenomenological observation has to be studied in the future to understand a genetic background of
results obtained by Raman microscopy, the gold standard, i.e., PAS staining of the cells was performed
this phenomenon. To confirm results obtained by Raman microscopy, the gold standard, i.e., PAS
(Figure 5).
staining of the cells was performed (Figure 5).
Int. J. Mol. Sci. 2020, 21, 2667 8 of 15
Int. J. Mol. Sci. 2020, 21, x FOR PEER REVIEW 8 of 15
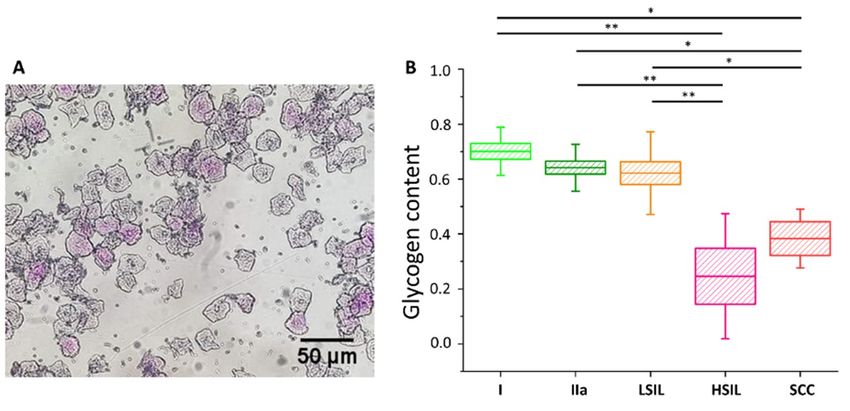
Figure 5.
Figure 5. Glycogen content in the cytoplasm of cervical epithelial cells evaluated evaluated using
using a PAS
PAS staining
staining
method. An
method. Anillustrative
illustrativephotograph
photographofof a sample
a sample of cervical epithelial
of cervical cellscells
epithelial stained by PAS
stained (A). (A).
by PAS The
analysis
The of the
analysis glycogen
of the glycogencontent
content (B)(B)
in in
the
thecytoplasm
cytoplasmofofcervical
cervicalepithelial
epithelial cells
cells according the
according to the
division of
division of patients
patients into
into groups
groups II (bright
(bright green),
green), IIa
IIa (dark
(dark green),
green), LSIL
LSIL (orange),
(orange), HSIL
HSIL (pink)
(pink) and
and SCC
SCC
(red).
(red). Glycogen
Glycogen content
content was
was determined
determined by by optical
optical evaluation
evaluation in
in a light microscope after PAS PAS staining
staining
by
by calculations
calculations ofof the
the average
average percentage
percentage of of stained cells among all cells stained in individual groups.
Each
Each point
point on
on the
the graph
graph corresponds
corresponds to the the average
average result for
for one patient (B). Values
Values were
were given
given as
as
mean
mean ± ± SEM and were shown in box plots:
box plots: mean (horizontal line), SEM (box), minimal and maximal
SEM (box), minimal and maximal
values (whiskers). ** pp <
values (whiskers). < 0.05, ** p
Int. J. Mol. Sci. 2020, 21, 2667                                                                            9 of 15
Int. J. Mol. Sci. 2020, 21, x FOR PEER REVIEW                                                              9 of 15

     Figure 6. The scheme of the experiment layout. Cell cytological classification and testing for HPV
     Figure 6. The scheme of the experiment layout. Cell cytological classification and testing for HPV
     infection (A), cell measurement by Raman microscopy (B) followed by Cluster Analysis and comparison
     infection
     of spectra (A),  cell groups
                between    measurement
                                  (C).   by Raman microscopy (B) followed by Cluster Analysis and
     comparison of spectra between groups (C).
      Eight groups of patients have been analyzed in this study. The division into groups was based
      Eight
 on the     groups
        results of theofcervical
                         patientscytology
                                  have beentestanalyzed  in thisaccording
                                                and classified    study. The
                                                                           to division  into
                                                                               Munich III  andgroups
                                                                                                 the PCRwastest
                                                                                                             based
                                                                                                                for
on
 thethe resultsof
     presence   of HPV
                   the cervical  cytology
                         infection.        test and
                                    Research         classified
                                                included        according
                                                           patients  whosetoepithelial
                                                                               Munich III  and
                                                                                        cells    the classified
                                                                                              were    PCR test for
                                                                                                                 as
the  presence  of  HPV   infection. Research    included   patients  whose  epithelial cells  were
 group I, HPV negative; group IIa, HPV negative; group IIa, HPV positive; group IIID-1, HPV negative;classified  as
group   I, HPVHPV
 group IIID-1,    negative;   group
                      positive; groupIIa, HPVHPV
                                       IIID-2,    negative;  group
                                                     negative;  groupIIa, HPVHPV
                                                                       IIID-2,  positive;  group
                                                                                     positive        IIID-1,
                                                                                               (IIID-1        HPV
                                                                                                        and IIID-2
negative;  groupto
 corresponding     IIID-1, HPVLSIL–low-grade
                      Bethesda   positive; group IIID-2,   HPVintraepithelial
                                                    squamous      negative; group  IIID-2,
                                                                                 lesion    HPV
                                                                                         and       positive (IIID-
                                                                                              HSIL–high-grade
1squamous
   and IIID-2 corresponding     to Bethesda   LSIL–low-grade      squamous   intraepithelial
            intraepithelial lesion groups, respectively); and patients suffering from squamous lesion  andcervical
                                                                                                            HSIL–
high-grade
 carcinoma (SCC), HPV positive. Due to only 1 and 2 samples in groups I, HPV positive and from
              squamous      intraepithelial  lesion   groups,   respectively);  and   patients    suffering   SCC,
squamous cervical carcinoma (SCC), HPV positive. Due to only 1 and 2 samples in groups I, HPV
positive and SCC, HPV negative, respectively, these groups were considered as statistically
Int. J. Mol. Sci. 2020, 21, 2667                                                                  10 of 15

HPV negative, respectively, these groups were considered as statistically unreliable. Cells from every
patient were divided into two parts and submitted for Raman imaging and PCR. For Raman imaging,
freshly isolated cells were fixed using a 2.5% solution of glutaraldehyde for 4 min, then washed twice
with PBS and stored in PBS in 4 ◦ C until the measurement. Before Raman measurements, cells were
placed on a Raman substrate (CaF2 slides, Crystran LTD., Poole, UK). For DNA isolation for PCR,
cells were frozen in −20 ◦ C until the assay was performed.
      The trial was approved by the Bioethics Committee of the Jagiellonian University (23 Feb 2018,
identification code: 1072.6120.29.2018). Written informed consents were obtained from all participants.

3.2. Raman Microscopy
      Raman imaging was performed using confocal Raman spectrometer WITec Alpha 300 (Ulm,
Germany) equipped with a UHTS 300 spectrograph (600 grooves·mm−1 grating, spectral resolution of
3 cm−1 ) and a CCD detector (DU401A-BV-352, Andor, Belfast, UK). A laser power of ca. 28 mW on
a sample provided by a solid state 532 nm laser source was used. A 63× water immersive objective (Zeiss
Fluor, NA = 1.0, Zeiss, Oberkochen, Germany) was applied to collect Raman spectra. Raman spectra
were acquired with the integration time of 0.3 s for areas of 15 × 15 µm2 including cell nuclei with
fragment of cytoplasm with the sampling density of 0.5 µm. For each patient at average 10 cells were
measured (Figure 6B).
      Pre-treatment of data—the procedure of cosmic rays removal and the background correction
(polynomial of 3 degree) was carried out using the software WITec Project Plus 2.10. All imaging
data were analyzed using the Cluster Analysis (CA, Figure 6C, K-means, Manhattan distance) to
discriminate and separate the spectra from nuclei, cytoplasm and glycogen-lipid rich stores. The Opus
7.2 software was used for the vector normalization in the spectral range of 1500–400 cm−1 , the averaging
of the spectra in individual groups and calculations of the integral intensity of a band at 486 cm−1 due
to the glycogen vibrations.
      Statistical analysis of the data was performed using the Origin 9.1 software and the STATISTICA
13.3 software. The Shapiro–Wilk test was used to check whether the data met the assumption of normal
distribution. Then, Kruskal–Wallis and Mann–Whitney U tests were performed (because data were not
normally distributed). A Pearson’s correlation method was used to calculate the correlation between
data. Two cells from groups IIa/HPV+ (big-diameter nuclei) and LSIL/HPV+ (big-diameter nuclei)
and one cell from groups HSIL/HPV+ (big-diameter nuclei), LSIL/HPV+ (small-diameter nuclei) and
SCC/HPV+ (small-diameter nuclei) was rejected from the analysis, as they were classified as outliers
based on interquartile range.

3.3. PCR Reactions
     PCR reactions for the presence of genital types of HPV infection were carried out using a nested PCR
method and 2 pairs of primers: external MY09/MY11 and internal GP5+/GP6+ using Mastercycler Nexus
× 2 from Eppendorf (Hamburg, Germany). To visualize nPCR effects, an agarose gel electrophoresis
with addition of bromodeoxyuridine (BrDU) was performed. The test used detected fourteen types
of highly oncogenic HPV (HPVhr): HPV16, 18, 31, 33, 35, 39, 45, 51, 52, 56, 58, 59, 66, and 68.
For confirmation that only highly oncogenic types of HPV were analyzed, Cobas HPV (Roche, Basel,
Switzerland) test was used.

3.4. PAS Staining
      PAS staining was performed according to a known procedure [56]. Prior to staining, cells previously
fixed with glutaraldehyde (2.5% solution, the same fixing procedure as described in Section 3.1) were
centrifuged in a volume of 200 µL using a cytospin centrifuge (Shandon, Runcorn, UK; 200 rpm, 5 min)
to fix the cells on a microscope slide. Cells were stained with 0.5% periodic acid solution for 5 min,
placed in a Schiff reagent for 15 min and stained with Gill-modified hematoxylin for 90 s. Between
staining, cells were washed with PBS buffer. The ratio of stained cells to total cells counted was under
Int. J. Mol. Sci. 2020, 21, 2667 11 of 15
a light microscope (Axioskop, Zeiss, Oberkochen, Germany) at 10× magnification. Cells in two fields
of view were counted for each sample.
4. Conclusions
In this study, we assessed differences in the cytoplasm glycogen level of cervical epithelial cells,
collected from 96 women, depending on the presence of HPV infection, dysplastic changes and nucleus
diameter using Raman microscopy and chemometric data analysis. The applied methodology appeared
to be crucial to account for a considerable heterogeneity of cells in studied groups (I/HPV− , IIa/HPV− ,
IIa/HPV+ , LSIL/HPV− , LSIL/HPV+ , HSIL/HPV− , HSIL/HPV+ and SCC/HPV+ ). In particular, due to
the subcellular resolution of Raman imaging, we were able to separate a subgroup of cervical cells with
large (over 10 µm) diameter of nuclei, showing unexpected chemical and metabolic characteristics.
As our results demonstrate, in cervical cells glycogen is both dissolved in cytoplasm and aggregated
with lipids in the form of glycogen-lipid-rich granules. For cells with small-diameter nuclei, the global
level of glycogen in the cytoplasm is similar for considered groups apart from the SCC/HPV+ group
that is characterized by a decrease in the glycogen content in agreement with previous studies [40]
and HSIL/HPV+ group that is phenotypically similar to SCC/HPV+ . Additionally, somewhat difficult
to rationalize is an increase in the LSIL/HPV+ level. Importantly, there are no differences between
the glycogen content for small-diameter cells in the HPV+ and HPV− respective groups. Contrarily,
for the subpopulation of large-nucleus cells, the cytoplasm glycogen level is significantly reduced of
about 37–46% for HPV+ cells compared to HPV− cells. It shows that for this subpopulation of cells,
glycogen metabolism accelerates with HPV infection. The considerable depletion of the glycogen
level in HPV infected cells may be associated with molecular pathways related with HPV E6 and E7
proteins [57,58] and increased energetic needs in the HPV infected cells for protein synthesis and virus
replication. The mobilization of glycogen stores, i.e., increased glycogenolysis in late compared to
early metastatic cells was previously attributed in ovarian cancer cells to their increased capabilities
for migration and invasion [47]. Understanding of molecular basis of accelerated glycogenolysis in
HPV infected cervical cells requires further research to shed light on mechanism of HPV-induced
carcinogenic transformation.
Last, but not least, lack of reagents and speed of Raman spectroscopy could be advantageous in
HPV diagnostics compared to the DNA-HPV method. Raman spectroscopy may be in future a base for
a simple, automatized test for HPV; however, it certainly requires further testing on a bigger cohort of
patients and improvement of the methodology.
Supplementary Materials: Supplementary materials can be found at http://www.mdpi.com/1422-0067/21/8/2667/s1.
Author Contributions: Conceptualization, A.K. and S.S.; methodology, A.K., S.S, K.S., K.C., M.K.; investigation,
K.S. and K.C.; resources, J.B. and M.K.; writing—original draft, K.S.; writing—review and editing, A.K., S.S, K.C.,
B.Z.; visualization, K.S. and K.C.; supervision, A.K. and S.S.; funding acquisition, A.K. All authors have read and
agreed to the published version of the manuscript.
Funding: The study was supported by the grant from the Polish National Science Center (OPUS9
grant 2015/17/B/ST4/03894 to AK). Katarzyna Sitarz acknowledges the fellowship with the project no.
POWR.03.02.00-00-I013/16. Katarzyna Sitarz acknowledges the support of InterDokMed project no.
POWR.03.02.00-00-I013/16.
Acknowledgments: We are grateful to Zuzanna Majka who helped with the measurements using the fiber
probe Raman spectroscopy. We would like to thank the technical staff of the Department of Virology, Chair of
Microbiology UJ CM (Ewa Kleszcz, Jolanta Kopec, Anna Malska-Wozniak and Danuta Rojek-Zakrzewska) for
help in transporting samples, for help in laboratory work and for all tips and advice.
Conflicts of Interest: The authors declare no conflict of interest. The funders had no role in the design of the
study; in the collection, analyses, or interpretation of data; in the writing of the manuscript, or in the decision to
publish the results.Int. J. Mol. Sci. 2020, 21, 2667 12 of 15
Abbreviations
Akt protein kinase B
BrDu bromodeoxyuridine
CAF cancer-associated fibroblasts
FTIR Fourier Transform Infrared Spectroscopy
HPV human papillomavirus
LCR long control region
nPCR nested PCR
P38 MAPK kinase P38 mitogen-activated protein kinase
PAS Periodic acid–Schiff staining
PCR polymerase chain reaction
PI3K phosphoinositide 3-kinase
SCC squamous cell carcinoma
Smad an acronym from the fusion of Caenorhabditis elegans Sma (“small” worm
phenotype) genes and the Drosophila Mad (Mothers against decapentaplegic)
TGF-β1 transforming growth factor β1
References
1. Bray, F.; Ferlay, J.; Soerjomataram, I.; Siegel, R.L.; Torre, L.A.; Jemal, A. Global cancer statistics 2018:
GLOBOCAN estimates of incidence and mortality worldwide for 36 cancers in 185 countries. CA Cancer J.
Clin. 2018, 68, 394–424. [CrossRef] [PubMed]
2. Petry, K.U.; Wörmann, B.; Schneider, A. Benefits and risks of cervical cancer screening. Oncol. Res. Treat.
2014, 37 (Suppl. S3), 48–57. [CrossRef]
3. Li, W.; Qi, Y.; Cui, X.; Huo, Q.; Zhu, L.; Zhang, A.; Tan, M.; Hong, Q.; Yang, Y.; Zhang, H.; et al. Characteristic
of HPV Integration in the Genome and Transcriptome of Cervical Cancer Tissues. BioMed Res. Int. 2018,
6242173. [CrossRef] [PubMed]
4. Yim, E.; Park, J. The Role of HPV E6 and E7 Oncoproteins in HPV-associated Cervical Carcinogenesis. Cancer
Res. Treat. 2005, 37, 319–324. [CrossRef] [PubMed]
5. Karimi-Zarchi, M.; Peighmbari, F.; Karimi, N.; Rohi, M.; Chiti, Z. A comparison of 3 ways of conventional
pap smear, liquid-based cytology and colposcopy vs cervical biopsy for early diagnosis of premalignant
lesions or cervical cancer in women with abnormal conventional Pap test. Int. J. Biomed. Sci. 2013, 9, 205–210.
[PubMed]
6. Shaw, P.A. The History of Cervical Screening I: The Pap. Test. J. Obstet. Gynaecol. Can. 2000, 22, 110–114.
[CrossRef]
7. Moriarty, A.T.; Nayar, R.; Arnold, T.; Gearries, L.; Renshaw, A.; Thomas, N.; Souers, R. The tahoe study:
Bias in the interpretation of papanicolaou test results when human papillomavirus status is known. Arch.
Pathol. Lab. Med. 2014, 138, 1182–1185. [CrossRef]
8. Crothers, B.A.; Booth, C.N.; Darragh, T.M.; Zhao, C.; Souers, R.J.; Thomas, N.; Moriarty, A.T. False-Positive
Papanicolaou (PAP) Test Rates in the College of American Pathologists PAP Education and PAP Proficiency
Test Programs. Arch. Pathol. Lab. Med. 2014, 138, 613–619. [CrossRef]
9. Castillo, M.; Astudillo, A.; Clavero, O.; Velasco, J.; Ibanez, R.; de Sanjose, S. Poor Cervical Cancer Screening
Attendance and False Negatives. A Call for Organized Screening. PLoS ONE 2016, 11, e0161403. [CrossRef]
10. Abreu, A.L.P.; Souza, R.P.; Gimenes, F.; Consolaro, M.E.L. A review of methods for detect human
Papillomavirusinfection. Virol. J. 2012, 9. [CrossRef]
11. Ogilvie, G.S.; Niekerk, D.; Van Krajden, M.; Smith, L.W.; Cook, D.; Gondara, L.; Ceballos, K.; Quinlan, D.;
Lee, M.; Martin, R.E.; et al. Effect of Screening With HPV Testing vs Cytology for Cervical Intraepithelial
Neoplasia. JAMA 2018, 320, 43–52. [CrossRef] [PubMed]
12. Burd, E. Human papillomavirus and cervical cancer. Clin. Microbiol. Rev. 2003, 16, 1–17. [CrossRef]
[PubMed]Int. J. Mol. Sci. 2020, 21, 2667 13 of 15
13. Bruni, L.; Albero, G.; Serrano, B.; Mena, M.; Gomez, D.; Muñoz, J.; Bosch, F.X.; de Sanjosé, S. Human
Papillomavirus and Related Diseases Report; ICO/IARC Inf Center HPV and Cancer (HPV Inf Center): Barcelona,
Spain, 2019.
14. Cubie, H.A. Diseases associated with human papillomavirus infection. Virology 2013, 445, 21–34. [CrossRef]
[PubMed]
15. Monsonego, J.; Cox, J.T.; Behrens, C.; Sandri, M.; Franco, E.L.; Yap, P.S.; Huh, W. Prevalence of high-risk
human papilloma virus genotypes and associated risk of cervical precancerous lesions in a large U.S.
screening population: Data from the ATHENA trial. Gynecol. Oncol. 2015, 137, 47–54. [CrossRef]
16. Muñoz, N.; Bosch, F.X.; De Sanjosé, S.; Herrero, R.; Castellsagué, X.; Shah, K.V.; Snijders, P.J.F.; Meijer, C.J.L.M.
Epidemiologic classification of human papillomavirus types associated with cervical cancer. N. Engl. J. Med.
2003, 348, 518–527. [CrossRef]
17. De Sanjosé, S.; Brotons, M.; Pavón, M.A. The natural history of human papillomavirus infection. Best Pract.
Res. Clin. Obstet. Gynaecol. 2018, 47, 2–13. [CrossRef]
18. Sørensen, F.B.; Bichel, P.; Jakobsen, A. DNA level and stereologic estimates of nuclear volume in squamous
cell carcinomas of the uterine cervix. A comparative study with analysis of prognostic impact. Cancer 1992,
69, 187–199. [CrossRef]
19. Neumann, F.R.; Nurse, P. Nuclear size control in fission yeast. J. Cell Biol. 2007, 179, 593–600. [CrossRef]
20. Veltri, R.W. Epithelia Nuclear Size and Shape. Prostate 2011, 68, 1097–1104. [CrossRef]
21. Jevtić, P.; Edens, L.J.; Li, X.; Nguyen, T.; Chen, P.; Levy, D.L. Concentration-dependent effects of nuclear
lamins on nuclear size in xenopus and mammalian cells. J. Biol. Chem. 2015, 290, 27557–27571. [CrossRef]
22. O’Brien, L.L.; Wiese, C. TPX2 is required for postmitotic nuclear assembly in cell-free Xenopus laevis egg
extracts. J. Cell Biol. 2006, 173, 685–694. [CrossRef] [PubMed]
23. Irish, J.M.; Kotecha, N.; Nolan, G.P. Mapping normal and cancer cell signalling networks: Towards single-cell
proteomics. Nat. Rev. Cancer 2006, 6, 685–694. [CrossRef] [PubMed]
24. Wang, D.; Bodovitz, S. Single cell analysis: The new frontier in “Omics” Single cell analysis: Needs and
applications. Trends Biotechnol. 2010, 28, 281–290. [CrossRef] [PubMed]
25. Shang, X.; Li, J.; Feng, Y.; Chen, H.; Guo, W.; Zhang, J.; Wang, T.; Xu, X. Low-cytotoxicity fluorescent probes
based on anthracene derivatives for hydrogen sulfide detection. Front. Chem. 2018, 6, 202. [CrossRef]
[PubMed]
26. Ostertag, E.; Stefanakis, M.; Rebner, K.; Kessler, R.W. Elastic and inelastic light scattering spectroscopy and
its possible use for label-free brain tumor typing. Anal. Bioanal. Chem. 2017, 409, 6613–6623. [CrossRef]
[PubMed]
27. Swain, R.J.; Stevens, M.M. Raman microspectroscopy for non-invasive biochemical analysis of single cells.
Biochem. Soc. Trans. 2007, 35, 544–549. [CrossRef]
28. Czamara, K.; Majzner, K.; Selmi, A.; Baranska, M.; Ozaki, Y.; Kaczor, A. Unsaturated lipid bodies as a hallmark
of inflammation studied by Raman 2D and 3D microscopy. Sci. Rep. 2017, 7, 1–10. [CrossRef]
29. Czamara, K.; Karnas, E.; Majka, Z.; Wojcik, T.; Zuba-Surma, E.; Baranska, M.; Kaczor, A. Impact of cell cycle
dynamics on pathology recognition: Raman imaging study. J. Biophotonics 2019, 12, e201800152. [CrossRef]
30. Czamara, K.; Petko, F.; Baranska, M.; Kaczor, A. Raman microscopy at the subcellular level: A study on
early apoptosis in endothelial cells induced by Fas ligand and cycloheximide. Analyst 2016, 141, 1390–1397.
[CrossRef]
31. Brozek-Pluska, B.; Musial, J.; Kordek, R.; Abramczyk, H. Analysis of human colon by raman spectroscopy
and imaging-elucidation of biochemical changes in carcinogenesis. Int. J. Mol. Sci. 2019, 20, 3398. [CrossRef]
32. Kourkoumelis, N.; Balatsoukas, I.; Moulia, V.; Elka, A.; Gaitanis, G.; Bassukas, I.D. Advances in the in vivo
Raman spectroscopy of malignant skin tumors using portable instrumentation. Int. J. Mol. Sci. 2015, 16,
14554–14570. [CrossRef] [PubMed]
33. Bonnier, F.; Traynor, D.; Kearney, P.; Clarke, C.; Knief, P.; Martin, C.; O’Leary, J.J.; Byrne, H.; Lyng, F. Processing
ThinPrep cervical cytological samples for Raman spectroscopic analysis. Anal. Methods 2014, 6, 7831–7841.
[CrossRef]Int. J. Mol. Sci. 2020, 21, 2667 14 of 15
34. Daniel, A.; Aruna, P.; Ganesan, S.; Joseph, L. Biochemical assessment of human uterine cervix by micro-Raman
mapping. Photodiagn. Photodyn. Ther. 2017, 17, 65–74. [CrossRef] [PubMed]
35. Duraipandian, S.; Traynor, D.; Kearney, P.; Martin, C.; O’Leary, J.J.; Lyng, F.M. Raman spectroscopic detection
of high-grade cervical cytology: Using morphologically normal appearing cells. Sci. Rep. 2018, 8, 1–8.
[CrossRef] [PubMed]
36. Vargis, E.; Tang, Y.W.; Khabele, D.; Mahadevan-Jansen, A. Near-infrared raman microspectroscopy detects
high-risk human papillomaviruses. Transl. Oncol. 2012, 5, 172–179. [CrossRef] [PubMed]
37. Wood, B.R.; Quinn, M.A.; Burden, F.R.; McNaughton, D. An investigation into FTIR spectroscopy as
a biodiagnostic tool for cervical cancer. Biospectroscopy 1996, 2, 143–153. [CrossRef]
38. Golovynska, I.; Kalmukova, O.; Svitina, H.M.; Kyryk, V.M.; Shablii, V.A.; Senchylo, N.V.; Ostrovska, G.W.;
Dzerzhinskyi, M.; Stepanov, Y.V.; Golovynskyi, S.; et al. Morpho-Functional Characteristics of Bone Marrow
Multipotent Mesenchymal Stromal Cells after Activation or Inhibition of Epidermal Growth Factor and
Toll-Like Receptors or Treatment with DNA Intercalator Cisplatin. Cytom. Part A 2019, 95, 24–33. [CrossRef]
39. Abbiss, J.W. Early diagnosis of Cancer of the Cervix Uteri. Br. Med. J. 1956, 1, 49–51. [CrossRef]
40. Warburg, O. On the origin of cancer cells. Science 1956, 123, 309–314. [CrossRef]
41. Öhlund, D.; Elyada, E.; Tuveson, D. Fibroblast heterogeneity in the cancer wound. J. Exp. Med. 2014, 211,
1503–1523. [CrossRef]
42. Curtis, M.; Kenny, H.A.; Ashcroft, B.; Salomon, A.R.; Nebreda, A.R.; Lengyel, E. Fibroblasts Mobilize Tumor
Cell Glycogen to Promote Proliferation and Metastasis. Cell Metab. 2019, 29, 141–155.e9. [CrossRef] [PubMed]
43. Gregoire, A.T.; Ledger, W.D.; Moran, M.J. The Glycogen Content of the Human Female Genital Tract in
Cycling, Menopausal, and Women with Encometrial and Cervical Carcinoma. Fertil. Steril. 1973, 24, 198–201.
[CrossRef]
44. Kanungo, S.; Wells, K.; Tribett, T.; El-Gharbawy, A. Glycogen metabolism and glycogen storage disorders.
Ann. Transl. Med. 2018, 6, 474. [CrossRef] [PubMed]
45. Hervieu, A.; Kermorgant, S. The role of PI3K in Met driven cancer: A recap. Front. Mol. Biosci. 2018, 5, 86.
[CrossRef] [PubMed]
46. Sano, H.; Kane, S.; Sano, E.; Miinea, C.P.; Asara, J.M.; Lane, W.S.; Garner, C.W.; Lienhard, G.E.
Insulin-stimulated phosphorylation of a Rab GTPase-activating protein regulates GLUT4 translocation. J.
Biol. Chem. 2003, 278, 14599–14602. [CrossRef] [PubMed]
47. Rodríguez-García, A.; Samsó, P.; Fontova, P.; Simon-Molas, H.; Manzano, A.; Castano, E.; Rosa, J.L.;
Martinez-Outshoorn, U.; Ventura, F.; Navarro-Sabate, A.; et al. TGF-β1 targets Smad, p38 MAPK,
and PI3K/Akt signaling pathways to induce PFKFB3 gene expression and glycolysis in glioblastoma
cells. FEBS J. 2017, 284, 3437–3454. [CrossRef]
48. Mishra, A.K.; Parish, C.R.; Wong, M.L.; Licinio, J.; Blackburn, A.C. Leptin signals via TGFB1 to promote
metastatic potential and stemness in breast cancer. PLoS ONE 2017, 12, e0178454. [CrossRef]
49. Contreras-Paredes, A.; De la Cruz-Hernández, E.; Martínez-Ramírez, I.; Dueñas-González, A.; Lizano, M.
E6 variants of human papillomavirus 18 differentially modulate the protein kinase B/phosphatidylinositol
3-kinase (akt/PI3K) signaling pathway. Virology 2009, 383, 78–85. [CrossRef]
50. Menges, C.W.; Baglia, L.A.; Lapoint, R.; McCance, D.J. Human papillomavirus type 16 E7 up-regulates AKT
activity through the retinoblastoma protein. Cancer Res. 2006, 66, 5555–5559. [CrossRef]
51. Cirkel, C.; Barop, C.; Beyer, D.A. Method comparison between Munich II and III nomenclature for Pap smear
samples. Ger. Gynecol. Assoc. 2015, 16, 203–207. [CrossRef]
52. Griesser, H.; Marquardt, K.; Jordan, B.; Kühn, W.; Neis, K.; Neumann, H.H. Münchner Nomenklatur III:
Gynäkologische Zytodiagnostik der Zervix. Frauenarzt 2013, 54, 1042–1048.
53. Zink, D.; Fischer, A.H.; Nickerson, J.A. Nuclear structure in cancer cells. Nat. Rev. Cancer 2004, 4, 677–687.
[CrossRef] [PubMed]
54. Zois, C.E.; Harris, A.L. Glycogen metabolism has a key role in the cancer microenvironment and provides
new targets for cancer therapy. J. Mol. Med. 2016, 94, 137–154. [CrossRef] [PubMed]
55. Dolfi, S.C.; Chan, L.L.-Y.; Qiu, J.; Tedeschi, P.M.; Bertino, J.R.; Hirshfield, K.M.; Oltvai, Z.N.; Vazquez, A.
The metabolic demands of cancer cells are coupled to their size and protein synthesis rates. Cancer Metab.
2013, 1, 20. [CrossRef] [PubMed]
56. Aterman, K.; Norkin, S. The periodic acid-Schiff reaction. Nature 1963, 197, 1306. [CrossRef] [PubMed]Int. J. Mol. Sci. 2020, 21, 2667 15 of 15
57. Thomas, M.C.; Chiang, C.M. E6 oncoprotein represses p53-dependent gene activation via inhibition of
protein acetylation independently of inducing p53 degradation. Mol. Cell 2005, 17, 251–264. [CrossRef]
[PubMed]
58. Lee, D.; Lim, C.; Seo, T.; Kwon, H.; Min, H.; Choe, J. The viral oncogene human papillomavirus E7
deregulates transcriptional silencing by Brm-related gene 1 via molecular interactions. J. Biol. Chem. 2002,
277, 48842–48848. [CrossRef]
© 2020 by the authors. Licensee MDPI, Basel, Switzerland. This article is an open access
article distributed under the terms and conditions of the Creative Commons Attribution
(CC BY) license (http://creativecommons.org/licenses/by/4.0/).You can also read