Human Impact on the Spatiotemporal Evolution of Beach Resilience on the Northwestern Yucatan Coast
←
→
Page content transcription
If your browser does not render page correctly, please read the page content below
BRIEF RESEARCH REPORT
                                                                                                                                          published: 24 February 2021
                                                                                                                                     doi: 10.3389/fmars.2021.637205

                                            Human Impact on the
                                            Spatiotemporal Evolution of Beach
                                            Resilience on the Northwestern
                                            Yucatan Coast
                                            Alec Torres-Freyermuth 1,2* , Gabriela Medellín 1,2 and Paulo Salles 1,2
                                            1
                                             Laboratorio de Ingeniería y Procesos Costeros, Instituto de Ingeniería, Unidad Académica Sisal, Universidad Nacional
                                            Autónoma de México, Sisal, Mexico, 2 Laboratoratorio Nacional de Resiliencia Costera, Instituto de Ingeniería, Unidad
                                            Académica Sisal, Universidad Nacional Autónoma de México, Sisal, Mexico

                                            The northern Yucatan peninsula is prone to coastal flooding and erosion owing to its
                                            low-land elevation and high exposure to storms. Therefore, it is important to assess the
                                            capability of the beach-dune system to resist, recover, and adapt from storms in the
                                            context of coastal development and climate change. This work aims to investigate the
                                            role of human impacts on the spatiotemporal evolution of the Coastal Resilience Index
                                            (CRI) in the area. The study is conducted on a prograding micro-tidal beach located on
                            Edited by:
                      Duccio Bertoni,       the vicinity of coastal structures. Beach and dune morphometrics, characteristic beach
                University of Pisa, Italy   parameters, and maximum shoreline recession were determined from the analysis of
                        Reviewed by:        beach profiles undertaken along a 2-km straight of coastline during the 2015–2020
                         Jorge Guillen,
 Instituto de Ciencias del Mar (CSIC),
                                            period. Moreover, the maximum extreme water levels were estimated using in situ
                                 Spain      data and numerical models. This information is employed to assess the alongshore
                      Edoardo Grottoli,
                                            and temporal variability of the beach resilience. The results suggest that the beach
    Ulster University, United Kingdom
                                            and dune morphology present alongshore and temporal variability due to the human
                  *Correspondence:
               Alec Torres-Freyermuth       impacts associated to the dune degradation and the presence of coastal structures.
                  atorresf@ii.unam.mx       The analysis shows that coastal resilience has been increasing over the past years
                                            but presents significant alongshore variations. High CRI values were found at beach
                   Specialty section:
         This article was submitted to      transects presenting low anthropogenic impact, whereas low resilience was observed
           Coastal Ocean Processes,         at transects with a degraded dune or located in the vicinity of coastal structures
               a section of the journal
          Frontiers in Marine Science       regardless of presenting high progradation rates. The observed beach response during
       Received: 02 December 2020           the passage of recent tropical storms is consistent with the CRI values.
        Accepted: 27 January 2021
                                            Keywords: coastal resilience, beach-dune evolution, beach erosion, storms, extreme water levels
       Published: 24 February 2021
                              Citation:
     Torres-Freyermuth A, Medellín G
and Salles P (2021) Human Impact on
                                            INTRODUCTION
         the Spatiotemporal Evolution
               of Beach Resilience on
                                            Low-laying coastal areas are prone to natural and anthropogenic perturbations associated to
    the Northwestern Yucatan Coast.         population growth, extreme events, and climate change (Wong et al., 2014). Sea level rise due to
            Front. Mar. Sci. 8:637205.      climate change is expected to reach between 0.5 and 1.0 m by the end of the century (Nicholls et al.,
    doi: 10.3389/fmars.2021.637205          2014). The population growth in coastal areas has been accelerated over the past decades owing to

Frontiers in Marine Science | www.frontiersin.org                                 1                                         February 2021 | Volume 8 | Article 637205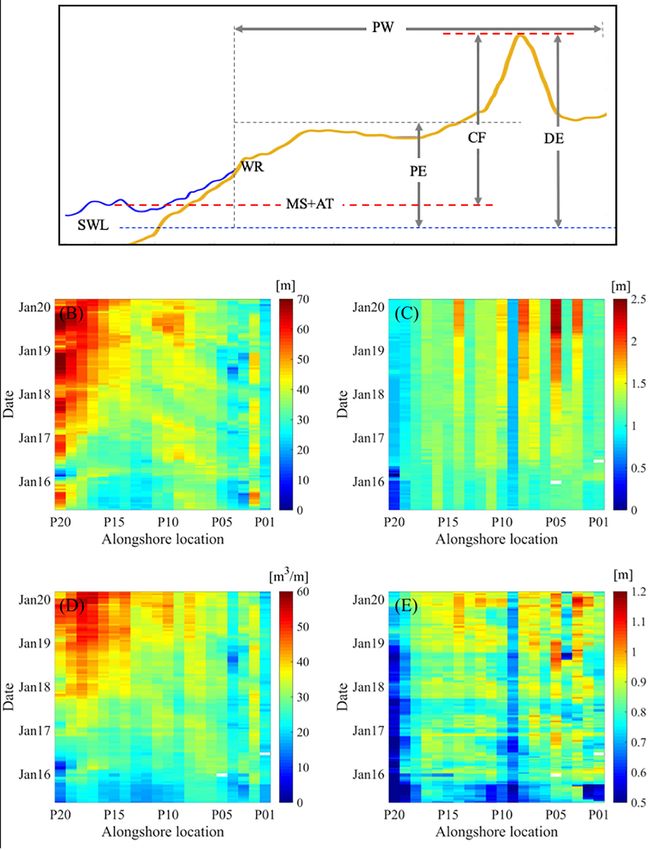
Torres-Freyermuth et al.                                                                                        Human Impact on Beach Resilience

increasing economic activities and is expected to continue                beach morphology (beach width and beach elevation) and beach
accelerating during the current century (Neumann et al., 2015).           erosion (maximum shoreline recession) on coastal protection.
    Coastal ecosystems (beaches, dunes, mangrove, seagrass, reefs,        The CRI is considered a more integrated approach, and thus was
and wetlands) provide numerous ecosystem services including               employed in the present work given the availability of beach-dune
habitat to species and carbon dioxide sequestration (Pendleton            morphology data with a high spatial and temporal resolution.
et al., 2012). Furthermore, they can provide natural coastal                 The aim of this work is to investigate the role of human
protection by inducing wave energy dissipation during extreme             impact on costal resilience on a microtidal prograding beach
events (Narayan et al., 2016), and the foredune acts as a natural         located in Sisal, on the northwestern Yucatan peninsula’s coast.
barrier which provides ultimate coastal protection against coastal        This approach allows us to improve our understanding on the
flooding (Sallenger, 2000). However, coastal development has              elements that determine a resilient beach in the study area to
threatened such ecosystems, often triggering a greater exposure           further identify strategies to improve its resilience. The outline
to extreme events and sea level rise (Neumann et al., 2015),              of this paper is the following. First, material and methods are
reducing their resilience.                                                described, including the description of the study area, data
    Beach morphology plays a key role in the coastal protection—          sources, and the framework employed in this work. Section
acting as a positive feedback—by adjusting to the prevailing              “Results” estimates the key elements required to determine the
hydrodynamic conditions to dissipate more effectively the wave            trajectory of the CRI in the study area. Finally, discussion and
energy (Hoefel and Elgar, 2003). Stationary changes in the pattern        concluding remarks are given.
of cross-shore transport, associated with wave conditions, are
responsible for beach accretion–erosion cycles (Aubrey, 1979).
Nevertheless, the beach capacity to resist storms, without losing         MATERIALS AND METHODS
its functionality, can be heavily undermined by the presence of
coastal structures (groins and breakwaters) which interrupt the           Study Site
littoral transport. This can become a major problem at locations          The northern Yucatan Peninsula coast is located in the Gulf
with a large net alongshore sediment transport. Furthermore,              of Mexico (Figure 1A), and is characterized by a wide and
dune degradation also has important implications on resisting             shallow continental shelf, karstic geology, low-land elevation,
flooding and erosion during storm events (Durán and Moore,                and the presence of a barrier island (Figure 1B). Micro-tidal
2013; Feagin et al., 2019).                                               diurnal regime (0.4 m spring amplitude) and low-energy wave
    The coastal resilience has been employed to provide a                 conditions (Hs = 1 m) are ubiquitous in this region (Torres-
framework to propose sustainable solutions (Masselink and                 Freyermuth et al., 2017). In the Yucatan Peninsula, tourism
Lazarus, 2019). The National Academy of Sciences defines the              activities have triggered a threefold population growth between
resilience as “the ability of a system to prepare, absorb, recover,       1990 and 2010, more considering the floating population. The
and more successfully adapt to an adverse event” (National                northern Yucatan peninsula has been experiencing chronic beach
Research Council, 2012). The resilience concept has been                  erosion at some locations, ascribed to both the degradation of the
addressed from disciplinary and inter-disciplinary perspectives.          dune that protects the coast during storm events and the impact
Differences between the stable equilibrium (i.e., bounce back) and        of coastal structures on the littoral transport (Appendini et al.,
the dynamic equilibrium (i.e., change of state) approaches for            2012). This problem has been exacerbated by sea level rise, which
the study of resilience have been pointed out by Holling (1996).          was of 2.5 mm/year during the second half of the past century
For the study of beach morphology changes due to storms, the              (Zavala-Hidalgo et al., 2010).
dynamic equilibrium approach is more suitable and hence is                   In addition, winter storms, known as Central American Cold-
adopted in the present work.                                              Surge (CACS) or Norte events, associated to the cold-front
    Previous studies have proposed methodologies to assess the            passages occurring in the Gulf of Mexico between October and
beach-dune resistance during extreme events. For instance, the            April (Medina-Gómez and Herrera-Silveira, 2009), are frequently
storms impact scale proposed by Sallenger (2000) correlates the           present in the northern Yucatan Peninsula Coast, with a yearly
dune parameters with the extreme water levels to identify the             average of 22 events (Appendini et al., 2018). Wave conditions
coastal resistance. This approach has been successfully employed          in the study area during Norte events are characterized by NNW
to conduct studies at different costal locations around the               relatively energetic (Hs > 2 m) swell waves (T > 6 s). Storm
world (Stockdon et al., 2007; Medellín et al., 2016; Franklin             surges associated to such events are typically 0.5 m (Rey et al.,
et al., 2018; among many others). Sallenger’s storm impact                2018). On the other hand, less frequent local storms causing wind
assumes a morphological response based on the storm impact                squalls (Turbonadas) are more likely to occur during the spring–
scale (i.e., swash, collision, overwash, or inundation). However,         summer months. Turbonadas drive strong winds and energetic
previous works have pointed out some inconsistencies with field           sea waves (Hs = 2 m and Tp = 3 s), and the associated storm surge
observations. For instance, Cohn et al. (2018) found that the dune        during these events can reach up to 1.0 m. Hurricane landfalls in
can increase during the collision regime, whereas Sallenger (2000)        the northern Yucatan peninsula are not very frequent (only two
predicts erosion. More recently, Dong et al. (2018) introduced            major hurricanes in 32 years), owing to the east-west shoreline
the Coastal Resilience Index (CRI), based on the relationship             orientation facing the Gulf of Mexico to the north (Figure 1A).
between beach/dune morphometrics and storm-induced extreme                Besides, mean wave conditions, associated to sea-breeze events
water levels and beach erosion, which incorporates the role of the        (Torres-Freyermuth et al., 2017), are responsible of a westward

Frontiers in Marine Science | www.frontiersin.org                     2                                   February 2021 | Volume 8 | Article 637205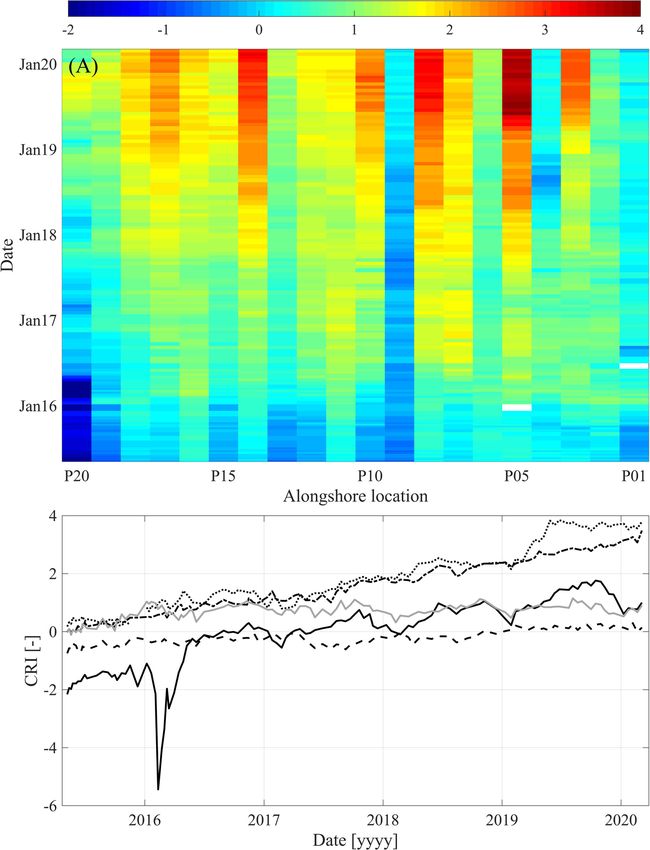
Torres-Freyermuth et al.                                                                                                              Human Impact on Beach Resilience

  FIGURE 1 | Study area location: (A) the Gulf of Mexico; (B) Northern Yucatan coast; (C) Sisal beach. Location of the access roads (R), touristic infrastructure (TI),
  survey lines, and monitoring stations (tidal gauge and meteorological station) are shown in C. Images of the study area showing the existing coastal structures and
  the beach conditions before and during storms for (D,E) a Norte event and (F,G) a local storm. The main anthropogenic disturbances in the study area are: (D) the
  port’s jetty and (F) the pier.

net sediment transport on the order of 30,000–60,000 m3 /year                           have been affected due to the presence of the structures and
(Appendini et al., 2012). These conditions enhance the erosion                          touristic activities that have conducted to the degradation of the
downdrift of coastal structures along that stretch coast (Medellín                      dunes (Figure 1C).
et al., 2018).
    This study is conducted in Sisal beach, located on a barrier                        Field Data
island in the vicinity of the Sisal’s Port and pier (Figure 1C). The                    Beach profiles were measured along 20 equally spaced cross-shore
urbanized area has grown mainly toward the wetlands south of                            transects, encompassing a 2-km straight of coast (Figure 1C).
the barrier, where land reclamation by population is a common                           Beach surveys were undertaken on average every 15 days, with
practice in the region. Furthermore, the beach and foredune                             the highest and lowest temporal resolution of 7 and 30 days,

Frontiers in Marine Science | www.frontiersin.org                                   3                                           February 2021 | Volume 8 | Article 637205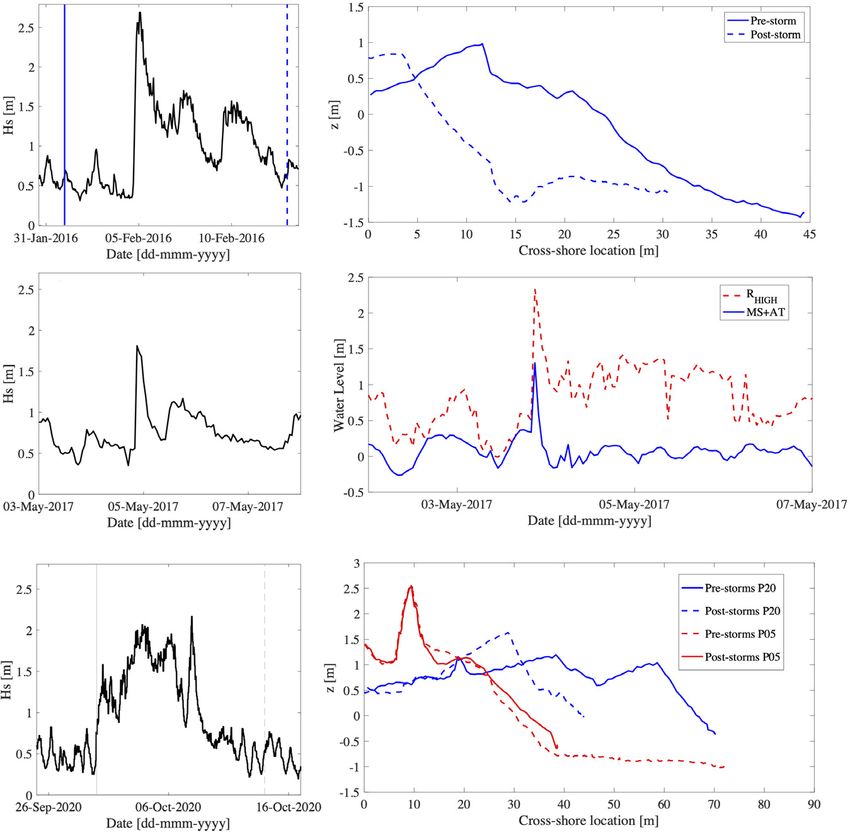
Torres-Freyermuth et al.                                                                                       Human Impact on Beach Resilience

respectively. The beach transects cover from the subaerial               scales, and trajectories (Piégay et al., 2020). We adopt the CRI,
beach to a water depth of approximately 1.5 m. A Differential            proposed by Dong et al. (2018), focused in the beach and dune
Global Positioning System (DGPS) was employed in Real Time               system and its response to storms. A description of each of the
Kinematics (RTK) mode, carrying the rover receiver on a                  required components for its assessment is provided below.
backpack, for undertaking the 116 beach surveys analyzed for
this work. The first and last surveys correspond to 08/05/2015           Morphology Indicators
and 05/03/2020, respectively. Control points are measured at the         Relevant morphologic parameters are used to identify the
beginning and at the end of each survey to measure the antenna           characteristic parameters and assess the spatiotemporal evolution
elevation. Furthermore, a bathymetric profile along transect P05         of the beach-dune system. The protective width PW, protective
(Figure 1C) was measured 10 km offshore till a 10 m water                elevation PE, and the dune crest elevation DE (Figure 2A) were
depth on August 2019 with the aim of propagating the measured            identified following Dong et al. (2018). Both, natural and human
wave conditions to the shore. The measured elevation data are            perturbations are implicitly incorporated in the evolution of the
referenced to the MEX97 geoid1 . Further information on the              morphometric parameters. Each parameter was calculated for
monitoring program and the interannual and seasonal beach                each transect (e.g., Figure 1C) and for all surveys.
variability at this site can be found in Medellín and Torres-               The CRI requires knowledge on characteristic beach
Freyermuth (2019).                                                       morphology parameters PW0 , PE0 , and CF0 , where the dune
   Water levels and offshore wave conditions were measured               crest freeboard CF0 = DE0 − (MS + AT) depends on the MS and
in the study area; the former by means of an ultrasonic                  AT. Here, we estimated the characteristic parameters from the
tide gauge installed inside the port of Sisal (Figure 1C2 ) and          spatial (20 beach transects) and temporal (116 surveys) average
the latter by means of a bottom-mounted Acoustic Doppler                 of the individual morphology parameters (Supplementary
Current Profiler deployed 10 km off the coast at 10 m water              Figures 1, 2).
depth (Figure 1B). Data gaps in the records were filled with
reanalysis information from Wave Watch III3 . Hindcast and               Disturbances and Perturbations
measured data at the ADCP location have an R2 value of 0.79              Coastal disturbances that induce beach/dune morphology
(Medellín and Torres-Freyermuth, 2019).                                  changes can be either natural or anthropogenic, and
                                                                         instantaneous (shocks) or long-lasting (stresses). The response
Model Simulations                                                        of the system to such disturbances (e.g., shoreline and dune
Extreme water levels were estimated by means of numerical                changes) is known as perturbations. In the study site, human
models. A maximum dissimilitude algorithm (e.g., Camus et al.,           disturbances include the presence of coastal structures (jetty
2011a,b; Guanche et al., 2013; Medellín et al., 2016) was employed       and pier) and the degradation of the dune. For instance,
to select 300 representative cases based on the combination of           the port’s jetty (Figure 1D) is responsible of shoreline
the measured mean sea level and offshore wave conditions from            perturbations associated to large progradation rates (7 m
the 4-year dataset. The bathymetry information and the beach             year−1 ) updrift of the jetty. Also, a pier (Figure 1F), located
profile, representative of natural conditions (P05), were employed       1.8 km east from the port, induces beach morphology response
for the model simulations. The selected wave conditions were             on adjacent transects (P01, P02, and P03 in Figure 1C).
propagated from 10 m water depth to the coast by means of                Dune degradation, associated to touristic activities, is also
the coupling of wave transformation (SWAN; Booij et al., 1999)           ubiquitous at some transects (i.e., P01, P02, and P09 in
and hydrodynamic (SWASH; Zijlema et al., 2011) models. The               Figure 1C). All these perturbations are implicitly incorporated
measured or reanalysis wave data provide SWAN with offshore              in the morphometric parameters, with increasing influence
(h = 10 m) wave conditions that were propagated to 4 m water             near the structures.
depth, followed by SWASH model simulations of the nearshore                 Natural disturbances in the study site are often related
wave transformation including wave breaking and wave run-up.             with Norte events, local storms, and less frequent tropical
The run-up time series were further employed to estimate the             storms. To identify the maximum storm-induced shoreline
high water level (RHIGH = WR+MS+AT), which includes the                  recession (MSR), beach width and beach volume differences
elevation due to the runup of 2% of exceedance (WR) for given            between subsequent surveys were computed for the study
values of storm surge (MS) and astronomical tide (AT) elevations         period (Supplementary Figure 3A). The MSR corresponds to
for the simulated cases. This information was employed to                the maximum negative difference between campaigns from all
reconstruct the time series of RHIGH for the 4-year period.              beach transects. On the other hand, tide gauge information
                                                                         and numerical model results were employed to determine the
Assessment of Coastal Resilience                                         extreme water levels. The maximum mean sea level (MS+AT)max
For the study of resilience, it is important to specify both             is obtained from the tidal record. Similarly, the maximum
the system and disturbances of interest (i.e., resilience of what        high water level (RHIGH )max can be extracted from the time
to what) (Carpenter et al., 2001). This allows to identify the           series reconstructed from the numerical model simulations
perturbations (response), the system resistance, threshold values,       (Supplementary Figure 3B).

1
  https://www.ngs.noaa.gov/GEOID/MEXICO97/                               Coastal Resilience Index
2
  http://www.mareografico.unam.mx/                                       Larger beach width, subaerial volume, and dune height
3
  https://polar.ncep.noaa.gov/waves/wavewatch/                           contribute to increase the resilience of beaches to extreme events

Frontiers in Marine Science | www.frontiersin.org                    4                                   February 2021 | Volume 8 | Article 637205
Torres-Freyermuth et al. Human Impact on Beach Resilience
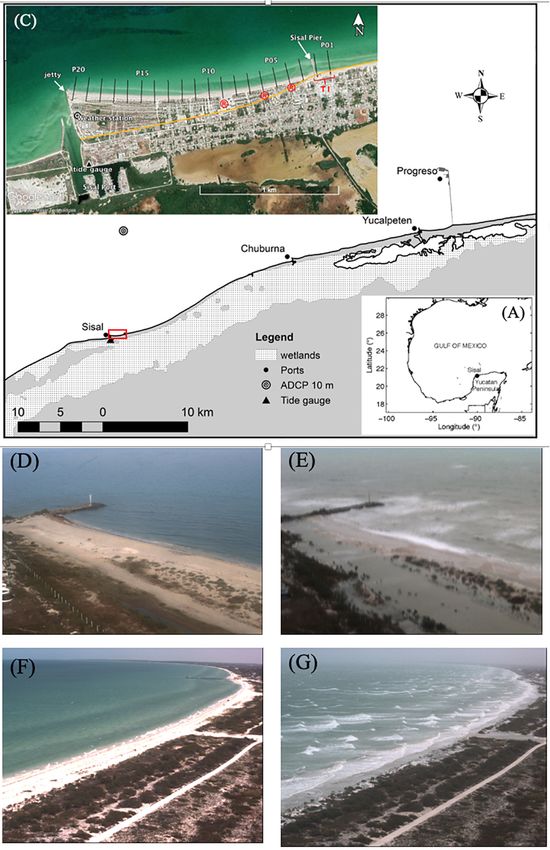
FIGURE 2 | (A) Beach parameters and water levels required to estimate the Coastal Resilience Index according to Dong et al. (2018), spatiotemporal evolution of (B)
protective width, (C) dune elevation, (D) subaerial beach volume, and (E) subaerial beach elevation between May 2015 and March 2020 along a 2-km straight of
coast. Elevation in C and E is referenced to the geoid MEX97.
(Dong et al., 2018). The coastal resilience factors proposed by where a is the protective elevation factor, b is the volume
Dong et al. (2018) are adopted in this work and are defined as, density, c is the protective width factor, d is the crest freeboard
factor, and e is the wave runup factor. The latter (e) has been
PE PE ∗ PW ∗ (1 − s) PW − MSR
a= ;b = ;c = ; modified to make it more consistent with Sallenger’s model
PE0 PE0 ∗ PW0 PW0 and to allow us to investigate the CRI associated to a given
return period. The percentage of fine sediment s is set to 0.2.
DE − (MS + AT)max DE − (RHIGH )max
d= ;e = ; These factors are computed using the morphology parameters
CF0 CF0 and perturbations obtained as described in previous sections.
CRI = a + b + c + d + e Based on the CRI values, Dong et al. (2018) defined the
Frontiers in Marine Science | www.frontiersin.org 5 February 2021 | Volume 8 | Article 637205Torres-Freyermuth et al. Human Impact on Beach Resilience
resilience as low (CRI < 1.5), medium (1.5 < CRI < 2.0), and The spatiotemporal evolution of the beach volume (Figure 2D)
high (CRI > 2). presents a similar behavior than the beach width (Figure 2B).
These two parameters determine the protective elevation PE
(Figure 2E) which is strongly dependent on the DE as noticed
by the similar spatiotemporal evolution.
RESULTS
Morphology Indicators Characteristic Beach-Dune Parameters
High-resolution beach surveys allow us to capture the The temporal average (denoted by . ) and standard deviation
spatiotemporal beach evolution during the 5-year study of each parameter are computed for each transect. The PW and
period along the 2-km stretch of coast. The beach protective its variability increase toward the port’s jetty where largest high
width presents the highest increasing trend at transects located progradation rates occur (Supplementary Figure 2A). On the
near the jetty (P15–P20) (Figure 2B). A net increase in the other hand, central transects, located between the port and the
protective width PW is observed for transects P6–P20, whereas pier, present less variability implying larger stability (e.g., P07) to
more stable conditions are shown at P1 and P3–P5. The beach increase again near the pier. The characteristic protective width
width evolution at P2, located east from the pier, is similar to the PW0 can be estimated by the spatial and temporal average of all
one observed at P20, but with a reduced magnitude. transects, finding a value of PW0 = 38 m which is close to the one
The dune elevation DE shows the larger values away from the observed at central transects.
structures (Figure 2C). The maximum DE growth was observed The PE presents the lower values near the jetty
at P05 (Figure 2C and Supplementary Figure 1C). Significant (Supplementary Figure 2B) as a result of a very wide beach
DE growth is also observed for P03, P07, P08, P10, and P14. with low elevation (no dune). More uniform conditions with
FIGURE 3 | (A) Temporal evolution of significant wave height during a sequence of Norte events. The vertical lines represent the dates of the pre-storm (blue solid
line) and post-storm (blue dashed line) beach surveys. (B) Beach profiles undertaken on 3 February 2016 (solid gray line) and 11 February 2016 (red dashed line).
(C) Temporal evolution of significant wave height during a local storm occurring on 4 May 2017. (D) Temporal evolution of extreme water levels: WR (red dashed line)
simulated using the SWASH model and maximum mean sea level (MS+AT: blue solid line) measured by the tidal gauge. (E) Temporal evolution of significant wave
height during a sequence of tropical storms. The vertical lines represent the dates of the pre-storm and post-storm beach surveys. (F) Beach profiles undertaken on
30 September 2020 (solid line) and 14 October 2020 (dashed line) at cross-shore transects P05 (red) and P20 (blue).
Frontiers in Marine Science | www.frontiersin.org 6 February 2021 | Volume 8 | Article 637205Torres-Freyermuth et al. Human Impact on Beach Resilience similar variability occurred between P01 and P17, except (Supplementary Figure 2B). The DE also shows the lower for P09 located on a heavily impacted beach area that has values near the jetty and the highest values associated to low inhibited the dune recovery (Supplementary Figure 1C). The progradation rates (Supplementary Figure 2C). A characteristic characteristic protective elevation PE0 is estimated to be 0.8 m, dune elevation of DE0 = 2.2 m is employed to determine the which is similar to the mean values of most of the transects characteristic dune crest freeboard CF0 =0.9 m. FIGURE 4 | (A) Spatiotemporal evolution of the Coastal Resilience Index. (B) Time series of the Coastal Resilience Index at transects P02 (solid gray line), P05 (dotted line), P09 (dashed line), P14 (dashed-dotted line), and P20 (black solid line). Frontiers in Marine Science | www.frontiersin.org 7 February 2021 | Volume 8 | Article 637205
Torres-Freyermuth et al.                                                                                           Human Impact on Beach Resilience

Storm Perturbations                                                         with high resilience, the CRI remains low during the study
The maximum storm-induced shoreline recession during the                    period (Figure 4B).
study period corresponds to a Norte storm event that arrived
to the study area on 5 February 2016 (Figure 1E and
Supplementary Figure 3A). The significant wave height at 10 m               DISCUSSION AND CONCLUSION
water depth reached 2.5 m (Figure 3A). The event was followed
by two milder Norte events with maximum Hs = 1.5 m. Beach                   Field observations and numerical model simulations were
profiles conducted before (03/02/2016) and after (11/02/2016)               employed to investigate coastal resilience on a prograding
the storm sequence show that the maximum shoreline recession                beach located on the northwestern Yucatan coast. The results
MSR = 17 m (Figure 3B) occurred at the beach transect located               show an overall increase of the CRI over the past 5 years.
near the Port’s jetty. The associated subaerial beach volume loss           The analysis suggests significant spatial gradients of beach-
at this transect, after the storm sequence, was 15 m3 /m.                   dune morphometrics along the 2-km stretch of coast, and
    Numerical model results and tide gauge data were used to                hence different CRI trajectories were observed. The low DE
identify the maximum mean water (MS+AT) and high water                      growth observed at some locations can be attributed to human
levels (RHIGH ). Both, tide gage measurements and modeling                  impacts such as the influence of the Port’s jetty (P20) and dune
results, show maximum values for the 4th May 2016 storm                     degradation (P09). Thus, low resilience occurs at alongshore
event (Figure 1G and Supplementary Figure 3B). A local storm,               locations impacted by human activities, whereas high resilience
known as Turbonada, was generated by strong winds driving                   is observed at the most preserved cross-shore transects.
energetic waves (Figure 3C) and a large storm surge (Figure 3D).                To validate our results, we employed beach surveys collected
Calm conditions (Hs = 0.5 m) preceded the storm arrival with                after the study period, corresponding to transects P05 and P20
Hs = 1.8 m. The inundation was strongly related with the mean               that were undertaken before and after tropical storms Gamma
sea level increase (MS+AT = 1.3 m) during the peak of the storm.            and Delta (2–12 October 2020) (Figure 3E). The low resilient
Numerical model simulations predicted a (RHIGH )max =2.3 m                  transect P20, located near the jetty, receded more than 20 m
during this event which was responsible of dune overwash                    due to the sequence of storms (Figure 3F) and to the lowest
at some locations (Figure 1G). The maximum values of the                    beach elevation and presence of the jetty (Figures 2C,E). These
measured/simulated water levels and beach erosion (MS+AT,                   observations are consistent with the low CRI (Figure 4) at
RHIGH , and MSR) during the period of the study are employed                this location (CRI < 1). On the other hand, transect P05,
to assess coastal resilience in the study site.                             with a high CRI (CRI > 3), shows small changes during the
                                                                            same period. Hence, the CRI seems to provide a good proxy
                                                                            to predict the beach-dune response during storms. Coastal
Coastal Resilience Trajectories                                             flooding on the barrier island during these events occurred on
Storm perturbations, characteristic beach-dune parameters, and              the wetlands border due to the heavy rain and saturated water
morphometrics evolution allow us to estimate trajectories of                table, emphasizing the need to investigate the resilience across
the CRI. Supplementary Figure 4 shows the spatiotemporal                    the barrier island.
evolution of the different factors that contribute to coastal                   The present study highlights the important role of beach-
resilience. The protective elevation factor a, crest freeboard factor       dune conservation for beach resilience. The beach evolution
d, and wave runup factor e show lower values in the vicinity                toward a more resilient state was observed at beach transects
of coastal structures and at the degraded dune transects (e.g.,             with low human impact. The alongshore location with the largest
P09). On the other hand, the volume density and protective width            protective width PW, associated to sediment impoundment, was
factors present higher values east (updrift) from the jetty and             significantly less resilient than those transects with high dune
groin. The crest freeboard and wave run-up factors are strongly             elevation DE, low human impact, and low progradation rates.
dependent on the dune elevation and control the CRI.                        This demonstrates the important role of dune conservation for
   The CRI, obtained by the summation of the five factors, shows            building resilient coasts on this region.
significant spatiotemporal differences (Figure 4). In general,                  Future work should be devoted to improving the CRI. For
high CRI values are located at the mid-transects away from                  instance, additional aspects such as the presence of submerged
the structures (Figure 4A). The differences in the temporal                 coastal ecosystems (seagrass and coral reefs) or submerged
evolution can be seen more clearly at selected alongshore                   morphology features (sand bars) play an important role on wave
locations (Figure 4B). The time series of the CRI from all                  energy dissipation and must be incorporated. Another drawback
selected transects started with negative values of CRI due to the           in the current CRI is that, like in other coastal vulnerability
absence of a dune at the beginning of the monitoring program.               models (e.g., Gornitz, 1990; Sallenger, 2000; among many others),
The resilience increases as the foredune and beach grow at                  it does not incorporate the socio-economic aspects and the strong
each transect partially due to beach progradation. Transect P05,            interaction between the large confined aquifer and the coastal
presenting a high dune growth (Supplementary Figure 1C),                    ocean, which are fundamental for a more integral study of
shows a sustained CRI increase despite the low progradation                 coastal resilience. Thus, future efforts should also be devoted to
rate (Supplementary Figure 1A). Near the jetty (P20) and the                integrate ecological and socio-economic components to quantify
pier (P01–02), the CRI presents low values despite the net                  the coastal resilience. Finally, the present work shows the
increase in the PW (Supplementary Figure 1A). At the transect               importance of high spatial and temporal resolution data to assess
with the most degraded dune (P09), surrounded by transects                  the CRI trajectories at a local scale. However, extending this study

Frontiers in Marine Science | www.frontiersin.org                       8                                    February 2021 | Volume 8 | Article 637205
Torres-Freyermuth et al. Human Impact on Beach Resilience
to a regional scale requires the use of remote sensing information, (Project 284819), Cátedras Program (Project 1146 Observatorio
for the derivation of digital elevation models (Almeida et al., Costero para estudios de resiliencia ante el cambio climático),
2019) and the assessment of water levels and wave conditions, in Laboratorios Nacionales Program (Project LN 271544), and
combination with numerical models. Infraestructura Program (INFR-2014-01-225561). Financial
support for open access publication was provided by Universidad
Nacional Autónoma de Mexico through PAPIIT DGAPA
DATA AVAILABILITY STATEMENT (Project IN101218).
The raw data supporting the conclusions of this article will be
made available by the authors, without undue reservation. ACKNOWLEDGMENTS
Technical field support was provided by José López González
AUTHOR CONTRIBUTIONS and Juan Alberto Gómez Liera (ADCP data collection and
bathymetric profile), and IT support by Gonzalo Uriel Martín
AT-F conceived the study, assisted in some of the field data Ruiz. Tidal data were provided by the National Tidal Service
collection, and wrote the first draft. GM conducted all the (Servicio Mareográfico Nacional). We acknowledge NOAA for
topographic surveys and data analysis, conducted the numerical making WWIII wave hindcast data available. Two reviewers
model simulations, and assisted in discussion and writing. provided valuable comments that helped to substantially
PS assisted with the discussion, analysis of the results, and improve the manuscript. Finally, we thank Delft University of
writing. All authors contributed to the article and approved the Technology for making the development of SWAN and SWASH
submitted version. models possible.
FUNDING SUPPLEMENTARY MATERIAL
We thank PAPIIT DGAPA-UNAM (Project IN101218) and The Supplementary Material for this article can be found
Consejo Nacional de Ciencia y Tecnologia (Mexico) for online at: https://www.frontiersin.org/articles/10.3389/fmars.
financial support through Investigación Científica Básica 2021.637205/full#supplementary-material
REFERENCES Durán, O., and Moore, L. J. (2013). Vegetation controls maximum foredune size.
Proc. Natl. Acad. Sci. U.S.A. 110, 17217–17222. doi: 10.1073/pnas.1307580110
Almeida, L. P., Almar, R., Bergsma, E., Berthier, E., Baptista, P., Garel, E., et al. Feagin, R. A., Furman, M., Salgado, K., Martinez, M. L., Innocenti, R. A., Eubanks,
(2019). Deriving high spatial-resolution coastal topography from sub-meter K., et al. (2019). The role of beach and sand dune vegetation in mediating wave
statellite stereo imagery. Remote Sens. 11:590. doi: 10.3390/rs11050590 run up erosion. Estuar. Coast. Shelf Sci. 219, 97–106. doi: 10.1016/j.ecss.2019.
Appendini, C. M., Hernández-Lasheras, J., Meza-Padilla, R., and Kurczyn, J. A. 01.018
(2018). Effect of climate change on wind waves generated by anticylocinic Franklin, G. L., Torres-Freyermuth, A., Medellin, G., Allende-Arandia, M. E., and
cold front intrusions in the Gulf of Mexico. Clim. Dyn. 51, 3747–3763. doi: Appendini, C. M. (2018). The role of the reef-dune system in coastal protection
10.1007/s00382-018-4108-4 in Puerto Morelos (Mexico). Nat. Hazards Earth Syst. Sci. 18, 1247–1260. doi:
Appendini, C. M., Salles, P., Mendoza, E. T., López, J., and Torres-Freyermuth, A. 10.5194/nhess-18-1247-2018
(2012). Longshore sediment transport on the Northern Coast of the Yucantan Gornitz, V. (1990). Vulnerability of the East Coast, U.S.A. to future sea level rise.
Peninsula. J. Coast. Res. 28, 1404–1417. doi: 10.2112/jcoastres-d-11-00162.1 J. Coast. Res. Special Issue No. 9, 201–237.
Aubrey, D. G. (1979). Seasonal patterns of onshore/offshore sediment movement. Guanche, Y., Camus, P., Guanche, R., Mendez, F. J., and Medina, R. (2013). A
J. Geophys. Res. 84 6347–6354. doi: 10.1029/jc084ic10p06347 simplified method to downscale wave dynamics on vertical breakwaters. Coast.
Booij, N., Ris, R. C., and Holthuijsen, L. H. (1999). A third generation wave model Eng. 71, 68–77. doi: 10.1016/j.coastaleng.2012.08.001
for coastal regions; part 1: model description and validation. J. Geophys. Res. Hoefel, F., and Elgar, S. (2003). Wave-induced sediment transport and
104, 7649–7666. doi: 10.1029/98jc02622 sandbar migration. Science 299, 1885–1887. doi: 10.1126/science.10
Camus, P., Mendez, F. J., and Medina, R. (2011a). A hybrid efficient method to 81448
downscale wave climate to coastal areas. Coast. Eng. 58, 851–862. doi: 10.1016/ Holling, C. S. (1996). “Engineering resilience versus ecological resilience,” in
j.coastaleng.2011.05.007 Engineering within Ecological Constraints, ed. P. Schulze (Washington, DC:
Camus, P., Mendez, F. J., Medina, R., and Cofiño, A. S. (2011b). Analysis of National Academy of Engineering), 31–44.
clustering and selection algorithms for the study of multivariate wave climate. Masselink, G., and Lazarus, E. D. (2019). Defining coastal resilience. Water 11:2587.
Coast. Eng. 58, 453–462. doi: 10.1016/j.coastaleng.2011.02.003 doi: 10.3390/w11122587
Carpenter, S., Walker, B., Anderies, J. M., and Abel, N. (2001). From metaphor Medellín, G., Brinkkemper, J., Torres-Freyermuth, A., Appendini, C. M., Mendoza,
to measure: resilience of what to what? Ecosystems 4, 765–781. doi: 10.1007/ T., and Salles, P. (2016). Runup parameterization and beach vulnerability
s10021-001-0045-9 assessment on a barrier island: a downscaling approach. Nat. Hazards Earth
Cohn, N., Ruggiero, P., de Vries, S., and Kaminsky, G. M. (2018). New insights Syst. Sci. 16, 167–180. doi: 10.5194/nhess-16-167-2016
on coastal foredune growth: the relative contributions of marine and aeolian Medellín, G., and Torres-Freyermuth, A. (2019). Morphodynamics along a micro-
processes. Geophys. Res. Lett. 45, 4965–4973. doi: 10.1029/2018gl077836 Tidal sea breeze dominated beach in the vicinity of coastal structures. Mar. Geol.
Dong, Z., Elko, N., Robertson, Q., and Rosati, J. (2018). Quantifying beach and 417:106013. doi: 10.1016/j.margeo.2019.106013
dune resilience using the coastal resilience index. Coast. Eng. Proc. 1:papers.30. Medellín, G., Torres-Freyermuth, A., Tomasicchio, G. R. , Francone, A. ,
doi: 10.9753/icce.v36.papers.30 Tereszkiewicz, P. A., Lusito, L., et al. (2018). Field and numerical study of
Frontiers in Marine Science | www.frontiersin.org 9 February 2021 | Volume 8 | Article 637205Torres-Freyermuth et al. Human Impact on Beach Resilience
resistance and resilience on a sea breeze dominated beach in Yucatan (Mexico). Stockdon, H. F., Sallenger, A. H. Jr., Holman, R. A., and Howd, P. A. (2007). A
Water 10:1806. doi: 10.3390/w10121806 simple model for the spatially-variable coastal response to hurricanes. Mar.
Medina-Gómez, I., and Herrera-Silveira, J. (2009). Seasonal responses of Geol. 238, 1–20. doi: 10.1016/j.margeo.2006.11.004
phytoplankton productivity to water-quality variations in a Coastal Karst Torres-Freyermuth, A., Puleo, J. A., DiCosmo, N., Allende-Arandia, M. E.,
Ecosystem of the Yucatan Peninsula. Gulf Mex. Sci. 27, 39–51. Chardon-Maldonado, P., Lopez, J., et al. (2017). Nearshore circulation on a sea
Narayan, S., Beck, M. W., Reguero, B. G., Losada, I. J., van Wesenbeeck, B., Pontee breeze dominated beach during intense wind events. Cont. Shelf Res. 151, 40–52.
Sanchirico, J. N., et al. (2016). The effectiveness, costs and coastal protection doi: 10.1016/j.csr.2017.10.008
benefits of natural and nature-based defences. PLoS One 11:e0154735. doi: Wong, P. P., Losada, I. J., Gattuso, J.-P., Hinkel, J., Khattabi, A., McInnes,
10.1371/journal.pone.0154735 K. L., et al. (2014). “Coastal systems and low-lying areas,” in Climate Change
National Research Council (2012). Disaster Resilience: A National Imperative. 2014: Impacts, Adaptation, and Vulnerability, Part A: Global and Sectoral
Washington, DC: The National Academies Press. doi: 10.17226/13457 Aspects, Contribution of Working Group II to the Fifth Assessment Report of
Neumann, B., Vafeidis, A. T., Zimmermann, J., and Nicholls, R. J. (2015). Future the Intergovernmental Panel on Climate Change, eds C. B. Field, V. Barros,
coastal population growth and exposure to sea-level rise and coastal flooding – D. Dokken, K. Mach, M. Mastrandrea, T. Bilir, et al. (Cambridge: Cambridge
a global assessment. PLoS One 10:e0118571. doi: 10.1371/journal.pone.011 University Press), 361–409.
8571 Zavala-Hidalgo, J., de Buen Kalman, R., Romero-Centeno, R., and Hernández
Nicholls, R. J., Hanson, S. E., Lowe, J. A., Warrick, R. A., Lu, X., and Long, A. J. Maguey, F. (2010). “Tendencias del nivel del mar en las costas mexicanas,” in
(2014). Sea-level scenarios for evaluating coastal impacts. WIREs Clim. Change Vulnerabilidad de las zonas costeras mexicanas ante el cambio climático, eds
5, 129–150. doi: 10.1002/wcc.253 A. V. Botello, S. Villanueva-Fragoso, J. Gutiérrez, and Y. J. L. Rojas Galaviz
Pendleton, L., Donato, D. C., Murray, B. C., Crooks, S., Jenkins, W. A., Sifleet, (Campeche: UNAM-ICMYL Universidad Autónoma de Campeche), 249–268.
S., et al. (2012). Estimating global blue carbon emissions from conversion and Zijlema, M., Stelling, G., and Smit, P. (2011). SWASH: an operational public
degradation of vegetated coastal ecosystems. PLoS One 7:e43542. doi: 10.1371/ domain code for simulating wave fields and rapidly varied flows in coastal
journal.pone.0043542 waters. Coast. Eng. 58, 992–1012. doi: 10.1016/j.coastaleng.2011.05.015
Piégay, H., Chabot, A., and Le Lay, Y.-F. (2020). Some comments about
resilience: from ciclicity to trajectory, a shift in living and nonliving Conflict of Interest: The authors declare that the research was conducted in the
sytem theory. Geomorphology 367:106527. doi: 10.1016/j.geomorph.2018. absence of any commercial or financial relationships that could be construed as a
09.018 potential conflict of interest.
Rey, W., Salles, P., Mendoza, E. T., Torres-Freyermuth, A., and Appendini, C. M.
(2018). Assesssment of coastal flooding and associated hydrodynamic processes Copyright © 2021 Torres-Freyermuth, Medellín and Salles. This is an open-access
on the south-eastern coast of Mexico, during Central American cold surge article distributed under the terms of the Creative Commons Attribution License
events. Nat. Hazards Earth Syst. Sci. 18, 1681-1701. doi: 10.5194/nhess-18-1681- (CC BY). The use, distribution or reproduction in other forums is permitted, provided
2018 the original author(s) and the copyright owner(s) are credited and that the original
Sallenger, A. H. (2000). Storm impact scale for barrier islands. J. Coast. Res. 16, publication in this journal is cited, in accordance with accepted academic practice. No
890–895. use, distribution or reproduction is permitted which does not comply with these terms.
Frontiers in Marine Science | www.frontiersin.org 10 February 2021 | Volume 8 | Article 637205You can also read