ICAR-Central Agroforestry Research Institute Jhansi-284 003 (U.P.) - ISO 9001:2015
←
→
Page content transcription
If your browser does not render page correctly, please read the page content below
Technical Bulletin 2/2018

                ISO 9001:2015
ICAR-Central Agroforestry Research Institute
           Jhansi-284 003 (U.P.)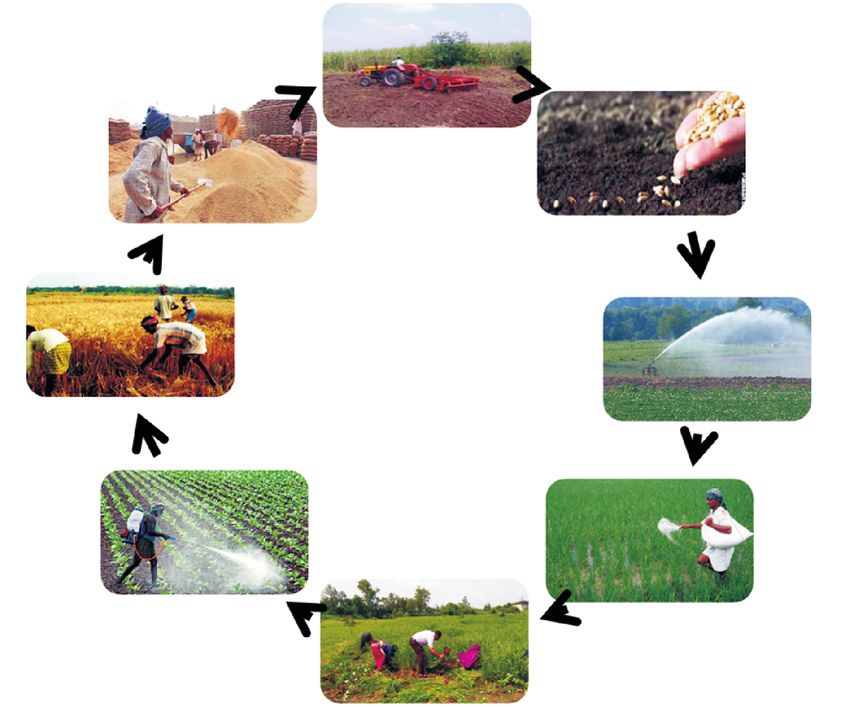

Technical Bulletin 2/2018

                ISO 9001:2015
ICAR-Central Agroforestry Research Institute
           Jhansi-284 003 (U.P.)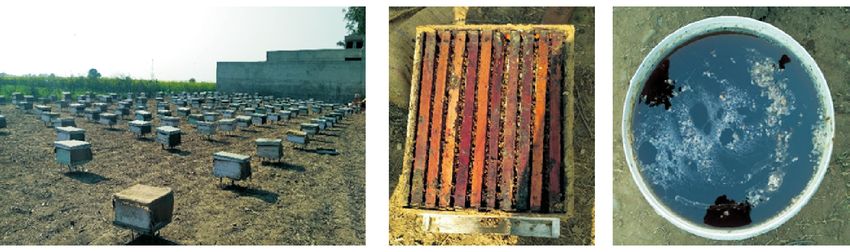
This Technical Bulletin is based on the impact generated by interventions of various
projects implemented by the Indian Council of Agricultural Research-Central
Agroforestry Research Institute (ICAR-CAFRI), Jhansi since its inception. Along with
a range of information from various published, unpublished literature, reports,
documents, and web-resources.
Disclaimer
The results of this bulletin are based on the data obtained from various sources for which
authors and the Institute are not responsible. The opinions expressed in this bulletin are
suggestive. The views expressed in this bulletin are those of the authors and do not
necessarily reflect the views of ICAR-CAFRI, Jhansi, Uttar Pradesh, India.

Guidance
Dr. Anil Kumar, Director, ICAR-CAFRI, Jhansi.
Dr. O. P. Chaturvedi, Ex-Director, ICAR-CAFRI, Jhansi.

Contributors
Dr. Mahendra Singh, Principal Scientist (Agricultural Economics)
Dr. K.B. Sridhar, Scientist (Forestry)
Dr. Dhiraj Kumar, Scientist (Soil Science)
Dr. R.K. Tewari, Principal Scientist (Fruit Science)
Dr. Inder Dev, Principal Scientist (Agronomy)
Dr. Asha Ram, Scientist (Agronomy)
Sh. A.R. Uthappa, Scientist (Forestry)
Dr. Veeresh Kumar, Scientist (Entomology)
Dr. Ramesh Singh, Principal Scientist (Soil and Water Conservation Engineering)
Dr. Raghunandan Prasad Dwivedi, Principal Scientist (Agricultural Extension)

Recommended citation
Singh, M., K.B. Sridhar, Dhiraj Kumar, R.K. Tewari, Inder Dev, Asha Ram, A.R. Uthappa,
Veeresh Kumar, Ramesh Singh and R.P. Dwivedi (2018). Options and Strategies for
Farmers' Income Enhancement in Bundelkhand Region of Central India. Technical
Bulletin No.2/2018. ICAR-Central Agroforestry Research Institute (CAFRI), Jhansi,
India. pp. 50.

Acknowledgement
The authors have benefitted immensely from the valuable comments and suggestions of the
learned experts in preparation of this technical bulletin. Authors are also grateful to farmers
for sharing their experiences. However, the authors own any errors that remain in the paper.

Cover illustrations
The photos in the centre symbolizes Bundelkhand farmers. Photos to the left represents
farmers' friendly schemes and right indicates the cost effective technologies for
enhancing farmers' income.

Cover Designed by
K.B. Sridhar, Dhiraj Kumar, Mahendra Singh and Rajesh Srivastava.
Printed at
Darpan Printers & Lamination
Agra
Foreword

Indian Council of Agricultural Research under the aegis of Ministry of Agriculture and
Farmers Welfare, Government of India, has developed various region specific
technologies and imparts quality education in agriculture for aspiring professionals
through deemed Institutes and various State Agricultural Universities (SAUs) across the
country. The council under its subject matter 'Natural Resource Management (NRM)'
Division promotes sustainable management of natural resources for achieving food,
nutritional, environmental and livelihood security in the country.
The technical bulletin on 'Options and Strategies for Farmers' Income Enhancement in
Bundelkhand Region of Central India' has been prepared by ICAR-Central Agroforestry
Research Institute, Jhansi (U.P.), India, based on the credible research carried out by the
Institute for the last three decades. The institute has thrived hard in bringing back the
trees into agriculture landscapes, also brought millions of hectares of land under
agroforestry and disseminating agroforestry technology throughout the country,
particularly in Bundelkhand region of Central India.
This technical bulletin highlights the existing available resources for agricultural
development and income enhancement along with suggestions for appropriate adoption
of technologies according to specific condition of the farmers in Bundelkhand region.
The selected success stories based on the impact of our Institute's technologies adopted
by farmers especially in Bundelkhand region, have been incorporated in the text.
I am grateful to Dr. T. Mohapatra, Secretary, Department of Agriculture Research and
Education (DARE), Government of India and Director General, ICAR for his valuable
guidance and suggestions.
This document emphasizes on the enhancement of farmers' income through adoption of
various cost effective technologies and implementation of farmers' friendly schemes. It
is open to suggestions and critics by the peer and public for its further improvement.

                                                                         (Anil Kumar)
            th                                                             Director (A)
Dated the 4 May, 2018                                               ICAR CAFRI, Jhansi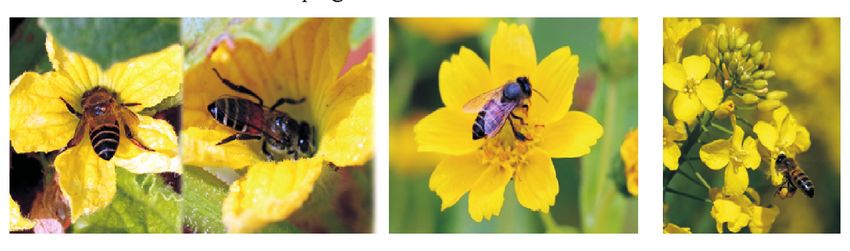
Contents

Particular                                                     Page No.
List of Tables
List of Figures
Executive Summary
1.    Introduction                                                   1
2.    Bundelkhand region                                             3
3.    Situation of farmers in the region                             4
4.    Resource availability in the region                            8
5.    Strategy for income enhancement                               20
6.    ICAR-CAFRI’s role in the region for income enhancement        43
7.    Conclusions and recommendations                               47
8.    References                                                    48
List of Acronyms
List of Tables

Table No.   Title                                                         Page No.

1a & 1b     Average monthly income of agricultural household for                5
            each class of land possessed in Madhya Pradesh and
            Uttar Pradesh, India, 2012-13.

2           Average value of various category of asset and cash loan            6
            outstanding with rural household in state of Uttar Pradesh,
            Madhya Pradesh, India on 30th June, 2012

3           Status of marketing and farm friendly reforms in state of           7
            Madhya Pradesh, Uttar Pradesh, India, October, 2016

4           District-wise share of various land resources in Bundelkhand        8
            region, 2014-15

5           District-wise share of various category of farm holding in          9
            Bundelkhand region, 2010-11

6           District-wise average size of holding in Bundelkhand               10
            region, 2010-11

7           District-wise groundwater situation in Bundelkhand                 11
            region, 2011

8           District-wise irrigation availability situation in Bundelkhand     12
            region, 2013-14

9           Prioritization of districts on the basis of Natural Resources      13
            Index (NRI), Integrated Livelihood Index (ILI) and Rainfed
            Area Prioritization Index (RAPI) in Bundelkhand region, 2012

10          District-wise Milk Production Potential in Bundelkhand             14
            region, 2012

11          The soil fertility status of different districts of UP             14
            Bundelkhand region

12          The soil fertility status of different districts of MP             15
            Bundelkhand region

13          District-wise cropping pattern in Bundelkhand region of            16
            Uttar Pradesh, 2014-15

14          District-wise cropping pattern in Bundelkhand region of            17
            Madhya Pradesh, 2013-14

15          Share of animals in total livestock in various districts of        18
            Bundelkhand region, India, 2012

                                        1
16   Number of animals rearing by per household in various       18
     districts of Bundelkhand region, India, 2012

17   Comparison of existing status and suggested plan for        21
     various categories of farmers in Bundelkhand region
     under rainfed condition

18   Comparison of existing status and suggested plan for        23
     various categories of farmers in Bundelkhand region
     under irrigated condition

19   Best management practices for kharif crops in Bundelkhand   26
     region

20   Best management practices for rabi crops in Bundelkhand     29
     region

21   Increase in yield from insect pollination (%)               36

22   Economics of Bee keeping under Mustard cropping system      37
     in Bundelkhand region

23   Costs and returns from goat rearing in Rajasthan            37
24   Key decision points impacted by climate information         41

                               1
List of Figures
Figure No. Title Page No.
1 Location map of Bundelkhand region in Central India 3
2 Management practices for crop production 25
3 Income generation model advocated by the Prime Minister 35
4 Integrated farming system model -II 35
5 Bees pollinating crops 36
6 Bee hives and its honey 37
7 Deriving livelihood through Dona pattal 38
8 Existing expenditure and income of farmer from two cropping 39
seasons - Rabi and Kharif at Village Parasai, Jhansi
9 Deriving livelihood through lac cultivation 40
10 Effective dissemination of weather forecasting through ICT. 41
11 Marketing of agricultural produce 42
1Executive Summary Indian farming is changing rapidly and significant shifts in the combination and productivity of resources used in farming have been important aspects of transformation of agriculture sector. The substitution of capital goods incorporating new technologies for labour has been a central point of this change. The substitution of capital goods for labour has been supported by the opportunity for rural people to migrate to urban areas and be better off if they had stayed in rural areas. However, incentives to substitute capital inputs for labour have been decelerating and new generation of problems such as groundwater pollution due to over use of fertilizers and pesticides, air pollution and smog formation due to burning of wheat and rice straw, development of resistance in insect pests against existing pesticides, volatility of agricultural produce especially high value commodities (HVCs), etc., which led to increase in risk for operation of agriculture. These complicated problems are responsible for distress of the farmers and affect their income adversely. Keeping in view, Government of India has included various new farmers' friendly schemes since 2016-17 and set target of 'Doubling farmers' income by 2022-23'. It is common parlance that, the synergistic relationship between farmers' friendly policies and economic viable technologies are necessary to achieve this challenging target set within due course of time. In fact, there is diversity in the context of agro-climate and farmers' resource endowments, which require specific suggestions. Bundelkhand region of central India, which falls under Central Plateau and Hills Agro- climatic region is amongst the most degraded ecosystem and the socio-economic status of the people is below the state and national average. Out of 13 districts of this region, three districts namely, Damoh, Chhatarpur and Chitrakoot have been selected under 'Transformation of aspirational districts' for their holistic development by NITI Aayog. This bulletin has been divided into four parts namely, situation assessment of the farmers; resource endowments; strategies for enhancement of farmers' income; and some success stories in the region due to technological interventions of our Institute. Our findings show that there is huge difference in the context of source of income according to land holding size of household. The status of availably of natural resources are also varied among the districts within the region. Therefore, specific suggestions are given for different farmers as per their resource endowments in the region. The success stories can play the role of search-light and may encourage the farmers to adopt tested technologies in the region. To enhance the income of farmers specifically small and marginal there is need to integrate all the available scarce natural resources along with government policy towards agriculture development and region specific economically viable technology should be integrated in a holistic way.
1. Introduction
Sustainable Development Goals (SDGs) are search-light for optimum utilization of
available resources to achieve over-all socio-economic development of any country.
There are 17 SDGs with 169 targets, which are inter-dependent and their full impact
cannot be achieved in isolation. The goal two of SDGs envisage “End hunger, achieve
food security and improve nutrition and promote sustainable agriculture” and its target
2.3 clearly indicates that “By 2030, the agricultural productivity and incomes of small-
scale food producers, particularly by women, indigenous people, family farmers,
pastoralists and fishers” is to be doubled.
The National Commission for Farmers has submitted its fifth and final report entitled
“Serving Farmers and Saving Farming” in the year 2006 and recommended that, to
improve the economic viability of farming by ensuring that farmers earn a minimum net
income and agricultural progress is measured by the advance made in improving that
income.
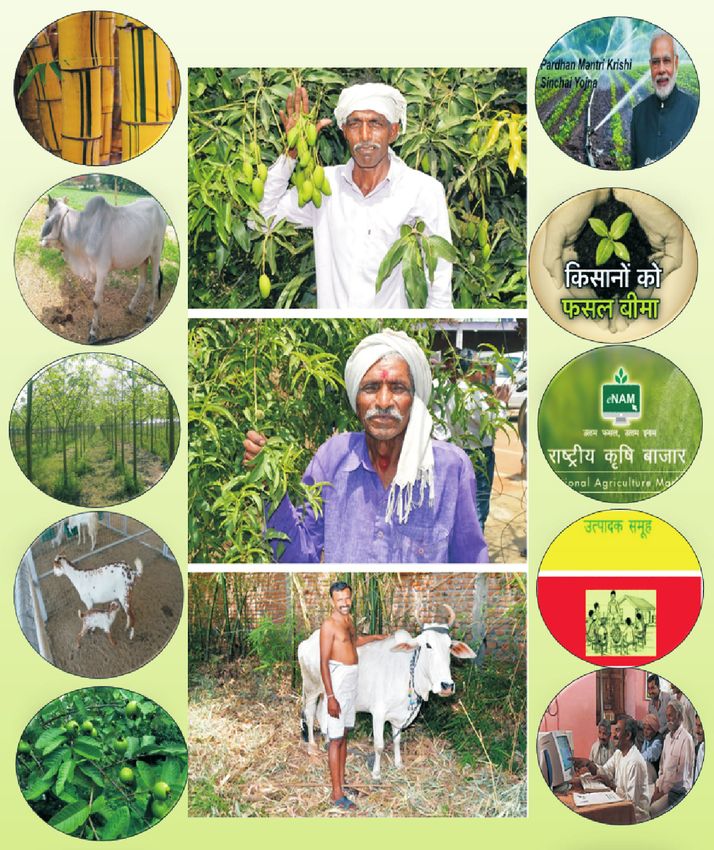
Keeping in view, the Hon'ble Prime Minister shared his commitment of doubling
farmers' income at his Bareilly address on 28th February, 2016. Further, the Government
of India has included various new farmers' friendly schemes in the budget 2016-17 and
set target of “Doubling Farmers' Income by 2022-23” before eight years fixed by United
Nations Organization (UNO). The Pradhan Mantri Krishi Sinchayee Yojana (PMKSY),
Soil Health Card, Pradhan Mantri Fasal Bima Yojana (PMFBY), National Agriculture
Market (e-NAM), Paramparagat Krishi Vikas Yojana (PKVY), Sub-Mission on
Agroforestry (SMAF) under National Mission for Sustainable Agriculture (NMSA) and
Mahila Kisan Sashaktikaran Pariyojana (MKSP) are the important schemes launched to
achieve the target set by Government of India.
Past strategies for development of agriculture sector in India has focused primarily on
raising agricultural output and improving food security. However, those strategies did
not explicitly recognize the need to raise farmers' income and did not mention any direct
measure to promote farmers welfare (Chand, 2016).Agriculture growth has special
powers in reducing poverty and Gross Domestic Product (GDP) growth originating in
agriculture, at least twice as effective in reducing poverty as GDP growth originating
outside agriculture (WDR, 2008).
The agriculture and allied sector continues to be important for the sustainable
development despite its declining share in GDP, which is a natural phenomenon of a
developing country like us. However, in despite of deceleration in its share in the
national income, the share in employment decreased only from 58.2 to 54.6% and
cultivators from 54.4 to 45.1%, while share of agricultural labourers increased from 45.6
to 54.6% in during 2001 to 2011 in Indian agriculture. This reciprocal change in the share
between cultivators and agricultural labourers clearly indicate that about 10% of
cultivators converted into agricultural labourers during last decade which might be due
to decline in the size of land holdings. The other challenges before Indian agriculture are
declining quantity and quality of natural resources (especially soil and groundwater and
1deceleration in growth rate of Total Factor Productivity (TFP), higher price volatility of
farmers produce (especially High Value Commodities (HVCs) like fruits and
vegetables) and frequent adverse impact of climate variability.
Low income of farmers and its fluctuations causing detrimental effect on activities
related to backward and forward linkage with agriculture sector. The important socio-
economic impact of unattractive image of agriculture sector on distress migration and
increase in slum population in urban areas along with it can cause adverse effect on
development of this sector in future also.
There are inadequate studies on income estimates of farmers at both micro and macro
level in India. Few seminal studies (Chand, et al., 2015; Chandrasekhar & Malhotra,
2016; Satyasai & Bharti, 2016 and Satyasai, 2016) are available based on large sample
survey namely 'Situation Assessment Survey of Agricultural Households' conducted by
th th
National sample Survey office (NSSO) during 2003 (59 round) and 2013(70 round).
th
However, the definition of farmer was different in both survey. In 59 round, farmer was
defined as a person who possessed and operated some land and was engaged in
agricultural activities, however, in 70th round, the possession of land an eligibility
criterion of a farmer was dropped and any significant agricultural activity can be carried
out without possessing of any land included.
Chand et al. (2015) suggested that 'decent growth in farm income require high growth in
output, favorable farm produce prices and some cultivators moving out of agriculture'.
Satyasai (2016) reported that doubling the real income of the farmers within six years is a
challenging task and suggested that strategies should address enhancing returns and
reducing costs and making the income sustainable keeping in view the natural resource
base and emphasized on need of time-series reliable data on income of the farmers.
Food and Agriculture Organization (FAO, 2016) in a working paper on 'Can
smallholders double their productivity and incomes by 2030?' concluded that 'During
past 51 years (between 1961 and 2012) the overall land or labour productivity doubled
on average worldwide'. Study suggested that findings should be complemented through
further research using micro data from farm and household surveys and potential for
raising smallholder productivity and incomes and the transformation of agriculture and
rural economies more broadly.
FAO (2015) conducted a study on: The economic lives of smallholder farmers: an
analysis based on household data from nine countries. Study concluded that 'Across all
countries, smallholders rely less on crop and livestock production for their income as
compared with other farmers. Households in the highest quarter of the farm size
distribution (the 25 % of farmers with the larger farms in data or the 4th quartile) derive a
higher share of their income from crop and livestock production than those at the bottom
quarter of the farm size distribution (the 1st quartile).
Keeping in view the problems associated with the farmers in Bundelkhand region, this
policy paper focuses on following specific objectives:
a) Situation assessment of farmers;
b) Resource availability for production of agriculture; and
c) Strategies for enhancement of farmers' income.
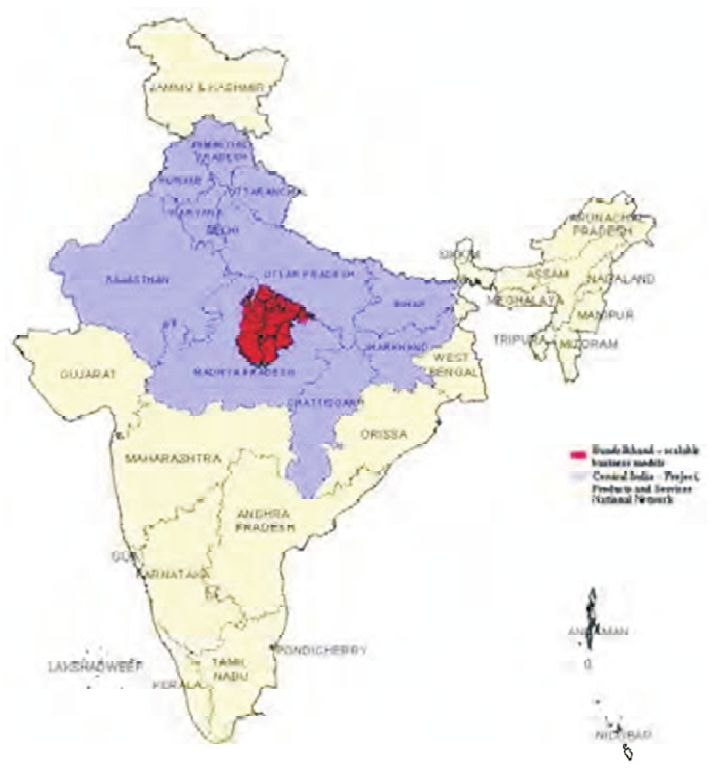
22. Bundelkhand Region
The Bundelkhand region, located in Central Bundelkhand Region of India
India encompassing seven districts of Uttar
Pradesh viz. Banda, Chitrakoot, Hamirpur,
Jalaun, Jhansi, Lalitpur and Mahoba and six
districts of Madhya Pradesh viz. Chhatarpur,
Datia, Damoh, Panna, Sagar and Tikamgarh
(Fig 1). The region falls under Central
Plateau and Hills Agro-climatic Region.
This region is amongst the most degraded
ecosystems characterized by undulating and
rugged topography, highly eroded and
dissected land, poor soil fertility and low
water holding capacity and scarce ground
water resources. The 56% area of
Bundelkhand region comes under the red
soil (Alfisols and Entisols), which is
characterized by coarse gravelly and light Bundelkhand Region Map
textured with poor water holding capacity.
Therefore, establishment of woody
perennials is very difficult without soil and
water conservation measures, particularly in
red soils of the region. Remaining 44% area
comes under black soil which is low lying
and suffers from inadequate drainage,
cracking and shrinking, and thus gives
narrow time for soil working. Figure 1: Location map of Bundelkhand
region in Central India
33. Situation of farmers in Bundelkhand region
The average monthly income from different sources per agricultural household in the
state of Madhya Pradesh and Uttar Pradesh for the agricultural year July 2012 to June
2013 for each size class of land possessed are depicted in Table1a & 1b. In the state of
Madhya Pradesh about 77 per cent of monthly income contributed by farm business
(cultivation and farming of animals) and about 23 per cent generated by income from
wage/salary employment and non-farm income. Percentage share of income from
farming of animals decreased with increase in land possession, however, this statement
is not applicable with land size classes1.01-2.00, 2.01-4.00 and 4.01-10.00 ha. Net
receipt from non-farm business also decrease with increase in land possession except
land size class 4.01-10.00 ha might be due to custom hiring of their farm machineries
especially tractors. Income from wages/salary also followed same pattern due to better
employment opportunities in service sector. The average monthly income from different
sources of agricultural household in state of Uttar Pradesh shows that the average
monthly income for all category of agricultural household was estimated as ₹4929. Out
of which about 69 percent of monthly income contributed by farm business (cultivation
and farming of animals) and about 21 percent generated by income from wage/salary
employment and non-farm income. There was positive correlation between share of
income from cultivation and size of land possession. The share of income from farming
of animals' decrease with increase in land possession, however, this statement is not
applicable with land size class 4.01-10.00 ha. Net receipt from non-farm business also
decrease with increase in land possession except land size class 1.01-2.00 ha. Income
from wages/salary also followed same pattern as land possession increases income from
this source except land size class with more than 10.00 ha, might be due to better
employment opportunities in service sector.
In fact, there are wide variations among agro-climatic zones in these two states. Singh
(2013) reported that 59.35, 17.87, 0.33, 9.43, 8.95 and 4.08 per cent of income from
agriculture, livestock and fisheries, industry and trade, wage, service and other sources
of farmers households in Bundelkhand region of Uttar Pradesh in comparison to 51.19,
13.07, 1.95, 7.46, 16.46 and 9.86 per cent respectively in overall state of Uttar Pradesh.
In another study Pandey and Reddy (2012) concluded that there is strong effects of land
productivity on reduction in rural poverty in Bundelkhand region of Uttar Pradesh,
while weak association between these two in Eastern agro-climatic zone of Uttar
Pradesh. It implies that enhancement of the farmers' income in a specific agro-climatic
zone requires specific strategies for various category of farmers.
The average value of various category of asset and cash loan outstanding with rural
th
household in state of Uttar Pradesh, Madhya Pradesh, India on 30 June, 2012 is
depicted in Table 2. Land and building together, in the rural areas, clearly form the
predominant component of assets and jointly holding about 94 per cent share in the total
value of assets at the national level, Madhya Pradesh and in Uttar Pradesh. The share of
other category of assets jointly contributed about 6 per cent only. The share of average
value of cash loan outstanding per rural household were about 3 per cent at national level
and 2 per cent at both the state.
4Table1a. Average monthly income of agricultural household for each class of land
possessed in Madhya Pradesh, 2012-13.
(₹/household)
Size Net Net Net Income Total
class receipt receipt receipt from
of land from from from wages/
possessed cultivation farming non-farm salary
(ha) of animals business
10.00 30219 509 77 840 31645
All sizes 3968 661 123 1234 5986
% share of total agricultural income
10.00 95.5 1.6 0.2 2.7 100
All sizes 66.3 11.0 2.1 20.6 100
Table1b. Average monthly income of agricultural household for each class of land
possessed in Uttar Pradesh, 2012-13.
(₹/household)
Size Net Net Net Income Total
class receipt receipt receipt from
of land from from from wages/
possessed cultivation farming non-farm salary
(ha) of animals business
10.00 56014 19 341 5231 61605
All sizes 2855 543 376 1150 4924
5% share of total agricultural income
10.00 90.9 0.0 0.6 8.5 100
All sizes 58.0 11.0 7.6 23.4 100
Source: Authors' estimate with data from 'Income, Expenditure, Production Assets and Indebtedness of Agricultural
Households in India', 2016, Report No. 576, 70th round, National Sample Survey Office (NSSO), 2012-13, Ministry of
Statistics and Programme Implementation, Government of India.
Table 2. Average value of various category of asset and cash loan outstanding withth
rural household in state of Uttar Pradesh, Madhya Pradesh, India on 30
June, 2012.
Asset category Madhya Uttar India Madhya Uttar India
Pradesh Pradesh Pradesh Pradesh
(₹/rural household) % in total value of asset
Land 768241 775291 731047 78.0 74.4 72.6
Building 159268 209790 212778 16.2 20.1 21.1
Livestock and poultry 18586 19066 16225 1.9 1.8 1.6
Farm business 8161 5213 4426 0.8 0.5 0.4
equipment
Non-farm business 473 2457 2492 0.0 0.2 0.2
equipment
Transport equipment 23502 18172 21342 2.4 1.7 2.1
Shares, etc. 9 54 746 0.0 0.0 0.1
Deposit, etc. 6359 11448 16662 0.6 1.1 1.7
Amount receivable 649 410 1286 0.1 0.0 0.1
Total 985248 1041901 1007004 100.0 100.0 100.0
Average value of cash 21249 22199 32522 2.2 2.1 3.2
loan outstanding (₹)
Source: Authors' estimate with data from 'Key Indicators of Debt and Investment in India', 2014, 70th round, National
Sample Survey Office (NSSO), 2013, Ministry of Statistics and Programme Implementation, Government of India
The performance of marketing and farm friendly reforms in state of Madhya Pradesh, Uttar
Pradesh, India, during October, 2016 is presented in Table 3. The state of Madhya Pradesh
achieved higher rank than Uttar Pradesh. The share of agriculture and allied sector in Gross
State Domestic Product (GSDP) was about 29 and 20 per cent in the state of Madhya
Pradesh and Uttar Pradesh respectively during 2014-15 at constant 2004-05 prices. This
implies that in spite of lion's share of agriculture and allied sector in GSDP appropriate
reforms in agricultural marketing and other farmers' friendly reforms not yet implemented
so far. Hence, there is need for adoption of these reforms in these two states.
6Table 3. Status of marketing and farm friendly reforms in state of Madhya Pradesh
and Uttar Pradesh, October, 2016.
Sl. No. Reform indicator Madhya Pradesh Uttar Pradesh
1 Setting up market in private sector
a Provision in the Act No No
b Notified No No
2 Direct marketing
a Provision in the Act Yes No
b Notified Yes No
3 Farmer-Consumer market
a Provision in the Act No No
b Notified No No
4 Contract Farming
a Provision in the Act Yes No
b Notified Yes No
c No. of crops 1 0
5 E-Trading
a Provision in the Act Yes Yes
b Notified Yes Yes
6 Single Point Levy in market
a Provision in the Act Yes Yes
b Notified Yes Yes
7 Single Trader License
a Provision in the Act Yes Yes
b Notified Yes Yes
8 Fruits and Vegetables out of APMC
regulation
a Provision in the Act No No
b Notified No No
c Fee/ Service Charge Yes Yes
9 Joining e-NAM Yes Yes
a Markets Enrolled 20 66
10 Tax/Levies/Fee on Agricultural 2 4
Commodities (%)
11 Restrictions on Felling of Trees Partial Partial
and Transit
12 Legal Status of Land Leasing Restriction Ban Partial
a Model Land Lease Law Yes No
State's score 69.5 47.8
Source: Ramesh Chand and Jaspal Singh (2016) Study Report on Agricultural Marketing and Farmer Friendly Reforms
Across Indian States and UTs. National Institution for Transforming India, NITI Aayog, New Delhi.
74. Resources availability in the region
Bundelkhand has dubious distinction of being rainfed, vulnerable to drought and one of
the low productive region of the country. The district-wise land resources classified as
Desirable ecological resources comprises area under forests, permanent pastures and
other grazing lands and area under miscellaneous trees and groves not included in net
sown area; Un-Desirable ecological resources consists area under barren and un-
culturable land; Non-agricultural land resources include area under non-agricultural
uses; and Agricultural land resources include area under culturable wasteland, current
fallows and net sown area. Desirable ecological resources support to strengthen the
sustainable production of agricultural and allied activities especially for landless and
marginal farmers who depend on common property resources. Panna and Chitrakoot
districts ranked first among other districts in the region of Madhya Pradesh and Uttar
Pradesh in term of highest area under desirable ecological resources. The share of area
under desirable ecological resources was below 9 per cent of state average in all the
districts of the region except Chitrakoot and Lalitpur in the state of Uttar Pradesh, while
in Madhya Pradesh all the districts in the region having more share than state average of
33 per cent except Datia and Tikamgarh. It implies that part of the region under Madhya
Pradesh are much ecologically desirable than Uttar Pradesh (Table 4).
Table 4. District-wise share of various land resources in Bundelkhand region,
2014-15.
(per cent)
District Land use group
Area under Area under Area under Area under
forests, permanent barren and non- culturable
pastures and un-culturable agricultural wasteland,
grazing lands land uses current
and area under fallows and
miscellaneous trees area under
and grooves not net sown
included in net
sown area
Banda 1.7 2.5 7.2 88.6
Chitrakoot 25.3 6.2 9.1 59.4
Hamirpur 6.6 2.4 8.4 82.6
Jalaun 6.6 2.5 8.6 82.3
Jhansi 7.2 6.3 8.8 77.7
Lalitpur 15.6 2.8 8.1 73.5
Mahoba 5.3 2.5 11.8 80.4
All Uttar Pradesh 8.6 2.0 11.7 77.7
Chatarpur 32.9 0.2 5.3 61.6
Damoh 41.7 7.9 4.4 46.0
8Datia 12.8 5.3 5.9 76.0
Panna 44.2 3.2 6.2 46.3
Sagar 36.7 1.2 5.7 56.4
Tikamgarh 17.5 10.9 7.5 64.2
All Madhya Pradesh* 32.5 4.4 7.0 56.1
Source: Authors estimates based on data from Directorate of Economics and Statistics, Ministry of Agriculture and
Farmers Welfare, Government of India data accessed on 31-3-2017 from http://agcensus.dacnet.nic.in
*The district-wise data for the state of Madhya Pradesh was used for the year 2013-14.
The marginal and small holdings (below 2.00 ha.) constituted 85, 93 and 72 per cent in
all operational holdings at all India level, Uttar Pradesh and Madhya Pradesh,
respectively during 2010-11. The highest share of this group of farmers were in
Chitrakoot and lowest share in Tikamgarh district in the region. The semi-medium and
medium operational holdings (2.00 ha. – 9.99 ha.) Were 14, 7 and 28 per cent at all India
level, Uttar Pradesh and Madhya Pradesh, respectively? The highest share of both these
size class of farmers were in Tikamgarh and lowest share in Chitrakoot districts in the
region. The large holdings (10.00 ha. & above) were only 0.7, 0.1 and 1.0 per cent of total
number of holdings at all India level, Uttar Pradesh and Madhya Pradesh, respectively.
However, the maximum share of large farmers were in Hamirpur and Jhansi districts
respectively in the region (Table 5).
Table 5. District-wise share of various category of farm holding in Bundelkhand
region, 2010-11.
District % Share in numbers of various size class of farms
Marginal Small Semi-Medium Medium Large
(below (1.00- (2.00 - (4.00 - (10.00 and
1 ha) 1.99 ha) 3.99 ha) 9.99 ha) above)
Banda 59.3 20.7 12.9 6.5 0.7
Chitrakoot 65.9 19.1 9.5 4.7 0.8
Hamirpur 57.0 19.2 14.2 8.5 1.1
Jalaun 54.3 22.5 14.6 8.0 0.6
Jhansi 61.6 19.5 12.6 6.1 0.3
Lalitpur 48.9 31.5 13.8 5.1 0.7
Mahoba 51.6 23.7 15.6 8.2 0.8
All Uttar 79.5 13.0 5.7 1.7 0.1
Pradesh
Chatarpur 39.9 32.2 19.3 7.8 0.9
Damoh 48.2 26.8 16.7 7.3 1.0
Datia 50.6 24.8 16.1 7.9 0.6
Panna 47.1 28.9 16.9 6.7 0.5
Sagar 43.1 31.6 16.5 7.9 1.0
Tikamgarh 44.5 26.4 21.4 7.4 0.3
All Madhya 43.9 27.6 18.7 8.9 1.0
Pradesh
All India 67.1 17.9 10.0 4.3 0.7
Source: Authors estimates based on data from Directorate of Economics and Statistics, Ministry of Agriculture and
Farmers Welfare, Government of India data accessed on 31-3-2017 from http://agcensus.dacnet.nic.in
9The average size in all size class of operational holding was 1.15, 0.76 and 1.78 ha at all
India level, Uttar Pradesh and Madhya Pradesh respectively during 2010-11. The
highest size of holding of this group were in Chhatarpur and Chitrakoot districts in the
region. The average size of holding in all the districts were higher than national and state
averages. This implies that there is more scope to increase farm business in comparison
to other districts of these two states (Table 6).
Table 6. District-wise average size of holding (ha) in Bundelkhand region, 2010-11.
District Marginal Small Semi- Medium Large All
(below (1.00- Medium (4.00 - (10.00 Size
1 ha) 1.99 ha) (2.00 - 9.99 ha) and Classes
3.99ha) above)
Banda 0.45 1.40 2.79 5.72 14.10 1.38
Chitrakoot 0.43 1.37 2.67 5.79 15.39 1.20
Hamirpur 0.37 1.42 2.80 5.98 13.44 1.53
Jalaun 0.47 1.23 2.77 5.79 12.66 1.48
Jhansi 0.51 1.47 2.81 5.83 13.94 1.35
Lalitpur 0.55 1.42 2.77 5.78 14.71 1.50
Mahoba 0.47 1.44 2.77 5.78 12.77 1.59
All Uttar Pradesh 0.39 1.40 2.72 5.52 15.01 0.76
Chatarpur 0.54 1.42 2.69 5.73 14.59 1.76
Damoh 0.51 1.43 2.75 5.75 16.72 1.67
Datia 0.49 1.42 2.71 5.61 13.75 1.56
Panna 0.47 1.41 2.68 5.61 13.68 1.53
Sagar 0.54 1.42 2.76 5.79 15.31 1.75
Tikamgarh 0.50 1.25 2.62 5.18 14.43 1.54
All Madhya Pradesh 0.49 1.42 2.73 5.76 15.77 1.78
All India 0.39 1.42 2.71 5.76 17.38 1.15
Source: Authors estimates based on data from Directorate of Economics and Statistics, Ministry of Agriculture and
Farmers Welfare, Government of India data accessed on 31-3-2017 from http://agcensus.dacnet.nic.in.
The groundwater situation in various district of Bundelkhand region is presented in
Table 7. It shows that the stage of water development is less than 100 except the district
of Mahoba, Uttar Pradesh. It implies that the annual groundwater extraction rate is
below the net annual water recharge. The net groundwater availability for irrigation is
highest in Sagar and lowest in Mahoba district. The decadal changes in groundwater
level indicate that all districts except Mahoba showed fall in water table ranging between
5 to 43 per cent of wells in category of more than four metre depth between
post–Monsoon season of 2006 to 2016. The highest share recorded in Chitrakoot district
where over 40 per cent of wells showed fall in water-table in category of more than four
metre depth of water table.
10Table7. District-wise groundwater situation in Bundelkhand region, 2011.
District Stage of Net ground Percentage of wells showing fluctuation during
ground water January, 2006-2016
water availability
develop- for future Rise Fall
ment irrigation
(%) use (billion 0-2 2-4 >4 0-2 2-4 >4
cubic m m m m m m
meters)
(bcm)
Banda 55 0.30 14.29 14.29 0 50.00 7.14 14.29
Chitrakoot 66 0.08 0 0 0 42.86 14.29 42.86
Hamirpur 64 0.17 66.67 0 0 22.22 0 11.11
Jalaun 29 1.30 11.11 3.70 0 51.85 22.22 11.11
Jhansi 89 0.19 26.32 0 0 52.63 15.79 5.26
Lalitpur 62 0.18 25.00 0 0 33.33 33.33 8.33
Mahoba 112 0.00 71.43 0 0 14.29 14.29 0
All 74 19.64 40.00 0 0 30.00 20.00 10.00
Uttar
Pradesh
Chhatarpur 67 0.23 10.26 0 2.56 33.33 41.03 12.82
Damoh 62 0.13 27.27 4.55 0 36.36 22.73 9.09
Datia 48 0.16 10.00 10.00 0 40.00 20.00 20.00
Panna 26 0.37 19.23 0 3.85 46.15 15.38 15.38
Sagar 59 0.48 5.00 2.50 0 50.00 37.50 5.00
Tikamgarh 72 0.14 15.00 0 0 40.00 35.0 10.00
All 57 13.90 22.21 4.92 1.84 39.66 19.23 12.07
Madhya
Pradesh
Source: Authors estimates based on data from the report on 'Dynamic Ground Water Resources of India (As on 31st
March,2011),2014; and Groundwater Yearbook, Uttar Pradesh, 2015-16, Central Ground Water Board, Ministry of Water
Resources, River Development and Ganga Rejuvenation, Government of India, data accessed on 31-3-2017 from
http://agcensus.dacnet.nic.in
*Stage of groundwater development= (Total ground water extraction/ Net annual groundwater availability)*100
The district of Chitrakoot and Panna have less than 50 per cent net irrigated area while
Lalitpur and Datia have over 90 per cent net irrigated area in 2013-14. However,
majority of districts have net and gross irrigated area below share than their state
average. The groundwater is major source of irrigation and contributing over 60 per cent
in all the districts except Datia, Jalaun and Panna district. Canal irrigation is major
source of irrigation in Datia and Jalaun and other sources in Panna district (Table 8).
11Table 8. District-wise irrigation availability situation in Bundelkhand region,
2013-14.
District % of % of % share of net irrigated area by
irrigated irrigated different sources of irrigated area, 2014-15
area to area to
net area gross area Tubewell Other wells Canal Tank Others
sown sown
Banda 44 46 60.2 9.3 28.0 2.3 0.2
Chitrakoot 30 29 78.1 6.2 6.3 9.3 0.1
Hamirpur 51 42 65.1 13.4 17.8 1.9 1.8
Jalaun 71 62 30.8 6.3 61.5 1.1 0.2
Jhansi 81 56 11.9 36.7 39.1 11.4 1
Lalitpur 95 53 25.4 28 33.0 9.2 4.3
Mahoba 53 39 4.4 55 19.9 18.5 2.2
All Uttar 85 79 71.2 9.3 18.2 0.8 0.4
Pradesh
Chhatarpur 61 43 5.2 73.6 10.1 1.6 9.5
Damoh 57 35 20.0 20.9 11.6 4.8 42.7
Datia 90 75 11.1 23.7 64.6 0 0.7
Panna 42 28 7.8 14.4 8.2 1.4 68.2
Sagar 61 38 25.7 45.6 3.4 1.6 23.7
Tikamgarh 84 59 12.7 64.8 9.4 8.0 5.2
All Madhya 61 41 32.9 32.9 17.2 2.8 14.3
Pradesh
Source: Authors estimates based on data from Directorate of Economics and Statistics, Ministry of Agriculture and
Farmers Welfare, Government of India data accessed on 31-3-2017 from http://agcensus.dacnet.nic.in; and Statistical
Diary, Directorate of Economics and Statistics, Government of Uttar Pradesh, 2015.
National Rainfed Area Authority has prioritized the rainfed districts on the basis of
Rainfed Areas Prioritization Index (RAPI) which was derived by assigning two-thirds
weight to natural resource (NR) priority index and one-third weight to livelihood
priority index. Natural Resource Index (NRI) comprising of nine variables, viz., rainfall,
frequency of drought, available water content, extent and per cent of degraded and
wastelands, irrigation intensity, extent and per cent of rainfed areas and ground water
status. Similarly, an “Integrated Livelihood Index” (ILI), is a composite of three sub-
indices, viz., socio-economic index, health and sanitation index and infrastructure
index. In majority of the districts, natural resources status and livelihood status are
inversely related. Top rankers districts with RAPI need immediate attention for
enhancing productivity and livelihood as resource-wise they are rich but the
productivity and livelihood status are poor. On the basis of status of the priority rank in
India, Panna and Chitrakoot need special attention for agricultural development in
Bundelkhand region through dissemination of technology, infrastructure development,
marketing facilities, strengthening the credit facilities, bridging the knowledge gap
along with forward and backward linkages (Table 9).
12Table 9. Prioritization of districts on the basis of Natural Resources Index (NRI),
Integrated Livelihood Index (ILI) and Rainfed Area Prioritization Index
(RAPI) in Bundelkhand region, 2012.
District Natural Integrated Rainfed Priority
Resources Livelihood Area Rank in
Index Index Prioritization India
(NRI) (ILI) Index (RAPI)
Uttar Pradesh
Banda 0.764 0.345 0.376 75
Chitrakoot 0.810 0.293 0.363 94
Hamirpur 0.765 0.402 0.356 108
Jalaun 0.812 0.483 0.298 252
Jhansi 0.776 0.452 0.332 155
Lalitpur 0.841 0.332 0.329 165
Mahoba 0.811 0.307 0.357 103
Madhya Pradesh
Chhatarpur 0.831 0.328 0.336 145
Damoh 0.843 0.320 0.332 158
Datia 0.841 0.499 0.273 316
Panna 0.804 0.288 0.368 85
Sagar 0.831 0.314 0.342 133
Tikamgarh 0.875 0.352 0.299 245
Source: Prioritization of Rainfed Areas in India, National Rainfed Area Authority, Planning Commission, Government of
India, 2012
Districts with medium to high NRI status but low ILI indicating scope for improving the
livelihoods through better access and utilization of natural resources. Areas having low
NRI deserve creation of off-farm employment opportunities with focus on land use
diversification, micro-enterprises and industrialization. All districts having high to
medium milk potential should get high priority for milk production through rearing of
improved quality of milch animals. The marginal and landless farmers without capital
should be encouraged for goatary, which is much profitable for available un-skilled
abundant labour (Table10).
The Soil fertility status of Bundelkhand region
The soils of UP Bundelkhand region is very typical with its flat, alluvial, sandy
texture with mix of red and black soils, swallow and have low water holding capacity.
While in the MP Bundelkhand region, the land feature is very undulating with deep to
very deep heavy texture soils. In most of the cases, farmers of these regions are
resource poor, with small holdings of land. They mostly use N (Nitrogen) and P
(Phosphorus) fertilizers, with no or little use of K (Potassium). The status of fertility
in 7 districts of UP Bundelkhand and 6 districts of MP Bundelkhand is given as
follows (Table11 &12):
13Table10. District-wise Milk Production Potential in Bundelkhand region, 2012.
District Status of Cow % of crossbred Buffalo Milk Potential
Natural density cow density production
Resources index
Index (NRI)
Uttar Pradesh
Banda Low 43.14 0.55 50.64 0.870 Medium
Chitrakoot Medium 53.36 0.31 38.03 0.880 Medium
Hamirpur Low 32.28 2.87 37.41 0.897 High
Jalaun Medium 35.93 2.29 40.82 0.889 Medium
Jhansi Low 34.31 0.52 29.40 0.914 High
Lalitpur Medium 51.00 0.13 30.03 0.896 Medium
Mahoba Medium 40.32 0.78 31.78 0.903 High
Madhya Pradesh
Chhatarpur Medium 35.34 0.33 32.13 0.909 High
Damoh Medium 49.31 0.24 13.97 0.923 High
Datia Medium 30.92 0.69 60.78 0.867 Medium
Panna Medium 42.84 0.30 18.41 0.923 High
Sagar Medium 53.40 0.62 18.85 0.910 High
Tikamgarh High 64.23 1.23 49.63 0.847 Medium
Source: Prioritization of Rainfed Areas in India, National Rainfed Area Authority, Planning Commission, Government of
India, 2012
Table 11. The soil fertility status of different districts of Uttar Pradesh
Bundelkhand region
Districts Macronutrients Micronutrients
N P K S Zn Cu Fe Mn
Jhansi L VL H M+ M+ S S S
Jalaun L VL H D M+ S S S
Mahoba L L H D M+ S S S
Chitrakoot VL VL M M+ M+ S M S
Banda VL VL M M+ M+ S S S
Hamirpur L VL H D M+ S S S
Lalitpur L VL H D M+ S S S
Note: VL- Very Low, L- Low, H- High, M- Medium, M+-Marginal, S- Sufficient, D- Deficient
(Source: Synthesis Report, NRAA, NitiAayog, GOI, New Delhi).
14Table 12. The soil fertility status of different districts of Madhya Pradesh
Bundelkhand region.
Districts N P K Zn deficit (%)
Datia L M H 40
Tikamgarh L L H 88
Sagar L H L 78
Damoh L H L 70
Panna L L H 60
Chhattarpur L L H 53
Note: L- Low, M- Medium, H- High
(Source: Synthesis Report, NRAA, Niti Aayog, GOI, New Delhi).
As such, in UP Bundelkhand region, the status of N availability is low to very low, P is
also very deficient available, K availability is medium to high, S is marginal to deficient.
Among the micronutrient availability, the Zn is marginal, otherwise Cu, Fe and Mn were
found to be sufficient.
In MP Bundelkhand region, the status of N availability is low. P availability is medium in
Datia, high in Sagar and Damoh districts and low in Tikamgarh, Panna and Chhattarpur.
The level of K is between low to high. Especially, among the micronutrients, the zinc
deficiency level is widespread ranging from 40% to 88%. Thus we can say that, the soil
of Bundelkhand region are very poor in fertility status as far as the N and P are
concerned, and also suffer from zinc deficiency. There may be number of reasons for
this, might be due to very high soil degradation due to climatic variability, high
temperature, undulating topography. Spatial variability of soil fertility status is also very
high. The farmers of this region are mostly using N and P fertilizers and FYM and
compost to some extent but little aware of other organic sources of fertilizers like green
manuring, biofertilizers etc. Thus, the integrated use of inorganic and organic fertilizers
i.e., to say integrated nutrient management (INM) are very important for maintaining the
soil fertility status as well as sustaining the agricultural productivity on long term basis.
Due to indiscriminate use of fertilizers and even under use had led to many multifaceted
problems in the soil of the region. To fulfill the mismatch between the nutrient removed
by the crop and the amount used in actual, there is need to apply the nutrients in adequate
amount and that too at particular growth stages of the crop. Even, the application of neem
coated urea, foliar application of micronutrients for horticultural crops and use of
fertilizers on the basis of soil test is desirable. Especially the use of Soil Health Card for
the application of fertilizers and organic sources should be done to harness maximum
benefits.
The district-wise cropping pattern in Uttar Pradesh is depicted in Table13. Its shows that
the highest cropping intensity was reported in the Lalitpur followed by Jhansi and Banda
district. The maximum area covered by wheat, gram, other pulses and sesame. These
crops are suitable for this region because of low water requirement and low production
cost except wheat.
15Table13. District-wise cropping pattern(per cent) in Bundelkhand region of Uttar
Pradesh, 2014-15.
Crop Banda Chitra- Hamir- Jalaun Jhansi Lalit- Mahoba All Uttar
koot pur pur Pradesh
Rice 12.15 6.70 0.02 0.38 2.82 0.24 0.01 23.47
Jowar 5.36 6.03 4.20 1.60 0.14 0.02 0.53 0.62
Bajra 0.69 7.97 0.12 3.29 0.00 0.00 0.00 3.72
Maize 0.00 0.00 0.02 0.00 0.12 3.29 0.00 2.64
Wheat 35.92 37.12 29.31 35.94 28.45 34.64 20.40 38.43
Barley 0.18 1.80 1.32 1.93 3.63 1.94 2.16 0.60
Other Cereals 0.00 0.02 0.00 0.00 0.04 0.00 0.00 0.13
and Millets
Gram 20.14 17.89 18.78 8.40 9.46 2.23 18.09 2.04
Arhar (Tur) 4.28 5.71 4.26 1.21 0.09 0.00 0.91 1.05
Other Pulses 11.52 8.87 20.48 25.43 33.39 43.28 37.24 5.57
Sugarcane 0.10 0.11 1.47 0.29 0.03 0.01 1.14 8.47
Other Sugar 0.00 0.00 0.03 0.02 0.01 0.00 0.00 0.12
Total 0.04 0.02 0.13 0.03 0.01 0.15 0.04 0.24
Condiments
and Spices
Total Fruits 0.01 0.01 0.00 0.00 0.04 0.02 0.00 1.14
Total Vegetables 0.43 0.75 0.57 1.75 0.89 0.51 0.61 3.24
Groundnut 0.19 0.04 0.06 0.00 5.40 2.08 3.97 0.39
Sesamum 6.44 2.85 13.69 15.81 12.77 1.23 10.55 1.46
Rapeseed and 0.85 2.93 4.27 2.58 1.54 0.76 1.97 2.23
Mustard
Linseed 0.86 0.31 0.55 0.05 0.03 0.00 2.05 0.09
Soyabean 0.01 0.00 0.00 0.01 0.31 9.56 0.10 0.21
Other Oilseeds 0.02 0.00 0.04 0.04 0.07 0.00 0.01 0.01
Total Fibres 0.03 0.06 0.10 0.02 0.01 0.00 0.03 0.03
Total Drugs, 0.00 0.00 0.13 0.60 0.48 0.00 0.13 0.97
Narcotics and
Plantation
Crops
Fodder Crops 0.78 0.79 0.44 0.50 0.13 0.04 0.02 2.93
Green Manure 0.00 0.00 0.00 0.00 0.09 0.00 0.00 0.06
Other Non- 0.00 0.00 0.00 0.08 0.12 0.00 0.02 0.16
Food Crops
Cropping 130 113 128 125 165 180 143 158
intensity
Source: Authors estimates based on data from Directorate of Economics and Statistics, Ministry of Agriculture and
Farmers Welfare, Government of India data accessed on 31-3-2017 from http://agcensus.dacnet.nic.in
16The cropping intensity was higher in Tikamgarh, Damoh and Sagar districts even more
than state average of Madhya Pradesh. The maximum area is under wheat, soyabean,
gram, other pulses and sesamum in all the districts in the region. Surprisingly, the share
of rice is over 19 per cent in Panna district where groundwater table is declining rapidly
during last decade. Rice is water guzzling crop which should be discouraged in this
water scarced region (Table 14).
Table14. District-wise cropping pattern (Per cent) in Bundelkhand region of
Madhya Pradesh, 2013-14.
Crop Chhatar- Damoh Datia Panna Sagar Tikam- All Madhya
pur garh Pradesh
Rice 0.81 10.72 4.52 19.31 0.54 2.44 7.79
Jowar 1.56 0.06 0.45 0.93 0.09 0.22 1.02
Bajra 0.01 0.00 0.30 0.00 0.00 0.00 0.80
Maize 0.08 0.32 0.26 0.83 0.31 0.37 3.54
Wheat 29.13 17.07 50.70 20.41 25.79 33.94 25.46
Barley 3.02 0.03 1.28 0.90 0.08 2.56 0.35
Other Cereals 0.02 0.02 0.00 0.16 0.05 0.04 0.84
and Millets
Gram 14.17 34.30 6.48 19.94 20.40 4.21 11.54
Arhar (Tur) 1.48 1.62 0.08 3.18 0.68 0.01 1.65
Other Pulses 15.35 9.36 13.43 15.59 8.70 22.43 6.41
Sugarcane 0.08 0.02 2.20 0.11 0.05 0.08 0.42
Other Sugar 0.00 0.00 0.00 0.00 0.00 0.00 0.00
Total Condiments 0.44 0.20 0.06 0.47 0.23 0.63 1.44
and Spices
Total Fruits 0.01 0.02 0.01 0.10 0.01 0.07 0.21
Total Vegetables 1.75 0.88 0.72 1.76 1.29 2.13 1.35
Groundnut 1.67 0.02 2.46 0.08 0.17 4.28 0.90
Sesamum 10.49 0.23 7.78 8.69 0.12 6.45 1.12
Rapeseed and 3.18 0.12 5.44 1.02 0.05 4.76 2.92
Mustard
Linseed 1.04 0.04 0.00 0.11 0.09 0.01 0.37
Soyabean 13.35 24.77 0.66 6.28 39.64 12.97 27.21
Other Oilseeds 0.00 0.00 0.51 0.00 0.06 0.00 0.05
Total Fibres 0.10 0.00 0.10 0.03 0.00 0.00 2.41
Total Drugs, 1.24 0.00 0.00 0.05 0.01 0.00 0.18
Narcotics and
Plantation Crops
Fodder Crops 0.87 0.19 2.36 0.00 1.49 2.39 1.66
Green Manure 0.00 0.00 0.00 0.00 0.00 0.00 0.00
Other Non- 0.00 0.00 0.21 0.00 0.01 0.00 0.04
Food Crops
Cropping intensity 142 163 127 154 162 168 156
Source: Authors estimates based on data from Directorate of Economics and Statistics, Ministry of Agriculture and
Farmers Welfare, Government of India data accessed on 31-3-2017 from http://agcensus.dacnet.nic.in
17The district-wise share of animals is presented in Table 15. It shows that share of cattle
and buffalo jointly contributes over 70 per cent of total livestock population in year
2012. The goat also contributed substantially. The goatary enterprise is much attractive
for resource poor farmers provided common pasture lands availability is sufficient
however, the area under common property resources is continuously decreasing along
with their quality.
Table 15. Share of animals in total livestock (Per cent) in various districts of
Bundelkhand region, 2012.
District Total No. of % Share in total livestock
livestock (000) Cattle Buffalo Goat Others
Banda 940 39.5 34.5 22.4 3.6
Chitrakoot 762 55.3 24.1 16.5 4.2
Hamirpur 793 34.0 25.2 36.8 4.1
Jalaun 804 28.0 31.9 33.4 6.8
Jhansi 954 37.0 25.5 30.8 6.7
Lalitpur 887 54.5 26.5 17.7 1.4
Mahoba 563 40.5 24.1 28.9 6.5
All Uttar Pradesh 68715 28.5 44.6 22.7 4.3
Chatarpur 850 40.5 28.1 30.0 1.4
Damoh 797 70.1 13.4 15.3 1.2
Datia 364 29.5 41.3 27.4 1.8
Panna 693 59.8 20.5 18.1 1.6
Sagar 1165 68.9 18.3 12.1 0.7
Tikamgarh 868 42.3 26.7 25.8 5.2
All Madhya Pradesh 36333 54.0 22.5 22.1 1.5
Source: Authors estimates based on data from 19th Livestock Census District Wise Report 2012, Department of Animal
Husbandry, Dairying and Fisheries, Ministry of Agriculture and Farmers Welfare, Government of India.
The number of animals per households presented in Table 16 shows that maximum
number of livestock per households are in Chitrakoot followed by Lalitpur and Jhansi
district (2012). In case of cattle Chitrakoot rank first followed by Lalitpur and Panna;
and in case of buffaloes Lalitpur, Jhansi and Chitrakoot respectively. However, in case of
goatary maximum number per household are in Hamirpur followed by Jhansi and
Mahoba districts.
Table 16. Number of animals rearing by per household in various districts of
Bundelkhand
District Total No. of House- No. of animals /household
hold (000) livestock Cattle Buffaloes Goat Others
Banda 342 2.75 1.09 0.95 0.62 0.10
Chitrakoot 175 4.34 2.40 1.05 0.71 0.18
Hamirpur 207 3.82 1.30 0.96 1.41 0.16
18Jalaun 270 2.98 0.83 0.95 0.99 0.20
Jhansi 229 4.17 1.54 1.06 1.29 0.28
Lalitpur 212 4.19 2.28 1.11 0.74 0.06
Mahoba 156 3.61 1.46 0.87 1.04 0.24
All Uttar Pradesh 36930 1.86 0.53 0.83 0.42 0.08
Chatarpur 337 2.52 1.02 0.71 0.75 0.04
Damoh 284 2.81 1.97 0.38 0.43 0.03
Datia 148 2.45 0.72 1.01 0.67 0.04
Panna 199 3.49 2.09 0.71 0.63 0.06
Sagar 482 2.42 1.67 0.44 0.29 0.02
Tikamgarh 277 3.13 1.32 0.84 0.81 0.16
All Madhya Pradesh 16933 2.15 1.16 0.48 0.47 0.03
th
Source: Authors estimates based on data from 19 Livestock Census District Wise Report 2012, Department of Animal
Husbandry, Dairying and Fisheries, Ministry of Agriculture and Farmers Welfare, Government of India.
195. Strategy for income enhancement of farmers' in India
Strategy is a consistency framework for bringing together diverse policy initiatives in an
overarching logical structure that adopts a long–term view of any sector prospect.
Agricultural sectors are populous and very diverse and therefore a compelling vision of
the sector's potentiality is necessary in order to mobilize support. There are various
strategies suggested by policy makers and policy analyst for speedy enhancement of
farmers' income in our country as follows:
A) Prime Minister's seven-point strategy for doubling farmers' income by 2022
1. Focus on irrigation with per drop-more crop;
2. Quality seed and soil health;
3. Investments in warehousing and cold chains;
4. Value addition through food processing;
5. Creation of a national farm market;
6. New revolutionary crop insurance scheme to mitigate risks at affordable costs;
and
7. Promotion of ancillary activities like poultry, beekeeping and fisheries.
5.1 Suggested plans for income enhancement of farmers' in Bundelkhand region
The strategy for income enhancement of farmers' in less-favored areas like
Bundelkhand region is challenging. The share of marginal and small farmers is over
75 per cent in Bundelkhand region of Uttar Pradesh, which is less than their state
average of 93 per cent. While the share of marginal and small farmers in Madhya
Pradesh part of Bundelkhand region is over 71 per cent which is less than state
average of 72 per cent. It implies that the size of holdings in this region are relatively
larger than other regions of the respective state. However, the farmers of the region
regularly face the problem of climatic vagaries like frequent drought, resulting in
distress migration from the region. Some enterprises are suggested to increase the
income and sustain even in the drought condition in the region.
The income under rainfed and irrigated agriculture system varies with different
enterprises and components involved. In order to enhance the income of the farmers
under these conditions few plans has been suggested and depicted in Table 17 and
18.The income from crop cultivation can be enhanced through crop diversification,
selection of improved varieties, improved crop management practices, adoption of
timber / or fruit based agroforestry systems, rain water harvesting and use of micro/
pressurized irrigation methods. The animal productivity can be enhanced by
selection of improved breeds, livestock diversification and providing balanced
nutrition. The income from non-farm and wages can be increased through imparting
skill development trainings, linkages, capacity building and farming user groups or
self-help groups (SHGs).
20In case of marginal category farmers under rainfed condition, the existing income of
Rs 4605 may be enhanced with best management practices within the same piece of
land. By crop diversification, improved varieties, improved crop management
practices and small interventions to harvest rain water through formation of bunds
and digging small farm pond will help in retaining moisture and storing of water. In
addition by introducing grass component and keeping improved breed of livestock
result in enhancing the milk productivity and help in soil and moisture conservation.
Under no farm income category, to meet out immediate exigencies the farmers can
collectively form SHGs for a specific activity say vermicomposting, nursery
development, poultry rearing, common irrigation, etc. If he enhances the skill
through skill development programmers such as ber budding, grafting etc his
overall income will get enhanced. Hence by practicing all the listed best
management practices his overall income will rise to ` 8059.
Table 17. Comparison of existing status and suggested plan for various category of
farmers in Bundelkhand region under Rainfed condition.
Category Rainfed
of farmers Existing Status Suggested Plan
Enterprise Average Enterprise/ Approaches Average
monthly net monthly net
income (`) income (`)
Marginal Crop 2860 Crop diversification, 5005
(below cultivation improved varieties,
1 ha) improved crop management
practices and rain water
harvesting
Animals 416 Improved breed; green 700
fodder; livestock diversification
Non-farm 262 User Groups/ SHGs; linkages 450
and skill development
Wages/salary 1067 Capacity building 1867
Total 4605 8022
Small Crop 5892 Crop diversification, 10211
(1.00- cultivation improved varieties, improved
1.99 ha) crop management practices
and rain water harvesting
Animals 976 Improved breed; green 1700
fodder; balanced nutrition;
livestock diversification
Non-farm 542 User Groups/ SHGs; linkages 900
and skill development
Wages/salary 992 Capacity building 1736
Total 8402 14547
21Semi- Crop 12591 Improved varieties, improved 22100
Medium cultivation crop management practices;
(2.00- integrated farming system;
3.99 ha) vegetable cultivation; small
timber agroforestry system
and rain water harvesting
Animals 1711 Balanced nutrition; green 2994
fodder; improved breed;
livestock diversification
Non-farm 533 Group activity; linkages 850
Wages/salary 1025 - 1754
Total 15860 27698
Medium Crop 19564 Improved varieties, improved 34100
(4.00- cultivation crop management practices;
9.99 ha) integrated farming system;
vegetable cultivation; small
timber agroforestry system;
organic farming; rain water
harvesting and micro irrigation
Animals 1743 Balanced nutrition; green ; 2990
fodder improved breed;
livestock diversification
Non-farm 439 Farm produce based small 760
industry
Wages/salary 1219 - 2033
Total 22965 39883
Large Crop 56014 Improved varieties, improved 98025
(10.00 and cultivation crop management practices;
above) integrated farming system;
vegetable cultivation; fruit
orchards, small timber
agroforestry system; organic
farming; rain water harvesting
with farm pond and micro
irrigation
Animals 1900 Balanced nutrition; green 3325
fodder; improved breed;
livestock diversification
Non-farm 341 Farm produce based small 597
industry
Wages/salary 5231 - 9154
Total 63486 11101
22You can also read