ICC DISPUTE RESOLUTION 2019 STATISTICS - Global Arbitration News

Page created by Tracy Bishop
 
CONTINUE READING
ICC DISPUTE RESOLUTION 2019 STATISTICS - Global Arbitration News
ICC DISPUTE
RESOLUTION
2019 STATISTICS
ICC DISPUTE RESOLUTION 2019 STATISTICS - Global Arbitration News
ICC Dispute Resolution 2019 Statistics

Online at www.iccwbo.org/dr-stat2019
ICC Publication No.: DRS 901 ENG

Copyright © 2020
International Chamber of Commerce (ICC)
ICC holds all copyright and other intellectual property rights in this
work, and encourages its reproduction and dissemination subject
to the following:
   • ICC must be cited as the source and copyright holder
     mentioning the title of the document, © International
     Chamber of Commerce (ICC), and the publication year.
   • Express written permission must be obtained for any
     modification, adaptation or translation, or for any
     commercial use.
   • The work may not be reproduced or made available on
     websites except through a link to the relevant ICC web page.
Permission can be requested from ICC through copyright.drs@
iccwbo.org.

Trademarks
ICC, the ICC logo, CCI, International Chamber of Commerce
(including Spanish, French, Portuguese and Chinese translations),
World Business Organization, International Court of Arbitration and
ICC International Court of Arbitration (including Spanish, French,
German, Arabic and Portuguese translations) are all trademarks
of ICC, registered in several countries.

International Chamber of Commerce (ICC) - Dispute Resolution 2019 Statistics
ICC DISPUTE RESOLUTION 2019 STATISTICS - Global Arbitration News
Key moments in ICC
dispute resolution in 2019                                    4-8

International Court
of Arbitration 9-18

International Centre
for ADR 19-20

Annex – Tables                      21-29

    International Chamber of Commerce (ICC) - 2019
                                              Dispute
                                                   Dispute
                                                      Resolution
                                                           Resolution
                                                                 2019 Statistics
ICC DISPUTE RESOLUTION 2019 STATISTICS - Global Arbitration News
4    /       Key moments in 2019

KEY MOMENTS IN ICC DISPUTE RESOLUTION IN 2019

1
         100/25k
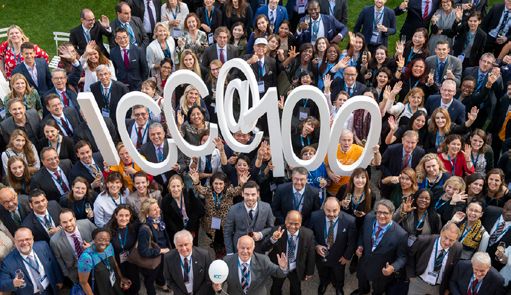
    In 2019, the International Chamber of Commerce
    (ICC) celebrated its centenary and the ICC
    International Court of Arbitration registered its
    25,000th case. The milestone case, a corporate
    dispute between multiple parties originating
    from South East Asia and the Middle East, is
    being administered through the Secretariat’s case
    management office in Singapore.

                                                2
                                                        147/89/
                                                        21%/20%
                                                  New ICC dispute resolution records were made in
                                                  2019. A total of 869 new cases were registered, of
                                                  which 851 cases under the ICC Arbitration Rules
                                                  and 18 under the ICC Appointing Authority Rules. In
                                                  terms of diversity, the 851 new cases under the ICC
                                                  Arbitration Rules involved parties originating from
                                                  147 countries and independent territories, arbitrators
                                                  from 89 jurisdictions, and a proportion of women
                                                  arbitrators now reaching 21%. 2019 also saw the
                                                  highest number of cities hosting ICC Arbitrations (116
                                                  cities spread over 62 countries), and a record number
                                                  of new cases involving a state or state entities (20%).

International Chamber of Commerce (ICC) - Dispute Resolution 2019 Statistics
ICC DISPUTE RESOLUTION 2019 STATISTICS - Global Arbitration News
5   /   Key moments in 2019

                                                    3

                                                     ICC became an authorised institution under the
                                                     Mainland China and Hong Kong arrangement
                                                     on interim relief and a registered institution in
                                                     the State of Sao Paulo. In 2019, ICC was further
                                                     recognized as a ‘global benchmark for arbitration
                                                     institutions’ and was called on to act as amicus
                                                     curiae to provide credible third-party legal opinions
                                                     in three high-profile cases before the Supreme
                                                     Court of the United Kingdom, the Supreme Court
                                                     of Canada and the United States District Court
                                                     Northern District of California Oakland Division.

        4

        2019 saw the launch of the Emergency Arbitrator
        Proceedings Report, an empirical study of the first
        80 ICC Emergency Arbitrator cases with additional
        local law input by ICC National Committees, and
        the Report on Resolving Climate Change-Related
        Disputes through Arbitration and ADR, a practical
        toolkit to streamline climate-related disputes
        expected to grow in the coming years. 2020 marks
        the 100th anniversary of the Commission on
        Arbitration and ADR, established shortly after ICC
        was founded in 1919.

                                International Chamber of Commerce (ICC) - Dispute Resolution 2019 Statistics
ICC DISPUTE RESOLUTION 2019 STATISTICS - Global Arbitration News
6    /        Key moments in 2019

                                                          5

                                                            The ICC Note to Parties and Arbitral Tribunals
                                                            announced that awards made as from 1 January
                                                            2019 may be published subject to the provisions
                                                            set out in the Note, unless any party objected. This
                                                            pioneer step will result in a significant number of
                                                            ICC awards being published in the years to come,
                                                            increasing transparency in commercial arbitration
                                                            and international trade and facilitating the
                                                            development of trade worldwide, in line with ICC’s
                                                            founding mission.

6

    In 2019, the new ICC DRS App was launched,
    bringing dispute resolution services closer to
    users worldwide. The App makes essential
    resources (Rules, practice notes, etc.) available
    anytime and anywhere, provides an easy-to-
    use directory and costs calculator and enables
    professionals to stay connected for upcoming
    events in their region. During events, the App
    further enables participants to browse speaker
    presentations, chat in real-time with fellow
    participants, arrange face-to-face meetings and
    participate in live polls.

International Chamber of Commerce (ICC) - Dispute Resolution 2019 Statistics
ICC DISPUTE RESOLUTION 2019 STATISTICS - Global Arbitration News
7   /    Key moments in 2019

7
        270/80
In 2019, 270 thematic and regional events as
well as training and academic events were held
in 80 countries across the world. The year also
yielded great results on engagement with ICC
dispute resolution followers across the range of
ICC’s social media accounts, with close to 50,000
followers on dedicated LinkedIn, Facebook and
Twitter profiles.

                                                          8

                                                            The ICC Institute of World Business Law
                                                            celebrated its 40th anniversary. The celebratory
                                                            event was held in Paris at the occasion of the
                                                            biennial Institute Prize – open to anyone 40 years
                                                            of age or under, rewarding legal writing excellence
                                                            – and the Institute's annual conference. Established
                                                            in 1979, the ICC Institute now counts over 200
                                                            members from over 50 countries and works closely
                                                            with the ICC International Court of Arbitration
                                                            and ICC's Global Events team to offer capacity
                                                            building initiatives on a range of topics related to
                                                            international business law. This includes a series
                                                            of trainings that are interactive, give practical
                                                            guidance, and share and increase knowledge
                                                            among the participants.

                                  International Chamber of Commerce (ICC) - Dispute Resolution 2019 Statistics
ICC DISPUTE RESOLUTION 2019 STATISTICS - Global Arbitration News
8    /       Key moments in 2019

                                                          9
                                                            In February 2019, ICC enhanced the skills of the
                                                            next generation of mediator practitioners through
                                                            its annual International Commercial Mediation
                                                            Competition, bringing together 350 students and
                                                            coaches from over 30 countries to try out their
                                                            mediation skills during mock mediation sessions
                                                            with professional mediators.

10
      10k/38/34/46
    ICC also shares knowledge and best practices,
    and hosts brainstorming sessions with arbitration
    practitioners under the age of 40 through its
    Young Arbitrators Forum (YAF) network with
    over 10,000 members worldwide. The panel of
    appointed YAF representatives for the 2019-2021
    mandate is the most diverse yet in terms of region
    and gender with 38 women and 34 men from 46
    countries, reflecting ICC’s continuous effort to
    promote age, gender and geographical diversity in
    dispute resolution.

International Chamber of Commerce (ICC) - Dispute Resolution 2019 Statistics
ICC DISPUTE RESOLUTION 2019 STATISTICS - Global Arbitration News
9   /         International Court of Arbitration

INTERNATIONAL COURT OF ARBITRATION
                                                                     Geographical origins
    In 2019, 869 new arbitration
    cases were registered with the                                     Parties in the 2019 filings
    Secretariat of the ICC International                               came from 147 countries and
    Court of Arbitration (‘Secretariat’                                independent territories worldwide,
    and ‘ICC Court’, respectively), of                                 breaking ICC’s previous record of
    which 851 cases under the ICC                                      142 set in 2017.
    Rules of Arbitration1 and 18 under
    the ICC Appointing Authority                                                            5.2%
                                                                                         Sub-
                                                                                                   2.3%
                                                                                        Saharan North
    Rules.2 This is the second highest                                           8.2%    Africa Africa

    number of newly-registered cases                                           Central &
                                                                              East Europe
    behind the record figure of 966                                                                                    29.5%
                                                                                                                       North &
                                                                         9.1%                                         West Europe
    cases reached in 2016, with 135                                   North America
                                                                     (USA & Canada)
    related small-claim cases arising                                                           BREAKDOWN
                                                                                                OF PARTIES BY
    from a collective dispute.                                                                     REGION
                                                                         10.8%
                                                                         Central &
                                                                         West Asia
As of end 2019, 1,694 pending cases were being
administered by the ICC Court, with over 25,000 cases
                                                                                     15.5%                        19.4%
having been administered since it was established in                            Latin America               South & East Asia
                                                                                 & Caribbean                 and The Pacific
1923.

                                                                      TABLES
Parties                                                               Most frequent nationalities among parties
                                                                      See annex - table 01, page 21
Out of the 2,498 parties involved in cases filed in
2019, 49% were claimants and 51% respondents.                         Nationalities represented by region
                                                                      See annex - table 02, pages 21-23
Approximately a third of the cases involved multiple
parties (31%), of which the majority (59%) involved
                                                                     Africa
several respondents, 24% several claimants, and 17%
several claimants and respondents. Although most                     A total of 188 parties from 33 African countries
multiparty cases involved three to five parties (87% of              represented 7.5% of all parties to ICC Arbitration.
multiparty cases), cases involving six to ten parties
                                                                     The most represented nationalities among Sub-
represented a significant 11% of multiparty cases. Three
                                                                     Saharan African parties (130 parties) and North
cases involved 10 to 30 parties while in two cases the
                                                                     African parties (58 parties) were Egypt (20 parties),
number of parties exceeded 100.
                                                                     Nigeria (19 parties), Algeria (17 parties), Ivory Coast
                                                                     (16 parties), South Africa (13 parties), Morocco
                                 59%                                 (11 parties), and Mauritius (10 parties).
                           INVOLVED SEVERAL
                             RESPONDENTS
                                                                     Americas
         31%
     OF CASES FILED                                                  As in previous years, parties from the Americas in 2019
    IN 2019 INVOLVED
    MULTIPLE PARTIES
                                       24%                           accounted for roughly 25% of the overall number of
                                 INVOLVED SEVERAL
                                    CLAIMANTS                        parties in ICC Arbitration.

                                                                     The USA maintains its first position with 196 parties
                                  17%                                (8% of all parties worldwide).
                           INVOLVED SEVERAL
                       CLAIMANTS & RESPONDENTS                       The Latin America and Caribbean region saw a 14%
                                                                     increase in the number of parties which rose from 339
                                                                     to 386 (an approximate 15% of all parties, as in previous
                                                                     years).
1. ICC Rules of Arbitration (in force as from 1 March 2017).
2. Rules of ICC as Appointing Authority in UNCITRAL or Other
   Arbitration Proceedings (in force as from 1 January 2018).

                                             International Chamber of Commerce (ICC) - Dispute Resolution 2019 Statistics
ICC DISPUTE RESOLUTION 2019 STATISTICS - Global Arbitration News
10   /      International Court of Arbitration

Brazil, the most represented nationality among parties        In 2019, ICC Arbitration was particularly selected for
from Latin America and the Caribbean (35%), maintains         domestic disputes between parties coming from Brazil
third place in the worldwide nationality ranking with         (20 cases), the USA (19), the United Arab Emirates (15),
133 parties, following the USA (196 parties) and India        Mexico (13), Saudi Arabia (12) and France (10).
(147 parties).3
                                                              State and state-owned parties
Asia & the Pacific
Approximately 30% of parties in ICC Arbitration came            In 2019, 20% of new cases
from Asia and the Pacific.
                                                                involved a state or state entity.
Chinese parties rose from 59 to 105, moving up from             This figure represents an
11th to fifth position of the most frequent nationalities.4
                                                                important 67% increase in the
2019 saw a significant 57% increase in the number               number of states and state-owned
of parties from South and East Asia and the Pacific
                                                                parties in ICC Arbitrations over the
that reached 484 parties (from 309 in 2018) and now
representing approximately 20% of the overall number            past five years and sets a new all-
of parties worldwide.                                           time ICC record.
The number of Indian parties tripled and reached 147
in 2019. Ranked 15th in 2018 with just 47 parties, India      The group of 212 state and state-owned parties
now ranks second on the overall number of parties             comprised 42 states and 170 state-owned parties from
worldwide. Over half of the cases involving Indian            all parts of the world. The proportion of state and state-
parties are being administered by the Secretariat’s case      owned parties varied, however, within regions. While
management office in Singapore.5                              state and state-owned parties represented 20% of the
                                                              overall Sub-Saharan and North African parties, they
For the first time, one case recorded the involvement of      represented 10% to 20% of parties originating from Latin
two parties from Myanmar.                                     America and the Caribbean, Central and East Europe,
                                                              and Central and West Asia. The proportion of state
South Korea, the United Arab Emirates and Saudi
                                                              and state-owned parties was below 5% among parties
Arabia remain within the 15 most represented
                                                              originating from South and East Asia and the Pacific,
nationalities among parties in ICC Arbitration, followed
                                                              North and West Europe, and North America.
by Singapore and Qatar.

Europe                                                         TABLES

As in previous years, European parties represented             Number of states and state-owned parties by region
                                                               See annex - table 03, page 23
close to 40% of the total.

Among the parties originating from North and West
Europe (738), France takes the lead with 126 parties
in 2019, followed by 97 German parties, 87 Spanish
parties, 84 Italian parties, 78 parties from the United
Kingdom and 67 Swiss parties.
                                                              3. Since its establishment in October 2017, ICC’s case management
Parties from Central and East Europe (205) represented           team in Brazil has administered 83 cases – 26 cases involving
                                                                 29 state entities. Further, the State of São Paulo in Brazil,
8% of the total number of parties, with Turkey remaining         has classified the São Paulo office of the Secretariat, known
the most represented nationality within the region               as SCIAB, as a registered institution. This announcement
(47), followed by Russia (25), Poland and Romania                represents an important development, enabling ICC to continue
                                                                 administering arbitral proceedings involving the State of São
(19 each), Cyprus (18), Greece (15) and the Czech                Paulo.
Republic (14).                                                4. In addition to the Belt and Road Commission, established by
                                                                 the ICC Court in 2018 to drive the development of ICC’s existing
International vs domestic cases                                  procedures and infrastructure falling under China’s Belt and Road
                                                                 Initiative, ICC is now a confirmed authorised institution under
In 2019, disputes between parties of the same region             the China-Hong Kong Arrangement on interim relief. See on this
                                                                 Arrangement, the ICC Note on the Arrangement concerning
remained steady at 40% of all newly-registered cases             ICC Arbitrations seated in Hong Kong and Administered by the
while disputes between parties of the same nationality           Secretariat Asia Office.
accounted for 25% (i.e. 214 cases involved parties from       5. 130 cases are currently being administered by the Secretariat’s
the same country).                                               fourth overseas case management office in Singapore,
                                                                 established in April 2018.

International Chamber of Commerce (ICC) - Dispute Resolution 2019 Statistics
11      /                International Court of Arbitration

NUMBER OF STATES OR
STATE-OWNED PARTIES                                                                                    Arbitral tribunals
220
                                                                                                212
210
                                                                                                         2019 saw 1,476 appointments
200
190
                                                                                                         and confirmations of arbitrators,
180                                                                                                      which led to two new ICC records
170                                                                                                      in terms of diversity: first, the
160
                                                                                                         972 individuals appointed
150                                               150
140                                                                                                      or confirmed came from 89
130 127                                                                143
                                                                                                         countries; and second, 21% of all
                               123
120                                                                                                      arbitrators appointed or confirmed
110
                                                                                                         were women.6
     2015                    2016                 2017                2018                      2019
                                                                                                       Constitution of the arbitral tribunal
Investor-state disputes                                                                                In principle, arbitrators acting in ICC cases are either
                                                                                                       (i) nominated by the parties or co-arbitrators, or
In 2019, two cases were filed on the basis of bilateral
                                                                                                       selected in accordance with a specific mechanism
investment treaties (BITs). The proceedings were
                                                                                                       agreed by the parties, and then confirmed by the ICC
initiated by European investors against a state within
                                                                                                       Court or its Secretary General, or (ii) appointed by
Sub-Saharan Africa in the first case, and a state within
                                                                                                       the ICC Court either upon proposal of an ICC National
Central and East Europe in the second case. Since
                                                                                                       Committee or Group, or directly. In the vast majority of
1996, when the first BIT case was registered, to date,
                                                                                                       cases during 2019, arbitrators were nominated by the
ICC has administered 42 cases based on BITs.
                                                                                                       parties or the co-arbitrators (73%).

HOST STATES BY REGION IN ICC
INVESTMENT CASES 1996 TO DATE                                                                                           15%
                                                                                                                BY CO-ARBS
15

           13               12
10                                        11                                                                                  SELECTION OF
                                                                                                                              ARBITRATORS

5                                                                                                               27%
                                                                                                           BY COURT
                                                                                                                                                    58%
                                                                                                                                                    BY PARTIES

                                                         3              2
                                                                                      1
0
             Central &
       Eastern Europe

                         Latin America
                          & Caribbean

                                         North
                                         Africa

                                                     Sub-Saharan
                                                           Africa

                                                                      Central &
                                                                      West Asia

                                                                                      North &
                                                                                  West Europe

                                                                                                        TABLES
                                                                                                        Selection of arbitrators
                                                                                                        See annex - table 04, page 24

                                                                                                       6. The online searchable chart of ICC Arbitral Tribunals provides
                                                                                                          information on the names, nationality, role and method of
                                                                                                          selection of arbitrators, their status (active, replaced) as well
                                                                                                          as the status of the case (pending/closed) for cases registered
                                                                                                          as of 1 January 2016 and where Terms of Reference have been
                                                                                                          established. The chart is currently being expanded to include
                                                                                                          additional information regarding the industry sector involved and
                                                                                                          parties’ representatives in the case.

                                                                    International Chamber of Commerce (ICC) - Dispute Resolution 2019 Statistics
12   /      International Court of Arbitration

The parties agreed on the number of the arbitrators,
either in the arbitration agreement or subsequently,            To date, and since 2014 when the
in 86% of the cases. They opted for a three-member
                                                                practice to communicate reasons
tribunal in 65% of the cases and a sole arbitrator in
35% of the cases. The ICC Court fixed the number                for the ICC Court’s decisions to
of arbitrators in the remaining cases and did so by             the parties upon their request
submitting disputes to three-member arbitral tribunals          was first applied, the ICC Court
in 18% of the cases and to sole arbitrators in 82% of
the cases. Since 2017, the ICC Court has increasingly
                                                                has communicated reasons for 34
selected a sole arbitrator over a three-member arbitral         decisions, including 25 decisions
tribunal,7 which may be explained by the introduction           on the challenge of arbitrators.
of the Expedited Procedure Provisions (‘EPP’) and the
increasing number of cases with an amount in dispute
not exceeding US$ 2 million.8                                 In 2019, the ICC Court communicated reasons for 10
                                                              decisions, including seven on challenge of arbitrators,
As a result, 59% of all cases were submitted to a three-      two decisions on prima facie jurisdiction pursuant to
member arbitral tribunal and 41% to a sole arbitrator.        Article 6(4) and one decision on consolidation pursuant
                                                              to Article 10. As provided in the Note to Parties and
                                                              Arbitral Tribunals on the Conduct of the Arbitration,
                                                              any request for the communication of reasons ‘must
                                         41%
                                         SOLE
                                                              be made in advance of the decision in respect of which
                                         ABITRATOR            reasons are sought’.9
                     CONSTITUTION
                     OF TRIBUNALS                             CHALLENGES FILED/ACCEPTED
                        IN 2019
      59%                                                     2015-2019
      THREE
      MEMBER                                                  2019     6
      TRIBUNAL                                                                                       52
                                                                       7
                                                              2018                              45
                                                                       6
Before being confirmed or appointed, prospective              2017                                48
arbitrators are invited to complete a statement of                    5
                                                              2016                                   50
acceptance, availability, impartiality and independence.
As in previous years, approximately 32% of arbitrators        2015 3                  28
made disclosures before being confirmed or appointed.
                                                                       CHALLENGES
Once an arbitrator has been confirmed or appointed,                    ACCEPTED
objections to his or her impartiality, independence or                 CHALLENGES
                                                                       FILED
other aspects must be made by way of a challenge.
The number of challenges filed in 2019, whether
based on an alleged lack of impartiality, independence
or otherwise, amounted to 52, of which six were
accepted by the ICC Court. In the course of the year,
50 arbitrators resigned. A total of 58 replacements
were made, following the resignation or passing of an
arbitrator, the filing of a successful challenge, or at the
request of the parties. In addition, one sole arbitrator
was replaced on the ICC Court’s own initiative pursuant
to Article 15(2) of the Rules.
                                                              7. The Court decided to submit disputes to a three-member arbitral
                                                                 tribunal in 28% of cases in 2018 (32% of cases in 2017), and to a
                                                                 sole arbitrator in 72% of cases in 2018 (68% of cases in 2017).
                                                              8. In accordance with Article 2(1), Appendix VI to the ICC
                                                                 Arbitration Rules, ‘[t]he Court may, notwithstanding any contrary
                                                                 provision of the arbitration agreement appoint a sole arbitrator’.
                                                                 Cases not exceeding US$ 2 million represented 32.1% of the
                                                                 cases registered in 2017, 32.5% in 2018 and 36.3% in 2019.
                                                              9. Note to Parties and Arbitral Tribunals on the Conduct of the
                                                                 Arbitration, para. 16.

International Chamber of Commerce (ICC) - Dispute Resolution 2019 Statistics
13    /          International Court of Arbitration

   Geographical origins                                                 Gender diversity

      Arbitrators confirmed or                                             In 2019, the number of
      appointed in 2019 came from 89                                       appointments and confirmations
      jurisdictions – the highest number                                   of women arbitrators further
      of jurisdictions to date – reflecting                                rose to 312 (273 in 2018), now
      the continuous efforts of the ICC                                    representing 21% (18.4% in 2018)
      Court towards increasing diversity                                   of all appointments/confirmations.
      among ICC arbitral tribunals. New
      nationalities represented included                                Although the ICC Court generally appoints 25% to
      Azerbaijan, Botswana, Haiti,                                      30% of all arbitrators,10 the ICC Court appointed as
                                                                        many women arbitrators as the parties nominated:
      Malawi, the Palestinian authority,                                131 women were party-nominated (42% of all women
      and St Kitts and Nevis.                                           arbitrators), 134 women were appointed by the ICC
                                                                        Court (43% of all women arbitrators) and 45 women
                                2.0%                                    were nominated as president by co-arbitrators (14% of
                           Sub-Saharan
                              Africa                                    all women arbitrators). In addition, two women were
                        3.6%           1.6%                             nominated by other (arbitral) institutions to act as
                    Central &          North
                    West Asia          Africa                           arbitrators in an ICC Arbitration.
                    5.3%
            Central &
          East Europe

          9.0%
South & East Asia
  and The Pacific

                            BREAKDOWN OF
        10.0%               ARBITRATORS BY
 North America
(USA & Canada)
                                REGION                56.4%                                  ROLE OF WOMEN
                                                      North &                               APPOINTED IN 2019
                                                      West Europe

               12.1%
        Latin America
         & Caribbean
                                                                        30%
                                                                        ACTED AS PRESIDENT
   The top six nationalities of arbitrators acting in ICC
   Arbitrations as in previous years, are British with
                                                                        30%
                                                                        ACTED AS SOLE ARBITRATOR
   258 arbitrators (17.5%), Swiss with 147 arbitrators
   (10%), French with 116 arbitrators (7.9%), the USA                   40%
   with 107 arbitrators (7.3%), German with 87 arbitrators              ACTED AS CO-ARBITRATOR
   (5.9%) and Brazilian with 62 arbitrators (4.2%).
                                                                        While the number of women acting as co-arbitrators
   In line with the significant increase of Indian parties
                                                                        and sole arbitrator remained steady at around 40%
   (from 47 parties in 2018 to 147 parties in 2019), the
                                                                        and 30% respectively, the number of women acting as
   number of Indian arbitrators increased from
                                                                        president has increased to 30% over the last three years.
   16 arbitrators in 2018 (ranked 21th of the arbitrators’
   top nationalities) to 34 arbitrators in 2019 (ranked 13th
   of the arbitrators’ top nationalities) and now accounts
   for 40% of all arbitrators from South and East Asia.

     TABLES
     Most frequent nationalities
     See annex - table 05, page 24
     Breakdown by country of origin and status
     See annex - table 06, page 25                                      10. In 2019, the Court appointed 27% of all arbitrators, see section
                                                                            ‘Constitution of the arbitral tribunal’ above.

                                                International Chamber of Commerce (ICC) - Dispute Resolution 2019 Statistics
14    /     International Court of Arbitration

                                                            agreement: 90; by subsequent party agreement: 12;
  Out of all sole arbitrators                               fixed by the ICC Court: 13), compared to 72 in 2018. As
                                                            in previous years the top four ranking is completed by
  appointed or confirmed in 2019,
                                                            France (108), Switzerland (84) and the USA (49).
  33% were women, whereas 24%
  of presidents and 15% of co-                              Singapore, which was selected in 30 cases by the
                                                            parties and fixed twice by the ICC Court, remained the
  arbitrators were women.                                   most preferred seat in Asia. Singapore ranked fourth
                                                            among the most frequently selected individual cities,
PROPORTION OF WOMEN                                         following London (114), Paris (106) and Geneva (53).
IN EACH ROLE 2019
                                                            Brazil ranked sixth overall and remained the preferred
                                                            seat within Latin America and the Caribbean with
                                                            24 cases. The United Arab Emirates ranked seventh and
                                                            was the preferred seat within the MENA region with
                    33%
      24%                                                   21 cases.
                                       15%
                                                            In 2019, 11 arbitrations were seated in Sub-Saharan
   Presidents   Sole arbitrators   Co-arbitrators
                                                            Africa, compared to six in 2018: three each in Nigeria
                                                            and South Africa and one each in Angola, Botswana,
These figures illustrate the ICC Court’s commitment to
                                                            Kenya, Mauritius and Rwanda.
implementing gender diversity in arbitration. The ICC
Court itself has adopted full gender parity and currently   Although in the great majority of cases the place of
comprises 88 women and 88 men.11                            arbitration is chosen by the parties, the ICC Court fixes
                                                            the place of arbitration where parties fail to do so. In
 TABLES                                                     2019, the Court exercised this function in just 10% of all
                                                            cases.
 Breakdown of men/women arbitrators appointed
 or confirmed by region (2010-2019)
 See annex - table 07, pages 26-27                                                           1.6%
                                                                                       Sub-Saharan
                                                                                          Africa
                                                                                      3.2%          1.1%
                                                                               Central &        North
Age                                                                          East Europe        Africa

In 2019, the average age of arbitrators confirmed or                           6.6%
                                                                        Central &
appointed by the ICC Court was 56.7 years. In total,                    West Asia
34% of the individuals confirmed or appointed as                        7.8%
arbitrators were below the age of 50.                        North America
                                                            (USA & Canada)
Arbitrators appointed by the Court (directly or
                                                                                        BREAKDOWN
following a proposal by an ICC National Committee)                  9.8%                OF PLACES BY
were, as in previous years, approximately five years
                                                            Latin America
                                                             & Caribbean                   REGION                     58.2%
                                                                                                                      North &
younger (51.5 years).                                                                                                 West Europe

The average age of women acting as arbitrators in ICC
Arbitrations was 50.5 years, and women appointed by
                                                                          11.7%
                                                              South & East Asia
the Court were, approximately five years younger                and The Pacific

(46.7 years).

Places of arbitration                                        TABLES
                                                             Ten most selected cities
                                                             See annex - table 08, page 28
  In 2019, ICC Arbitrations were                             Countries selected as place of arbitration
  seated in 116 cities12 in 62                               See annex - table 09, page 28

  countries.

The most selected place of arbitration was London,          11. See the full list of Court members as of July 2018.
United Kingdom with 114 cases. Overall, the United          12. Under the Rules, the place of arbitration must be a city. For the
Kingdom was selected in 115 cases (in the arbitration           purposes of this report, places of arbitration are grouped per
                                                                country.

International Chamber of Commerce (ICC) - Dispute Resolution 2019 Statistics
15   /     International Court of Arbitration

Choice of law                                               Amounts in dispute
Choice-of-law clauses were included in the substantive
contractual provisions relied upon by parties in 88% of       Over 50% of the cases filed
all cases registered in 2019. These covered the laws
                                                              with ICC in 2019 and 50% of the
of 124 nations, states, provinces and territories. As
in 2018, English law was the lex contractus in 16% of         pending cases at the end of 2019
all cases registered. Swiss law was the second most           had an amount in dispute between
selected applicable substantive law (12%), followed by        US$ 1 million and US$ 30 million.
the laws of a US state13 and French law (10% each). The
laws of Brazil, Qatar and Spain ranked fifth, sixth and
seventh with 34, 31 and 30 cases respectively.              The average amount in dispute in cases filed during
                                                            2019 was US$ 52 million, with the median being close
Only 1% of contracts provided for the application of
                                                            to US$ 4 million.
rules or instruments other than national laws in their
arbitration agreement or choice-of-law clause. These        The aggregate value of all pending disputes before the
included the UN Convention on Contracts for the             ICC Court at the end of 2019 was US$ 230 billion, with
International Sale of Goods, the UNIDROIT Principles        an average value of US$ 140 million and a median value
of International Commercial Contracts, ‘International       of US$ 10 million.
commercial law’, ‘OHADA Law’ and the ICC Incoterms®
rules. Such instruments are however sometimes               It is also worth noting that 36% of cases registered
applied in the course of the arbitration, per automatic     in 2019 (and 23% of the total caseload at the end of
application (UN Convention on Contracts for the             2019) involved an amount in dispute not exceeding
International Sale of Goods), contractual terms or          US$ 2 million, the threshold amount in dispute for
parties’ subsequent agreement.                              the automatic application of the EPP applicable to
                                                            arbitration agreements concluded after 1 March 2017.
Nature of the disputes
The cases filed in 2019 cover a wide range of                TABLES
sectors divided in more than 20 categories including         Amounts in dispute
agribusiness, alimentation, business services,               See annex - table 10, page 29
chemicals, construction and engineering, defence and
security, education and culture, energy, environmental
protection, financing and insurance, general trade
                                                            Expedited Procedure
and distribution, health/pharmaceuticals and                The significant proportion of lower-value cases in
cosmetics, industrial equipment and services, leisure       ICC Arbitration, as noted above, is indicative of
and entertainment, media and publishing, metals             the relevance and necessity of the ICC Expedited
and raw materials, packaging, public institutions           Procedure Provisions (Article 30 and Appendix VI of
and organisations, telecommunications/specialised           the ICC Arbitration Rules; ‘EPP’) which provide for a
technologies, textiles/clothing, and transportation.        streamlined arbitration ending with a final award within
                                                            six months of the case management conference under
Disputes within the sectors of construction/engineering
                                                            reduced scales of arbitrator fees.14
(211 cases) and energy (140) generated the largest
number of ICC Arbitration cases and, as in previous         The EPP apply automatically in cases where the
years, account for approximately 40% of the ICC             arbitration agreement was concluded post 1 March
Arbitration caseload.                                       2017 and the global amount in dispute does not
                                                            exceed US$ 2 million, unless the parties have explicitly
Sectors related to general trade and distribution,
                                                            opted out. Parties may also expressly opt in to the
industrial equipment and services, financing and
                                                            EPP regardless of the amount in dispute or date of
insurance, health/pharmaceuticals and cosmetics,
                                                            conclusion of the arbitration agreement. The figures of
telecoms and specialised technologies and
                                                            opt-in requests reflect the need, suitability and success
transportation range between 4% to 7% of the new
                                                            of the procedure. In 2017, of the 46 opt-in requests
cases.

                                                            13. The contracts applying the laws of US states referred to the laws
                                                                of 12 states, with New York law selected in half of the contracts.
                                                            14. The cost calculator for ordinary and expedited procedures is
                                                                available online and on the ICC DRS App.

                                    International Chamber of Commerce (ICC) - Dispute Resolution 2019 Statistics
16     /        International Court of Arbitration

filed, 12 were agreed to by the other party(ies); in 2018,
of the 96 opt-in requests filed, 22 were agreed to by the      In 2019, the ICC Court approved
other party(ies); and in 2019, of the 50 opt in requests
                                                               586 awards, (145 partial awards,
filed, 21 were agreed to by the other party(ies).
                                                               397 final awards and 44 awards
OPT-IN REQUESTS FILED/AGREED TO BY
                                                               by consent). The figure is slightly
OTHER PARTY(IES) 2017-2019                                     lower than the record of 599
                 21
                                                               awards reached in 2018.
2019                              50
                 22
2018                                                   96
           12
2017                         46
                                                                                                        44
       AGREED TO BY                                                                                     BY CONSENT
       OTHER PARTY(IES)
       OPT-IN REQUESTS
       FILED                                                                                            145
                                                                                                        PARTIAL AWARDS
                                                                    TYPES OF AWARDS

In 2019, the EPP applied by direct operation of the                                                     397
Rules in 65 cases. Parties agreed to opt out from the                                                   FINAL AWARDS
EPP in five cases. In 2019, the ICC Court decided
whether to apply, or continue to apply, the EPP in
12 cases taking into consideration a party’s objection,
                                                             The vast majority of draft awards were approved
the amount in dispute, the date of contract, or the
                                                             subject to certain points raised for the consideration of
complexity of the case.
                                                             arbitral tribunals. Only five draft awards were approved
As of end 2019, 146 cases had been or were being             without any comments at all. A further 72 draft awards
conducted under the EPP. Of the 50 final awards              were not approved when first scrutinised by the ICC
rendered in expedited proceedings, 37 were rendered          Court and were returned to the arbitral tribunal for
within the six-month time limit as from the case             further consideration.
management conference pursuant to Article 4(1),
                                                             In 2019, 80 applications for correction and/or
Appendix VI to the Rules. Among the delayed cases,
                                                             interpretation of awards were filed pursuant to
the delay for submitting the final award exceeded one
                                                             Article 36 of the Rules, 54 of which led to the
month in 10 cases: in three of those cases, the delay
                                                             subsequent correction or interpretation of the award.
was due to justified circumstances; in four cases, the
                                                             When rejecting the other 26 requests, tribunals
parties agreed to a new procedural timetable; and
                                                             sometimes added to their original awards an order
in three of those cases the delay resulted in a fee
                                                             relating to the costs of the correction/interpretation
reduction for the arbitrator(s).15 The scrutiny of all
                                                             proceedings.
50 awards was made within the two to three weeks
prescribed by the Note16 and within 11 days on               In 2019, a case was remitted to the arbitral tribunal
average.                                                     pursuant to Article 36(4) of the Rules in order to
                                                             reflect the corrected amount agreed to by the parties,
Awards                                                       following an order from a UK Court.
All draft awards are submitted to the ICC Court for
scrutiny and approval prior to notification to the           Languages of awards
parties. The Rules provide the Court with discretion         Awards approved in 2019 were drafted in a total of 12
to lay down modifications as to form and draw the            languages. English remains the predominant language
tribunal’s attention to points of substance when             (79% of awards). The other languages were French
scrutinising draft awards.                                   (42 awards), Spanish (32), Portuguese (20), German
                                                             (seven), followed by Romanian (five), two each in

                                                             15. Note to Parties and Arbitral Tribunals on the Conduct of the
                                                                 Arbitration, para. 127.
                                                             16. Note to Parties and Arbitral Tribunals on the Conduct of the
                                                                 Arbitration, para. 135.

International Chamber of Commerce (ICC) - Dispute Resolution 2019 Statistics
17   /      International Court of Arbitration

Italian, Greek and Chinese, and one each in Hebrew,           Since 2016, when this practice aiming at more
Turkish and Korean. In addition, bilingual awards were        efficiency in the submission of draft awards was
rendered in English/Romanian (two awards), English/           implemented, the rate of untimely submission of draft
Portuguese (two) and English/Greek (one).                     awards has decreased from 54% in 2016 to 40% in 2019.
                                                              Figures also show a reduction of the most important
Awards rendered by majority/dissenting opinions               delays. The number of draft awards delayed by three
Pursuant to Article 32(1) of the Rules, ‘when the arbitral    to six months decreased from 52 (in 2016) to 33 (in
tribunal is composed of more than one arbitrator, an          2019), and instances where awards reached a delay of
award is made by a majority decision’. Of the 311             seven months or more went from 18 (in 2016) to five
partial and final awards rendered by three-member             (in 2019). Accordingly, most delays in the submission
tribunals, 29 awards (9%) were rendered by majority.          of draft awards ranged from just a few days to less than
Of these, 28 were accompanied by a dissenting                 three months.
opinion, incorporated in the award itself in nine cases
and made by way of a separate document in 19 cases.
                                                              Emergency Arbitrator proceedings
                                                              Since their introduction in 2012 until 1 March 2019, the
The dissenting arbitrator was a co-arbitrator nominated
                                                              ICC Emergency Arbitrator Rules have enabled parties
by a party in 24 awards and remained unidentified
                                                              to apply 120 times for ‘Emergency Measures’ and
in five cases. In two cases, two separate dissenting
                                                              receive a decision within a 15-day time limit and prior
opinions were submitted on different issues (by each of
                                                              to the constitution of an arbitral tribunal (Article 29 and
the co-arbitrators in one case, and by one co-arbitrator
                                                              Appendix V to the Rules).
and one unidentified arbitrator in the other).
                                                              While half of the Emergency Arbitrator (‘EA’)
Length of proceedings                                         applications were in the construction/engineering
The average duration of proceedings in cases that             and energy sectors, other disputes related to
reached a final award was 26 months, compared to              chemical industry, general trade and distribution,
28 months in 2018, and is calculated on the basis of          health and pharmaceuticals, industrial equipment,
all said cases, including those where the proceedings         telecommunications/specialised technologies,
were suspended by the parties for any length of time.         transportation, and leisure and entertainment.
The median duration of proceedings was 22 months,
compared to 24 months in 2018.
                                                                In the course of 2019, 23 EA
Delays
                                                                applications were filed, involving
The Note to Parties and Arbitral Tribunals on the
Conduct of the Arbitration provides that (i) sole               parties of 29 nationalities and six
arbitrators are expected to submit draft awards within          multi-party cases (with as many
two months, and (ii) three-member arbitral tribunals            as eight responding parties in one
within three months after the last substantive hearing
on matters to be decided in the award or the filing of
                                                                case). Five cases involved states
the last written submissions concerning such matters            or state entities as respondents in
(excluding cost submissions), whichever is later.17 Under       commercial disputes.
the expedited procedure, draft awards are expected
within five months from the case management
conference.18

Untimely submission of draft awards may cause
a reduction of arbitrators’ fees unless the delay is
attributable to factors beyond the arbitrators’ control.19
In 2019, of the 162 draft final awards submitted to the
ICC Court for scrutiny beyond the above timeframe,
a fee reduction was applied in 68 cases (i.e., where
the delay was considered significant and the Court            17. Note to Parties and Arbitral Tribunals on the Conduct of the
was not satisfied that the delay was attributable to              Arbitration, para. 119.

factors beyond the arbitrators’ control or to exceptional     18. Note to Parties and Arbitral Tribunals on the Conduct of the
                                                                  Arbitration, para. 125.
circumstances).
                                                              19. The timeframe and fee reduction rates are set out at paras. 121
                                                                  (ordinary procedure) and 127 (expedited procedure) of the Note.

                                      International Chamber of Commerce (ICC) - Dispute Resolution 2019 Statistics
18   /      International Court of Arbitration

The recently published ICC Commission on Arbitration
and ADR Report ‘Emergency Arbitrator Proceedings’
provides an analysis of the first 80 ICC EA cases,
with contributions from ICC National Committees
on the status of EA proceedings under local law and
contributions from other arbitral institutions on their
respective EA mechanisms.20

ICC as Appointing Authority
Under the Rules of ICC as Appointing Authority in
UNCITRAL or Other Arbitration Proceedings (the
‘Appointing Authority Rules’), the ICC Court may
decide on requests for appointment or challenges in
UNCITRAL, other institutional and ad hoc arbitration
proceedings, and provide a range of administrative
services as requested by interested parties. Such
services include maintaining the file, assisting the
parties with logistical arrangements for meetings and
hearings, assisting with the notification of documents
and correspondence, administering funds, proofreading
draft documents and acting as repository.21

In 2019, the ICC Court was called upon to act as
appointing authority on 18 occasions. Of these, 11
requests were for the appointment of an arbitrator in
ad hoc proceedings under the UNCITRAL Arbitration
Rules and five requests were for appointments in other
ad hoc proceedings. The ICC Court was requested
to administer funds in two other ad hoc arbitration
proceedings.

                                                          20. ICC Commission on Arbitration and ADR, Report on ‘Emergency
                                                              Arbitrator Proceedings’ (ICC Publication n°895). Also available
                                                              in the ICC Digital Library.
                                                          21. Rules of ICC as Appointing Authority in UNCITRAL or Other
                                                              Arbitration Proceedings (in force as from 1 January 2018).

International Chamber of Commerce (ICC) - Dispute Resolution 2019 Statistics
19   /        International Centre for ADR

THE INTERNATIONAL CENTRE FOR ADR
                                                                               In 2019, a total of 17 neutrals were either nominated by
  In 2019, the ICC International                                               the parties or appointed by the Centre. The neutrals,
                                                                               comprising seven women, came from Europe (Belgium,
  Centre for ADR (‘Centre’) received
                                                                               France, Germany, Ireland, the Netherlands, Switzerland,
  a total of 61 new cases registered                                           the United Kingdom), the Americas (Brazil, Mexico,
  under the Mediation Rules, Expert                                            United States) and Asia (India, Singapore).
  Rules, Dispute Board Rules and                                               Disputes were generated from a wide range of business
  DOCDEX Rules.                                                                sectors. Construction and engineering disputes were
                                                                               the most frequent, accounting for almost 20% of
                                                                               cases, followed by disputes relating to energy and
Mediation                                                                      telecommunication. In 2019, the value of disputes
In 2019, the Centre registered 35 new requests filed                           ranged from US$ 326,000 to US$ 216 million, thus
under the ICC Mediation Rules. The term ‘mediation’ as                         confirming the suitability of mediation for a wide range
used in the Mediation Rules includes not only mediation                        of disputes, including high‑value disputes. The costs
but any other amicable settlement technique or                                 of proceedings in which mediators were appointed
combination of techniques that the parties may prefer.                         (covering ICC administrative expenses and the fees and
In 2019, apart from one request for conciliation, parties                      expenses of the neutral) were US$ 14,504 on average.
consistently opted for mediation.

Cases in 2019 involved 97 parties from 34 countries                            Expertise
and independent territories. European parties were                             A total of 16 requests for services related to experts
predominant in 2019, representing 51% of all parties.                          were filed with the Centre in 2019. Of these, seven
Countries accounting for the highest number of parties                         concerned the proposal of experts, seven the
were France, the United Kingdom, Italy and Germany.                            appointment of experts, and two the administration
                                                                               of expert proceedings. One request for the proposal
Four parties were states or state entities and originated
                                                                               of an expert was made by an ICC arbitral tribunal (for
from the MENA region.
                                                                               which the service is provided free of charge); all other
                                                                               requests were filed by parties.
Origin of the parties in ICC Mediation
                                                                               Three of the requests for expert appointment were
                                                                  % of total
                                                         No. of      no. of    made for the appointment of dispute board members.22
 Region/country                                         parties     parties
                                                                               The 41 parties involved in the 2019 filings came from
 Africa                                                                        20 countries. As in previous years, the largest demand
 Ghana (2 parties), Senegal
                                                             3          3%
                                                                               for the Centre’s expert services came from European
                                                                               parties.
 Americas
 USA (5 parties), Canada (3 parties), Brazil (3            14         15%      Five states or state entities from different continents
 parties), Argentina, Cayman Islands, Colombia
                                                                               requested the services of the Centre in relation to
                                                                               experts.
 Asia & Pacific
 India (5 parties), UAE (5 parties), Laos (4
 parties), Singapore (2 parties), Israel (2 parties),
 Oman (2 parties), Qatar (2 parties), Australia,
                                                           30         31%
 China, Saudi Arabia, Hong Kong, Indonesia, Iraq,
 Macau, Yemen

 Europe
 France (13 parties), United Kingdom (11
 parties), Italy (8 parties), Germany (8 parties),         50         51%
 Netherlands (4 parties), Sweden, Denmark,
 Spain, Belgium, Finland, Norway

 Total                                                     97       100%

                                                                               22. The Centre may appoint dispute board members either under
                                                                                   the ICC Expert Rules or the ICC Dispute Board Rules.

                                              International Chamber of Commerce (ICC) - Dispute Resolution 2019 Statistics
20   /        International Centre for ADR

Geographical origins of parties in ICC Expertise                      DOCDEX
                                                         % of total
                                                                      ICC DOCDEX is a rapid, document-based dispute
                                                No. of      no. of    resolution service for trade finance. It was initially
 Region/country                                parties     parties
                                                                      designed for letters of credit, but has since been
 Africa                                                               extended to include other instruments, undertakings
 Egypt (2 parties), Ethiopia, Libya, Morocco        7        17%
 (3 parties)                                                          and agreements related to trade finance.24 For
                                                                      proceedings under the DOCDEX Rules, the Centre
 Americas
                                                    5        12%      appoints experts in documentary credits, collections
 Ecuador (2 parties), Peru (2 parties), USA
                                                                      and demand guarantees.
 Asia & Pacific
                                                                      In 2019, six requests, involving a total of 12 parties,
 Qatar, Saudi Arabia, South Korea, United           9        22%
 Arab Emirates (6 parties)                                            were filed with the Centre for a DOCDEX decision.
                                                                      Traditionally, the use of the service has been stronger in
 Europe                                                               Asia, which was confirmed in 2019 where a majority of
 Albania (3 parties), Austria, Belgium                                the parties came from Asia, and 25% of the parties from
 (2 parties), France (2 parties), Germany,        20         49%      Europe.
 Hungary, Italy, Netherlands (7 parties),
 Turkey (2 parties)                                                   Disputes are decided by a panel of three experts,
 Total                                            41       100%       usually of different nationalities, appointed by the
                                                                      Centre under the DOCDEX Rules. As an illustration
                                                                      of ICC’s broad expert network, among the 15 experts
The 2019 filings led to the proposal or appointment of                appointed in 2019, eight originated from Europe
14 experts originating from Argentina, Belgium, Chile,                (Czech Republic, Denmark, Ireland, the Netherlands,
Germany, Italy, the Netherlands, Turkmenistan and the                 Spain, Switzerland), three from Asia (Chinese Taipei,
United Kingdom.                                                       Singapore), three from the Americas (Canada, United
                                                                      States) and one from Africa (South Africa).
Requests related to expert services under the ICC
Expert Rules covered various business sectors. The
majority of the requests filed in 2019 related to
technical expertise (often overlapping with financial
expertise), and in the remaining cases, parties sought
financial and/or legal expertise. As in other areas of ICC
dispute resolution, the highest demand came from the
construction and energy sectors.

Dispute Boards
Under the 2015 ICC Dispute Board Rules and upon the
parties’ request, the Centre may appoint dispute board
('DB') members, decide on challenges filed against DB
members, review their decisions and fix their fees. Since
October 2018, ICC also acts as the dispute settlement
body to decide on challenges filed against a Dispute
Adjudication/Avoidance Boards ('DAAB') member
under the FIDIC 2017 suite of contracts.23

The ICC Dispute Board Rules, which provide for a
‘Model Dispute Board Member Agreement’, may
be applied without recourse to ICC. However, the
administrative services listed above to facilitate the
application of the Rules are provided exclusively by the
ICC ADR Centre. In 2019, four requests were filed for                 23. See the Appendix III to the ICC Dispute Board Rules, in force as
                                                                          from 1 October 2018; see also 'ICC to decide DAAB challenges
the appointment of DB members on the basis of an
                                                                          under 2017 FIDIC contracts'.
agreement referring to the ICC Rules.
                                                                      24. Some of the expert decisions rendered under the ICC DOCDEX
                                                                          Rules are published in 'Collected DOCDEX Decisions 2013-2016’
                                                                          (ICC Publication n°786), and are also available in the ICC Digital
                                                                          Library (Trade Finance).

International Chamber of Commerce (ICC) - Dispute Resolution 2019 Statistics
21    /        Annex – Tables

Parties
Table 01 Most frequent nationalities among parties                   Table 02 Nationalities represented by region

                                                                     Africa

                                                                                                        Claimants

                                                                                                                    Respondents

                                                                                                                                   Total
                                        parties
                                        Number of

                                                    filings
                                                    in all 2019
                                                    of parties
                                                    % of total no.
 Country of origin
                                                                      Country/Territory
USA                                    196           7.85%
                                                                      Algeria                           6           11            17
India                                  147           5.88%            Egypt                            10           10            20
Brazil                                 133           5.32%            Libya                             2            2             4
France                                 126           5.04%            Mauritania                        1            0             1
                                                                      Morocco                           7            4            11
China*                                 105           4.20%
                                                                      Tunisia                           1            4             5
Germany                                 97           3.88%
                                                                      North Africa                                                58
Spain                                   87           3.48%
Italy                                   84           3.36%            Angola                             1           3              4
United Arab Emirates                    78           3.12%            Burkina Faso                       0           1              1
United Kingdom                          78           3.12%            Cameroon                           4           3              7
                                                                      Congo Dem. Republic                1           3              4
Switzerland                             67           2.68%
                                                                      Congo Republic                     1           0              1
South Korea                             57           2.28%            Cote d’Ivoire                      1          15             16
Saudi Arabia                            56           2.24%            Ethiopia                           1           4              5
Mexico                                  51           2.04%            Gabon                              2           1              3
Netherlands                             48           1.92%            Ghana                              3           2              5
                                                                      Guinea                             1           0              1
Turkey                                  47           1.88%
                                                                      Kenya                              5           1              6
Singapore                               35           1.40%
                                                                      Liberia                            1           0              1
Qatar                                   33           1.32%            Malawi                             0           1              1
Canada                                  32           1.28%            Mali                               1           1              2
Belgium                                 29           1.16%            Mauritius                          5           5             10
                                                                      Mozambique                         0           9              9
Japan                                   28           1.12%
                                                                      Namibia                            0           2              2
Peru                                    27           1.08%
                                                                      Niger                              0           1              1
Israel                                  26           1.04%            Nigeria                            9          10             19
Russian Federation                      25           1.00%            Seychelles                         0           1              1
                                                                      Sierra Leone                       1           1              2
* Including Hong Kong and Macau.
                                                                      South Africa                       4           9             13
                                                                      Sudan                              0           1              1
                                                                      Tanzania                           2           4              6
                                                                      Togo                               2           0              2
                                                                      Uganda                             2           1              3
                                                                      Zambia                             3           1              4
                                                                      Sub-Saharan Africa                                          130

                                                                      Africa                                                      188

                                   International Chamber of Commerce (ICC) - Dispute Resolution 2019 Statistics
22   /        Annex – Tables

Americas                                                              Asia & the Pacific

                                   Claimants

                                               Respondents

                                                              Total

                                                                                                                    Claimants

                                                                                                                                 Respondents

                                                                                                                                                Total
 Country/Territory
                                                                          Country/Territory
 Canada                           16           16             32
                                                                          Afghanistan                               1            2               3
 USA                             103           93            196
                                                                          Bahrain                                   2            4               6
 North America                                               228
                                                                          Georgia                                   2            7               9
                                                                          Iran                                      7            2               9
 Argentina                         7           13             20
                                                                          Iraq                                      1            6               7
 Bahamas                           1            2              3
                                                                          Israel                                   15           11              26
 Barbados                          1            0              1
                                                                          Jordan                                    2            3               5
 Belize                            0            2              2
                                                                          Kazakhstan                                4            0               4
 Bermuda                           2            1              3
                                                                          Kuwait                                    5            2               7
 Bolivia                           1            2              3
                                                                          Lebanon                                   6            7              13
 Brazil                           69           64            133
                                                                          Oman                                      2            6               8
 British Virgin Islands           11            6             17
                                                                          Palestinian Authority                     0            1               1
 Cayman Islands                    5            5             10
                                                                          Qatar                                    13           20              33
 Chile                             4            2              6
                                                                          Saudi Arabia                             20           36              56
 Colombia                         13            8             21
                                                                          Syria                                     1            0               1
 Costa Rica                        3            1              4
                                                                          United Arab Emirates                     46           32              78
 Curaçao                           0            1              1
                                                                          Uzbekistan                                0            1               1
 Dominica                          2            2              4
                                                                          Yemen                                     2            0               2
 Dominican Republic                0            3              3
                                                                          Central & West Asia                                                  269
 Ecuador                           1            0              1
 El Salvador                       0            1              1
                                                                          Australia                                11             8             19
 Guatemala                         8            4             12
                                                                          Bangladesh                                9             2             11
 Haiti                             0            2              2
                                                                          Cambodia                                  1             1              2
 Honduras                          1            0              1
                                                                          China*                                   54            51            105
 Jamaica                           0            2              2
                                                                          Chinese Taipei                            3             1              4
 Mexico                           21           30             51
                                                                          Fiji                                      0             1              1
 Panama                           11            8             19
                                                                          India                                    24           123            147
 Paraguay                          1            1              2
                                                                          Indonesia                                 8             6             14
 Peru                             15           12             27
                                                                          Japan                                    12            16             28
 Uruguay                           4            2              6
                                                                          Malaysia                                  7            10             17
 St Kitts and Nevis                0            1              1
                                                                          Maldives                                  0             1              1
 Trinidad and Tobago               3            3              6
                                                                          Myanmar                                   1             1              2
 Venezuela                         6           18             24
                                                                          Nepal                                     0             1              1
 Latin America & Caribbean                                   386
                                                                          New Zealand                               7             2              9
                                                                          Pakistan                                  3             3              6
 Americas                                                    614
                                                                          Philippines                               3             2              5
                                                                          Singapore                                20            15             35
                                                                          South Korea                              24            33             57
                                                                          Sri Lanka                                 1             2              3
                                                                          Thailand                                  7             3             10
                                                                          Vietnam                                   2             5              7
                                                                          South & East Asia and Pacific                                        484

                                                                          Asia & Pacific                                                       753

                                                                      *    38 from Mainland China (9 claimants, 29 respondents); 21 from
                                                                           Hong Kong (11 claimants, 10 respondents).

International Chamber of Commerce (ICC) - Dispute Resolution 2019 Statistics
23   /        Annex – Tables

Europe

                               Claimants

                                           Respondents

                                                          Total

                                                                                                   Claimants

                                                                                                                                 Respondents

                                                                                                                                                       Total
 Country/Territory                                                 Country/Territory
 Andorra Principality       0               1              1
 Austria                    9               4             13       Albania                          0                         2                   2
 Belgium                   17              12             29       Belarus                          1                         0                   1
 Channel Islands            1               7              8       Bosnia & Herzegovina             0                         3                   3
 Denmark                    4               5              9       Bulgaria                         2                         2                   4
 Finland                    7               6             13       Croatia                          4                         0                   4
 France                    58              68            126       Cyprus                          10                         8                  18
 Germany                   49              48             97       Czech Republic                   9                         5                  14
 Iceland                    0               1              1       Greece                          11                         4                  15
 Ireland                   12               4             16       Hungary                          4                         4                   8
 Italy                     42              42             84       Kosovo                           1                         2                   3
 Liechtenstein              3               0              3       Latvia                           0                         2                   2
 Luxembourg                12              11             24       Macedonia                        0                         1                   1
 Malta                      4               0              4       Moldova                          2                         0                   2
 Monaco                     1               0              1       Montenegro                       0                         1                   1
 Netherlands               28              20             48       Poland                           9                        10                  19
 Norway                     2               0              2       Romania                          8                        11                  19
 Portugal                   6              10             16       Russian Federation              18                         7                  25
 Spain                     42              45             86       Serbia                           3                         1                   4
 Sweden                     8               4             12       Slovakia                         1                         3                   4
 Switzerland               43              24             67       Slovenia                         2                         1                   3
 United Kingdom            43              35             78       Turkey                          24                        23                  47
 North & West Europe                                     738       Ukraine                          1                         5                   6
                                                                   Central & East Europe                                                        205

                                                                   Europe                                                                       943

                                                                  Table 03 Number of states and state-owned
                                                                  parties by region
                                                                                                               parties
                                                                                                               and parastatal
                                                                                                               Number of state

                                                                                                                                                from the region
                                                                                                                                                % of all parties

                                                                   Region

                                                                   Sub-Saharan Africa                                 31                       23.8%
                                                                   North Africa                                       12                       20.7%
                                                                   Latin America & Caribbean                          73                       18.9%
                                                                   Central & East Europe                              28                       13.7%
                                                                   Central & West Asia                                29                       10.8%
                                                                   South & East Asia and Pacific                      20                        4.1%
                                                                   North & West Europe                                18                        2.4%
                                                                   North America                                         1                      0.4%

                           International Chamber of Commerce (ICC) - Dispute Resolution 2019 Statistics
24   /         Annex – Tables

Arbitral tribunals

Table 04 Selection of arbitrators
                                    Sole arbitrators

                                                       tribunals
                                                       three-member
                                                       Co-arbitrators in

                                                                           tribunals
                                                                           three-member
                                                                           Presidents of

                                                                                                 Total
  Nominations by parties,
  confirmed by Court/Secretary      72                     749                   33          854
  General
  Nominations by co-arbitrators,
  confirmed by Court/Secretary     N/A                   N/A                  225            225
  General
  Appointments by Court upon
  proposal from ICC National       150                         22                66          238
  Committee or Group
  Appointments directly by
  Court                             57                         35                65          157
  Appointments by an authority
  other than the Court                1                            0                1             2
  Total                            280                     806                390 1476

Table 05 Most frequent nationalities
                                                       confirmations
                                                       appointments/
                                                       Number of

                                                                                        confirmations
                                                                                        appointments/
                                                                                        number of
                                                                                        % of total

 Country of origin

 United Kingdom                                           258                           17.48%
 Switzerland                                              147                            9.96%
 France                                                   116                            7.86%
 USA                                                      107                            7.25%
 Germany                                                   87                            5.89%
 Brazil                                                    62                            4.20%
 Canada                                                    40                            2.71%
 Italy                                                     39                            2.64%
 Austria                                                   38                            2.57%
 Belgium                                                   38                            2.57%
 Spain                                                     38                            2.57%
 Mexico                                                    36                            2.44%
 India                                                     34                            2.30%
 Austria                                                   33                            2.24%
 Singapore                                                 26                            1.76%
 Lenanon                                                   25                            1.69%
 Greece                                                    22                            1.49%
 Netherlands                                               21                            1.42%
 Argentina                                                 20                            1.36%
 Egypt                                                     18                            1.22%
 Portugal                                                  16                            1.08%
 Ireland                                                   15                            1.02%

International Chamber of Commerce (ICC) - Dispute Resolution 2019 Statistics
25   /    Annex – Tables

Table 06 Breakdown by country of origin and status

                           arbitrator
                           Sole

                                         arbitrator
                                         Co-

                                                      of tribunal
                                                      President

                                                                     Total

                                                                                                     arbitrator
                                                                                                     Sole

                                                                                                                  arbitrator
                                                                                                                  Co-

                                                                                                                               of tribunal
                                                                                                                               President

                                                                                                                                               Total
 Algeria                      0             1            0            1      Malaysia                   1           2             0            3
 Argentina                    4            12            4           20      Mali                       1           0             0            1
 Australia                   10            18           10           38      Mauritius                  0           0             1            1
 Austria                      7            14           12           33      Mexico                     7          19            10           36
 Azerbaijan                   1             0            0            1      Morocco                    0           1             0            1
 Belgium                      9            15           14           38      Netherlands                4          10             7           21
 Bolivia                      0             2            0            2      New Zealand                3           2             4            9
 Botswana                     0             1            0            1      Nigeria                    6           4             2           12
 Brazil                       2            42           18           62      Norway                     1           0             1            2
 Burkina Faso                 0             1            0            1      Pakistan                   0           1             0            1
 Cameroon                     0             1            0            1      Palestine                  0           1             0            1
 Canada                      14            11           15           40      Panama                     0           7             3           10
 Chile                        1             4            3            8      Peru                       0           5             1            6
 China                        3             5            1            9      Poland                     3           3             1            7
 Colombia                     1             7            6           14      Portugal                   3           9             4           16
 Costa Rica                   0             3            0            3      Qatar                      0           2             0            2
 Croatia                      0             1            0            1      Romania                    4           6             0           10
 Cuba                         0             1            0            1      Russian Federation         1           5             0            6
 Cyprus                       1             1            1            3      Saudi Arabia               0           2             0            2
 Czech Republic               2             6            1            9      Senegal                    0           1             0            1
 Denmark                      1             0            2            3      Singapore                 13           7             6           26
 Dominican Republic           0             2            0            2      Slovak Republic            0           1             0            1
 Ecuador                      1             0            0            1      Slovenia                   2           0             0            2
 Egypt                        2            13            3           18      South Africa               2           5             1            8
 El Salvador                  0             0            1            1      South Korea                0           6             0            6
 Finland                      0             8            0            8      Spain                      5          23            10           38
 France                      31            48           37          116      Sri Lanka                  0           1             0            1
 Germany                     18            42           27           87      St Kitts & Nevis           0           2             0            2
 Greece                       4            13            5           22      Sweden                     2           4             4           10
 Guatemala                    0             2            0            2      Switzerland               24          73            50          147
 Haiti                        0             0            1            1      Syria                      0           5             0            5
 Hungary                      0             1            0            1      Tanzania                   0           1             0            1
 India                        6            22            6           34      Thailand                   0           1             0            1
 Indonesia                    0             2            0            2      Togo                       0           1             0            1
 Iran                         0             6            0            6      Tunisia                    2           1             1            4
 Iraq                         1             0            0            1      Turkey                     1           8             2           11
 Ireland                      4             6            5           15      Ukraine                    0           4             0            4
 Israel                       0             1            6            7      United Arab Emirates       0           1             0            1
 Italy                        8            20           11           39      United Kingdom            37         166            55          258
 Jamaica                      0             2            1            3      Uruguay                    0           2             0            2
 Japan                        1             1            0            2      USA                       14          68            25          107
 Jordan                       0             1            1            2      Venezuela                  0           1             1            2
 Lebanon                     11             4           10           25      Zambia                     0           1             0            1
 Lithuania                    1             1            0            2      Total of nominations/
 Luxembourg                   0             2            0            2      appointments            280          806          390           1476
 Malawi                       0             1            0            1

                                        International Chamber of Commerce (ICC) - Dispute Resolution 2019 Statistics
26   /     Annex – Tables

Table 07 Breakdown of men/women arbitrators
appointed or confirmed by region

 Region                   Year    Men       Women          Region                  Year    Men       Women

 North Africa            2010    20   95%   1    5%        Latin America &
                                                                                   2010 112    95%   6    5%
                                                           Caribbean
                         2011     9   75%   3    25%
                                                                                   2011 100    94%   6    6%
                         2012    11   92%   1    8%
                                                                                   2012 120    93%   9    7%
                         2013    15   94%   1    6%
                                                                                   2013 120    89%   15   11%
                         2014     9   90%   1    10%
                                                                                   2014 123    94%   8    6%
                         2015    11   73%   4    27%
                                                                                   2015 169    91%   16   9%
                         2016    18   86%   3    14%
                                                                                   2016 145    88%   19   12%
                         2017    31   91%   3    9%
                                                                                   2017 165    82%   36   18%
                         2018    23   92%   2    8%
                                                                                   2018 167    84%   31   16%
                         2019    20   83%   4    17%
                                                                                   2019 148    83%   30   17%
 Sub-Saharan Africa      2010    19 100%    0    0%
                                                           Central & West Asia     2010   42   95%   2    5%
                         2011    20   91%   2    9%
                                                                                   2011   55   85%   10   15%
                         2012    12   92%   1    8%
                                                                                   2012   43   90%   5    10%
                         2013    31 100%    0    0%
                                                                                   2013   49   89%   6    11%
                         2014    27   96%   1    4%
                                                                                   2014   40   87%   6    13%
                         2015    17 100%    0    0%
                                                                                   2015   40   83%   8    17%
                         2016    10   83%   2    17%
                                                                                   2016   46   84%   9    16%
                         2017    23   96%   1    4%
                                                                                   2017   43   68%   20   32%
                         2018    18   86%   3    14%
                                                                                   2018   61   80%   15   20%
                         2019    25   83%   5    17%
                                                                                   2019   33   62%   20   38%
 North America           2010 130     90%   15   10%
                                                           South & East Asia and
                         2011 133     87%   19   13%                               2010   97   98%   2    2%
                                                           Pacific
                         2012 113     89%   14   11%
                                                                                   2011   94   95%   5    5%
                         2013 111     88%   15   12%
                                                                                   2012 109    92%   9    8%
                         2014 157     92%   13   8%
                                                                                   2013 153    97%   4    3%
                         2015 158     91%   15   9%
                                                                                   2014   96   88%   13   12%
                         2016 193     86%   32   14%
                                                                                   2015 102    91%   10   9%
                         2017 114     82%   25   18%
                                                                                   2016 109    89%   14   11%
                         2018 139     84%   27   16%
                                                                                   2017 123    87%   18   13%
                         2019 110     75%   37   25%
                                                                                   2018 112    89%   14   11%

                                                                                   2019 119    90%   13   10%

International Chamber of Commerce (ICC) - Dispute Resolution 2019 Statistics
27   /    Annex – Tables

Region                  Year    Men       Women

North & West Europe     2010 729    93%   58   7%

                        2011 756    94%   46   6%

                        2012 715    93%   51   7%

                        2013 666    91%   63   9%

                        2014 684    90%   78   10%

                        2015 635    90%   67   10%

                        2016 617    86% 103    14%

                        2017 679    85% 119    15%

                        2018 634    81% 146    19%

                        2019 656    79% 177    21%
Central & East Europe   2010   86   88%   12   12%

                        2011   71   86%   12   14%

                        2012   76   86%   12   14%

                        2013   65   81%   15   19%

                        2014   62   87%   9    13%

                        2015   45   74%   16   26%

                        2016   64   70%   27   30%

                        2017   61   69%   27   31%

                        2018   57   62%   35   38%

                        2019   53   67%   26   33%

                                International Chamber of Commerce (ICC) - Dispute Resolution 2019 Statistics
28      /   Annex – Tables

Places of arbitration

Table 08 Ten most frequently selected cities

                                                                                             the parties
                                                                                             chosen by
                                                                                             Place

                                                                                                           by the Court
                                                                                                           Place fixed

                                                                                                                           Total
                          Number of            % of all places of
 City                        cases                   arbitration

 London                       114                          17.1%      Country

 Paris                        106                          15.9%      India                     12            1            13
 Geneva                        53                           8.0%      Ireland                    1            0             1
 Singapore                     32                           4.8%      Israel                     5            0             5
 New York                      27                           4.1%      Italy                      3            0             3
 Zurich                        27                           4.1%      Japan                      2            2             4
 Madrid                        15                           2.3%      Kenya                      0            1             1
 Hong Kong                     14                           2.1%      Kuwait                     0            1             1
 São Paulo                     14                           2.1%      Luxembourg                 2            0             2
 Doha                          12                           1.8%      Mauritius                  0            1             1
 Dubai                         12                           1.8%      Mexico                    13            0            13
                                                                      Morocco                    1            0             1
                                                                      Netherlands                4            1             5
Table 09 Countries selected as place of arbitration
                                                                      Nigeria                    3            0             3
                                                                      Oman                       3            0             3
                              the parties
                              chosen by
                              Place

                                            by the Court
                                            Place fixed

                                                              Total

                                                                      Panama                     4            3             7
                                                                      Peru                       4            0             4
 Country                                                              Poland                     4            0             4
 Algeria                            2          0              2       Portugal                   5            0             5
 Angola                             1          0              1       Qatar                     10            2            12
 Argentina                          4          0              4       Romania                    3            0             3
 Australia                          3          0              3       Russian Federation         0            2             2
 Austria                            5          1              6       Rwanda                     0            1             1
 Belgium                            8          1              9       Saudi Arabia               1            1             2
 Bolivia                            1          0              1       Singapore                 30            2            32
 Botswana                           0          1              1       South Africa               3            0             3
 Brazil                            24          0             24       South Korea                6            0             6
 British Virgin Islands             1          0              1       Spain                     16            0            16
 Canada                             2          1              3       Sri Lanka                  2            0             2
 Chile                              1          0              1       Sweden                     6            1             7
 China (Mainland)                   2          0              2       Switzerland               76            8            84
 China (Hong Kong)                 13          1             14       Thailand                   1            0             1
 Colombia                           4          0              4       Tunisia                    1            0             1
 Croatia                            1          0              1       Turkey                     5            0             5
 Cyprus                             1          0              1       United Arab Emirates      18            3            21
 Denmark                            0          2              2       United Kingdom           102           13           115
 Egypt                              3          0              3       Uruguay                    3            0             3
 Finland                            3          0              3       USA                       46            3            49
 France                            97         11            108       Vietnam                    0            1             1
 Germany                           19          2             21
 Greece                             4          0              4
 Guatemala                          3          0              3
 Hungary                            1          0              1

International Chamber of Commerce (ICC) - Dispute Resolution 2019 Statistics
You can also read