Ice Ic without stacking disorder by evacuating hydrogen from hydrogen hydrate - Nature
←
→
Page content transcription
If your browser does not render page correctly, please read the page content below
ARTICLE
                  https://doi.org/10.1038/s41467-020-14346-5                OPEN

                  Ice Ic without stacking disorder by evacuating
                  hydrogen from hydrogen hydrate
                  Kazuki Komatsu 1*, Shinichi Machida2, Fumiya Noritake3,4, Takanori Hattori5, Asami Sano-Furukawa5,
                  Ryo Yamane1, Keishiro Yamashita1 & Hiroyuki Kagi1
1234567890():,;

                  Water freezes below 0 °C at ambient pressure ordinarily to ice Ih, with hexagonal stacking
                  sequence. Under certain conditions, ice with a cubic stacking sequence can also be formed,
                  but ideal ice Ic without stacking-disorder has never been formed until recently. Here we
                  demonstrate a route to obtain ice Ic without stacking-disorder by degassing hydrogen from
                  the high-pressure form of hydrogen hydrate, C2, which has a host framework isostructural
                  with ice Ic. The stacking-disorder free ice Ic is formed from C2 via an intermediate amorphous
                  or nano-crystalline form under decompression, unlike the direct transformations occurring in
                  ice XVI from neon hydrate, or ice XVII from hydrogen hydrate. The obtained ice Ic shows
                  remarkable thermal stability, until the phase transition to ice Ih at 250 K, originating from the
                  lack of dislocations. This discovery of ideal ice Ic will promote understanding of the role of
                  stacking-disorder on the physical properties of ice as a counter end-member of ice Ih.

                  1 Geochemical Research Center, Graduate School of Science, The University of Tokyo, 7-3-1 Hongo, Bunkyo-ku, Tokyo 113-0033, Japan. 2 Neutron Science and

                  Technology Center, CROSS, 162-1 Shirakata, Tokai, Naka, Ibaraki 319-1106, Japan. 3 Graduate Faculty of Interdisciplinary Research, University of Yamanashi,
                  4-3-11 Takeda, Kofu, Yamanashi 400-8511, Japan. 4 Computational Engineering Applications Unit, RIKEN, 2-1 Hirosawa, Wako, Saitama 351-0198, Japan. 5 J-
                  PARC Center, Japan Atomic Energy Agency, 2-4 Shirakata, Tokai, Naka, Ibaraki 319-1195, Japan. *email: kom@eqchem.s.u-tokyo.ac.jp

                  NATURE COMMUNICATIONS | (2020)11:464 | https://doi.org/10.1038/s41467-020-14346-5 | www.nature.com/naturecommunications                                  1
ARTICLE NATURE COMMUNICATIONS | https://doi.org/10.1038/s41467-020-14346-5
W
ater freezes below 0 °C at ambient pressure, ordinarily 400 b
to ice Ih with a hexagonal stacking sequence. However, VII
it is also known to produce “ice Ic” nominally with a sII C0 C2
cubic stacking sequence under certain conditions1, and its exis- 300 a c d
tence in Earth’s atmosphere2–4, or in comets5,6 is debated. “Ice g
C1
Ic”, or called as cubic ice, was first identified in 1943 by König7, lh
V
who used electron microscopy to study the condensation of ice III VI
T/K
200 VIII
from water vapor to a cold substrate. Subsequently, many dif- II
ferent routes to “ice Ic” have been established, such as the dis-
sociation of gas hydrates, warming amorphous ices or annealing
100 ƒ
high-pressure ices recovered at ambient pressure, freezing of μ- or e
nano-confined water (see ref. 1). Despite the numerous studies on
“ice Ic”, its structure has not been fully verified, because the dif-
fraction patterns of “ice Ic” show signatures of stacking 0
0.0 0.5 1.0 1.5 2.0 2.5 3.0 3.5
disorder1,8,9, and ideal ice Ic without stacking disorder had not
p/GPa
been formed until very recently10. This is the reason why “ice Ic”
is double-quoted1, and it is recently proposed that the stacking-
disordered ice should not be termed as ice Ic, but as ice Isd8.
“Ice Ic” (ice Isd) is known as a metastable form of ice at “Amorphous-like”
state
atmospheric pressure. But, recent computer simulations suggest
that even ice Isd could be the stable phase for crystallites up to
sizes of at least 100,000 molecules11. The stability of stacking- Ice Ic C2
disordered ices is extremely important because of the ubiquitous
nature of ice. Stacking-disordered ice can be characterized by the Fig. 1 Phase diagram of hydrogen hydrate and ice with experimental
degree of ice cubicity, χ, which is defined as the fraction of cubic paths in this study. Phase boundaries for hydrogen hydrates and ices are
stacking1,8,9,12,13. Until very recently, the highest cubicity was drawn using thick blue lines and thin black lines, respectively. Experimental
limited to ~80%8,14, but it has been reported that ideal ice Ic with p-T paths are shown as black arrows in alphabetical sequence from a to g.
100% cubicity has been obtained by annealing ice XVII10. The structural models for a high-pressure form of hydrogen hydrate, C2,
Recently new ice polymorphs, ice XVI15 and ice XVII16,17 are and ice Ic are schematically drawn with a newly found amorphous-like state
obtained by degassing gas molecules from neon and hydrogen as an intermediate transitional state from C2 to ice Ic. Red, white, and light
hydrates, respectively. From these findings, we hypothesized that blue balls in the structure model depict oxygen, hydrogen in water
ideal ice Ic could be obtained by degassing hydrogen from molecules, and hydrogen in guest molecules, respectively. Note that
hydrogen hydrate, C2. Five different phases in the H2–H2O sys- hydrogens in water molecules are disordered, so that two of four possible
tem have been reported to date (see ref. 18): Among them, neu- sites surrounding one oxygen are actually occupied.
tron diffraction experiments have never been conducted for the
higher-pressure phases, C1 and C2, probably due to the technical
difficulty in loading hydrogen into a pressure vessel, or com- 32e site (x, x, x)). The calculated diffraction pattern was in good
pressing it to pressures in the giga-pascal range. To synthesize agreement with the observed one, as shown in Fig. 2a. The refined
ideal ice Ic, decompression under low-temperature conditions for structural parameters are listed in Supplementary Table 1.
degassing is necessary, which is also not straight-forward using The sample was then cooled from 300 K to 100 K at around
conventional pressure-temperature controlling systems. We have 3 GPa (path d → e). In the diffraction pattern taken at e in Fig. 1,
developed a Mito system19, and have overcome these technical peaks from solid deuterium (phase I) appeared at around 200 K
difficulties (see details in Methods). (Supplementary Fig. 2), which is consistent with the known
Here we present the neutron and X-ray diffraction results melting curve of hydrogen20. This observation indicates that fluid
showing ice Ic without stacking disorder, obtained from degassing deuterium coexisted with C2 through the path from b to d.
hydrogen hydrate C2. We also report an unexpected amorphous- The C2 phase persisted at pressures at least as low as 0.5 GPa
like state in the transformation from C2 to ice Ic, and the thermal on decompression at 100 K (path e → f). However, surprisingly,
stability of ice Ic. the Bragg peaks of C2 mostly disappeared at 0.2 GPa (Fig. 3). This
phenomenon is totally unexpected, because the host structure of
gas hydrates retains its framework in the previous cases with ice
Results XVI15 and XVII16. The sample was further decompressed to
The route to obtain ice Ic. We started by using a mixture of D2O 0 GPa and evacuated using a turbo-molecular-pump. The broad
and MgD2, which is an internal deuterium source, to synthesize peaks corresponding to ice Ic appeared at this stage. The peak
hydrogen hydrate, C2. After loading the mixture into a pressure- disappearance of C2 before the appearance of ice Ic was
temperature controlling system, MgD2 was decomposed by reproducibly observed in at least two separate neutron runs and
heating at 403 K and at ca. 0 GPa for 1 h through a nominal one X-ray diffraction run for a hydrogenated sample (Supple-
reaction of MgD2 + 3D2O → Mg(OD)2 + 2D2 + D2O (at b in mentary Fig. 3). In the neutron diffraction pattern at 0.2 GPa,
Fig. 1, the observed neutron diffraction patterns are shown in except for the Bragg peaks from Mg(OD)2, only a broad peak was
Supplementary Fig. 1). Then, the samples were cooled to room observed at around d = 3.75 Å, which was between the peak
temperature (at c in Fig. 1) and typically compressed up to positions of 111 of C2 and that of Ice Ic (Fig. 3). This fact implies
~3 GPa until a C2 phase was observed (at d in Fig. 1). that this state does not have long-range periodicity like a normal
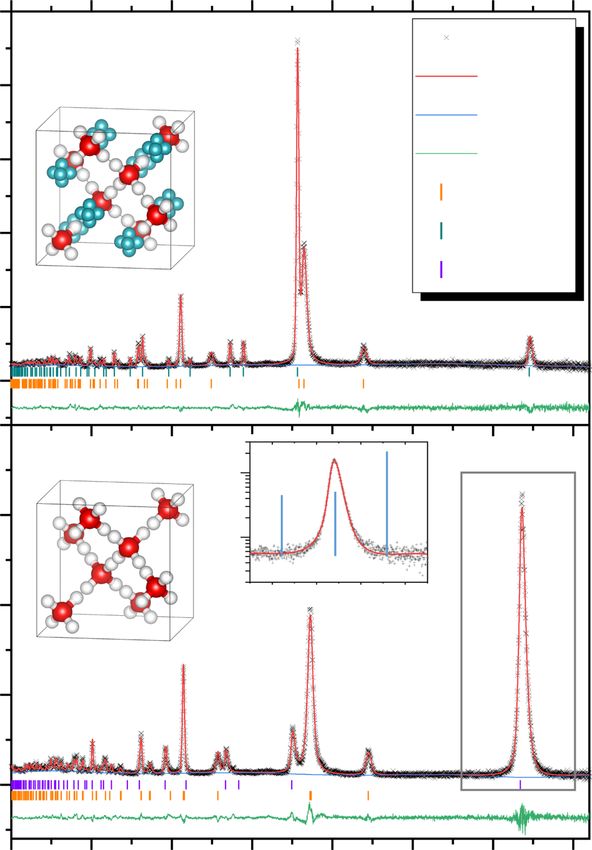
The neutron diffraction pattern for the C2 phase obtained at crystal, but has only local-ordering like an amorphous or nano-
3.3 GPa and 300 K (at d in Fig. 1) was analyzed by the Rietveld crystal. Considering the observed d-spacing, this amorphous-like
method. We adopted a splitting site model for guest D atoms form would be an intermediate transition state from C2 to ice Ic,
located at the 48f site (x, 1/8, 1/8), and the host structure was which forms while hydrogen molecules are partially degassed. It is
identical to ice Ic9 (Fd 3m, O at the 8b site (3/8, 3/8, 3/8), D at the highly likely that this apparent amorphization is derived from the
2 NATURE COMMUNICATIONS | (2020)11:464 | https://doi.org/10.1038/s41467-020-14346-5 | www.nature.com/naturecommunications
NATURE COMMUNICATIONS | https://doi.org/10.1038/s41467-020-14346-5 ARTICLE
Ice Ic
a Iobs
Mg(OD)2
C2
Icalc Ice Ic
Ibkg Mg(OD)2 Ih
Ih
Iobs-Icalc *
Intensity/a.u.
250 K
Mg(OD)2 240 K
200 K
C2
160 K
Ice Ic 0 GPa 130 K
0 GPa
0.2 GPa
0.5 GPa 100 K
C2 C2
Intensity/a.u.
2.0 2.5 3.0 3.5 4.0
d/Å
b ice Ic
Fig. 3 Neutron diffraction patterns showing the transformation from C2
to ice Ic. The patterns were obtained with decreasing pressure at 100 K
(path e → f) and with increasing temperature at 0 GPa (path f → g).
Corresponding temperatures and pressures are shown at the right side of
101 002 100 the respective patterns, and the arrows mean that temperature or pressure
3.4 3.6 3.8 4.0 kept constant. Most observed peaks are identified as C2, ice Ic, Mg(OD)2, or
ice Ih. The peak marked by an asterisk is a parasitic peak from the high-
pressure cell.
Structure refinement for ice Ic. We conducted a separate run in
order to obtain a neutron diffraction pattern for the structure
refinement of the ice Ic. In this run, the neutron diffraction
pattern was obtained at 130 K, which is well below the tem-
perature at which the nucleation of ice Ih occurs21. We confirmed
that the peak width did not change in the temperature region
0.5 1.0 1.5 2.0 2.5 3.0 3.5 4.0 from 130 K to 180 K, such that the peak sharpening was almost
d/Å complete, even at 130 K. The obtained neutron diffraction pattern
Fig. 2 Results of Rietveld analyses for neutron diffraction patterns. The
was well fitted using the ice Ic structure model9, as shown in
patterns of a hydrogen hydrate, C2, and b ice Ic were obtained at 3.3 GPa and
Fig. 2b and Supplementary Table 1. We also conducted the
300 K (at d in Fig. 1), and at 0 GPa and 130 K (in the path f → g). The inset
Rietveld analysis using C2 structure model, and found that the
diffraction pattern in b shows the expanded area for 111 reflections, shown as a
occupancy of the D2 site is zero, within experimental error (occ
box in the main figure, with logarithmic scale. The calculated peak positions of
(D2) = −0.001(1)). This shows that the guest hydrogen molecules
ice Ih are also shown as light blue lines with their indices in the inset. Structure
are below the detectable limit at 130 K under evacuation. The
models for C2 and ice Ic are also shown as insets in a and b, respectively.
peak profile around 111 peak of ice Ic has neither the feature of
stacking disorder nor the peaks from ice Ih, as shown in the
diffraction pattern in the region at around d = 3.9 Å, where the
lattice mismatch between C2 and ice Ic, originating from the strongest 100 reflection of ice Ih is expected (see inset in Fig. 2b,
relatively small cage in the host framework of the ice Ic structure. and more detailed discussion for the peak broadening for ice Ic is
From the X-ray diffraction run, ice Ic, which may partially described in Supplementary Note, Supplementary Table 2 and
include molecular hydrogen, even appeared at 0.1 GPa through Supplementary Fig. 4). This should be a clear indication of the
the transition from the C2 phase to the amorphous-like state, even presence of ideal ice Ic without stacking disorder (χ = 100%)13, as
under pressure (Supplementary Fig. 3). This also represents a clear as the recent discovery of ideal ice Ic by annealing ice
difference from the previous cases of ice XVI and XVII; ice XVI is XVII10.
formed under evacuation15, and hydrogen molecules can be
refilled into ice XVII at an order of 10 bar of pressure16. It is Thermal stability of ice Ic. It is also noteworthy that the ice Ic
worth noting that the partially degassed states are allowed in the surprisingly persists up to at least 240 K until ice Ih started to
cases of both ice XVI and XVII, so that the guest molecules can be appear at 250 K (Fig. 3). The temperature of 240 K corresponds to
continuously degassed from a fully occupied state to an empty the upper limit of the reported metastable region of “ice Ic” (ice
state. The observed phase-separation behavior even under Isd)1. However, in stacking-disordered ice, the cubic stacking
pressure in the ice H2-H2O system indicates that the partially sequence starts to change into a hexagonal stacking sequence at a
degassed C2 phase would be unstable compared to the fully much lower temperature, and the phase transition to ice Ih is
occupied or emptied phases, probably due to their lattice- completed at 240 K. The notable stability of the ice Ic would be
mismatch. derived from the lack of stacking disorder. The stacking-
The Bragg peaks in the neutron diffraction pattern for ice Ic disordered ice has more dislocations, which promote the phase
obtained at 100 K were still broad, probably due to the small transformation from ice Isd to ice Ih by reducing the activation
crystallite size and/or the remaining guest hydrogen molecules. energy required to change the stacking sequence22. This is also
The peaks of ice Ic sharpened with increasing temperature. This supported by a recent mesoscopic-size calculation23. Note here
sharpening is dependent not only on temperature but also on that the critical temperature of 240 K has been identified as the
time, which indicates that it is kinetic behavior. temperature above which ice Ih without cubic stacking faults
NATURE COMMUNICATIONS | (2020)11:464 | https://doi.org/10.1038/s41467-020-14346-5 | www.nature.com/naturecommunications 3ARTICLE NATURE COMMUNICATIONS | https://doi.org/10.1038/s41467-020-14346-5
forms spontaneously, which is the reason for the anomalous self- cloths were attached on the support rings of the anvils, and the cloths were placed
preservation regime of natural gas hydrates24. in contact with the cold head of the cryostat for thermal conduction. The accessible
minimum temperature of the hybrid Mito system is ~35 K, which may be the
The diffraction pattern observed at 250 K looks a mixture of current technical limitation due to an unavoidable influx of heat from the sur-
bulk ice Ic and Ih, rather than stacking-disordered ice with many rounding cell. The sample pressure was estimated from the observed lattice
stacking faults, judging from “stackogram” reported in the parameter of Mg(OD)2 brucite using the equation of states29 and the observed unit
literatures8,13. At 250 K, crystal growth would be dominant, cell volume of brucite at 0 GPa, assuming the temperature derivative of the bulk
rather than crystal nucleation. Therefore, once a crystallite modulus of brucite, dK/dT, was ~0. Although this assumption may cause some
error in the pressure estimated at low temperature, we placed emphasis on avoiding
nucleates, it quickly grows before other crystallites nucleate, unwanted Bragg peaks from additional sources of pressure marker. Moreover, the
resulting in the mixture of ice Ic and Ih, rather than stacking- error would be too small to affect the conclusion. The sample position was aligned
disordered ice. This observation also suggests a smaller number of by scanning to maximize the sample scattering intensity. The obtained intensities
dislocations in the ice Ic observed in this study. On the contrary, from the sample in the cell was subtracted by the intensity of the empty cell, and
subsequently normalized by the attenuation corrected intensity of vanadium pellet
the remarkable stability of the ice Ic and the bulk mixture of ice Ic in the cell, which was also subtracted by the intensity of the empty cell30. The
and Ih at 250 K strongly support the conclusion that the obtained Rietveld analyses were performed using the GSAS31 with EXPGUI32, and the
ice is not stacking-disordered, and it can therefore be called ice Ic crystal structure was drawn with the VESTA program33. The GSAS TOF profile
without the need for quotation marks. function 331 is used as the profile function in the Rietveld analyses.
The discovery of ideal ice Ic will allow us to research the real
physical properties of ice Ic without stacking disorder. For X-ray diffraction. Powder X-ray diffraction measurements using a H2O (Milli-Q)
and MgH2 (Wako pure chemical industries, Ltd.) mixture as starting materials
example, accurate heat capacity or vapor pressure measurements were performed at the beamline BL-18C in the Photon Factory (KEK, Tsukuba,
from low temperature will provide the free energy of ice Ic, which Japan). Samples were exposed to 0.6134 Å monochromatized synchrotron radia-
settle the long-standing argument for the thermodynamic tion, and the diffracted scattering was detected by an imaging plate (IP). The
stability of ice Ic compared to ice Ih. The physical properties of pressure was generated using CuBe alloy diamond-anvil cells and the temperature
was controlled using a 4 K GM cryostat (MiniStat, Iwatani Co.) equipped with a
the ideal ice Ic are also important to understand how stacking temperature controller (Model 335, Lakeshore). Sample pressure was estimated
disorder plays a role in the physical properties of ice Isd. For from the difference in the R1 line wavelengths of rubies inside and outside the
instance, since the thermal conductivity of ice Isd is significantly sample chamber34. The temperature was monitored using a Si-diode sensor
smaller than ice Ih25, the difference of thermal conductivities inserted in the cold head edge. We confirmed that the measured temperature was
almost the same as that of the diamond anvils after temperature stabilization. The
between ices Ih and Ic will emboss the effect of stacking disorder.
experimental p-T path was basically identical to the case of neutron diffraction, as
It is also interesting what will be happened when ice Ic is shown in Fig. 1, while the achieved pressure at path d was 4.1 GPa.
compressed under low temperature; whichever ice Ic will be One conically shaped Boehler-Almax type diamond-anvil35 with a 0.6 mm culet
transformed into HDA (High Density Amorphous ice26) or not? was placed in the direction of the detector with an opening angle of 2θ < 40°,
In any case, it is worth conducting what we previously did for ice whereas a conventional anvil with a 0.8 mm culet was positioned in the direction of
the X-ray source. A CuBe plate with a hole of diameter 0.3 mm and an initial
Ih, to this ideal ice Ic as well. thickness of 0.2 mm was used as a gasket. This gasket was not subjected to pre-
indentation. The load was applied by driving the piston by bellows using a He gas
Methods cylinder. The bellows allow us to control pressure at a few kbar more precisely than
Synthesis of MgD2. MgD2, used as the starting material in this study, was syn- conventionally used membranes.
thesized from reagent-grade MgH2 as follows. MgH2 powder (Wako pure chemical
industries, Ltd.) was purchased and further ground in an agate motor to increase DFT calculations. Quantum Espresso36 was used for the DFT calculations37,38. We
the surface area, after which it was placed in a copper tube with a diameter of 4 mm used Perdew-Burke-Ernzerhof (so-called PBE) type nonempirical exchange-
and a length of 40 mm. The tube was mechanically sealed and but not welded, correlation functions39 for this study. The pseudopotentials were derived using
allowing the transfer of hydrogen gas. The copper tube was inserted into a 1/4” projector augmented-wave approximation40. The dispersion effects were taken into
Inconel tube and connected in parallel to a deuterium gas cylinder and a turbo- account using the exchange-hole dipole moment method (XDM), which calculates
molecular pump (TMP) with 1/16” stainless tubes and stop bulbs. The Inconel coefficients for polynomial of DFT-D dispersion energy41 from the exchange-hole
tube, including the sample copper tube, was heated to 773 K for 1 h using a tube dipole moment calculated from simulated electron wave function42,43. XDM
furnace under evacuation using the TMP. Under these conditions, MgH2 com- damping function parameters are taken from44. The enthalpies of four possible
pletely decomposed to Mg and H227, and the degassed H2 was evacuated. Then, the configurations for the ordered form of ice Ic were calculated within a unit cell with
D2 gas was introduced up to 4 MPa, and the temperature was cycled at the rate of a kinetic energy cutoff of 70 Ry and a Brillouin zone k mesh of 8 × 8 × 8. The
1 K/min between 673 K and 773 K while keeping the pressure at 4 MPa, which cell parameters and atomic coordinates were optimized using BFGS quasi-
represents stable and unstable conditions for MgH227, and this temperature cycle Newtonian methods at atmospheric pressure.
was repeated for 20 times. This activation process is necessary for the reaction
Mg + D2 → MgD2. Finally, the p-T conditions were maintained at 673 K and 4
MPa for 3 days to complete the reaction. The recovered sample was analyzed by Data availability
powder X-ray diffraction (MiniFlex-II, Rigaku) and identified to be MgD2 with a The primary data that support the plots within this paper and other finding of this study
trace amount of MgO. Both MgD2 and MgO react with D2O and produce Mg are available from the corresponding author on reasonable request. The neutron
(OD)2, so this small amount of MgO does not affect the conclusion of this study. crystallographic coordinates for structures reported in this study have been deposited at
the Cambridge Crystallographic Data Centre (CCDC), under deposition numbers
1973757, 1973759. These data can be obtained free of charge from The Cambridge
Neutron diffraction and p-T control. Neutron powder diffraction experiments Crystallographic Data Centre via www.ccdc.cam.ac.uk/data_request/cif.
were conducted at the beamline PLANET28 in the Material and Life Science
Experiment Facility (MLF) of J-PARC, Ibaraki, Japan. The incident beam consists
of 25 Hz pulsed spallation neutrons produced from a liquid Hg target via a Received: 23 September 2019; Accepted: 3 January 2020;
decoupled moderator and traveled through collimators, choppers and supermirror
guides to the sample positioned at 25.0 m from the moderator28. Approx. 20 mg of
MgD2, synthesized as described above, was filled into TiZr null scattering gaskets,
and D2O water (99.9%, Wako pure chemical industries, Ltd.) was dropped on the
MgD2 powder, resulting in the molar ratio of MgD2:D2O~1:3. The gaskets were
sandwiched between a pair of tungsten carbide anvils, and loaded by using a hybrid
Mito system, which is a modified version of an original pressure-temperature References
variable Mito system19. The hybrid Mito system uses both flowing liquid nitrogen 1. Kuhs, W. F., Sippel, C., Falenty, A. & Hansen, T. C. Extent and relevance of
and a 4 K cryostat (RDK-415D, Sumitomo Heavy Industries, Ltd.), which allows us stacking disorder in “ice Ic”. Proc. Natl Acad. Sci. USA 109, 21259–21264 (2012).
to control temperature rapidly, owing to the large latent heat of liquid nitrogen and 2. Murphy, D. M. Dehydration in cold clouds is enhanced by a transition from
efficient thermal insulation by zirconia and GFRP seats. The hybrid Mito system cubic to hexagonal ice. Geophys. Res. Lett. 30, 2230 (2003).
also allows us to achieve temperatures below 77 K, and reach a minimum tem- 3. Riikonen, M. et al. Halo observations provide evidence of airborne cubic ice in
perature of ~35 K, owing to the cryostat. Another remarkable feature of the hybrid the Earth’s atmosphere. Appl. Opt. 39, 6080–6085 (2000).
Mito system is that it affords pressure control, even at low temperature, as well as 4. Whalley, E. Scheiner’s halo: evidence for ice Ic in the atmosphere. Science 211,
the original Mito system, which is indispensable for this study. Flexible copper 389–390 (1981).
4 NATURE COMMUNICATIONS | (2020)11:464 | https://doi.org/10.1038/s41467-020-14346-5 | www.nature.com/naturecommunicationsNATURE COMMUNICATIONS | https://doi.org/10.1038/s41467-020-14346-5 ARTICLE
5. Gronkowski, P. The search for a cometary outbursts mechanism: a 36. Paolo, G. et al. QUANTUM ESPRESSO: a modular and open-source software
comparison of various theories. Astronomische Nachrichten: Astronomical project for quantum simulations of materials. J. Phys. Condens. Matter 21,
Notes 328, 126–136 (2007). 395502 (2009).
6. Prialnik, D. & Bar-Nun, A. Crystallization of amorphous ice as the cause of 37. Hohenberg, P. & Kohn, W. Inhomogeneous electron gas. Phys. Rev. 136,
comet P/Halley’s outburst at 14 AU. Astron. Astrophys. 258, L9–L12 (1992). B864–B871 (1964).
7. König, H. Eine kubische Eismodifikation. Z. Kristallogr. Crsyt. Mater. 105, 279 38. Kohn, W. & Sham, L. J. Self-consistent equations including exchange and
(1943). correlation effects. Phys. Rev. 140, A1133–A1138 (1965).
8. Malkin, T. L. et al. Stacking disorder in ice I. Phys. Chem. Chem. Phys. 17, 39. Perdew, J. P., Burke, K. & Ernzerhof, M. Generalized gradient approximation
60–76 (2015). made simple. Phys. Rev. Lett. 77, 3865–3868 (1996).
9. Kuhs, W. F., Bliss, D. V. & Finney, J. L. High-resolution neutron powder 40. Kresse, G. & Joubert, D. From ultrasoft pseudopotentials to the projector
dffraction study of ice-Ic. J. Phys. 48, 631–636 (1987). augmented-wave method. Phys. Rev. B 59, 1758–1775 (1999).
10. del Rosso, L. et al. Cubic ice Ic without stacking defects obtained from ice 41. Grimme, S., Antony, J., Ehrlich, S. & Krieg, H. A consistent and accurate ab
XVII, Nat. Mater. https://doi.org/10.1038/s41563-020-0606-y (2020). initio parametrization of density functional dispersion correction (DFT-D) for
11. Lupi, L. et al. Role of stacking disorder in ice nucleation. Nature 551, 218 the 94 elements H-Pu. J. Chem. Phys. 132, 154104 (2010).
(2017). 42. Becke, A. D. & Johnson, E. R. Exchange-hole dipole moment and the
12. Malkin, T. L., Murray, B. J., Brukhno, A. V., Anwar, J. & Salzmann, C. G. dispersion interaction. J. Chem. Phys. 122, 154104 (2005).
Structure of ice crystallized from supercooled water. Proc. Natl Acad. Sci. USA 43. Becke, A. D. & Johnson, E. R. Exchange-hole dipole moment and the
109, 1041–1045 (2012). dispersion interaction revisited. J. Chem. Phys. 127, 154108 (2007).
13. Hansen, T. C., Sippel, C. & Kuhs, W. F. Approximations to the full description 44. Otero-de-la-Roza, A. & Johnson, E. R. Van der Waals interactions in solids
of stacking disorder in ice I for powder diffraction. Z. f.ür. Kristallographie using the exchange-hole dipole moment model. J. Chem. Phys. 136, 174109
230, 75–86 (2015). (2012).
14. Amaya, A. J. et al. How Cubic Can Ice Be? J. Phys. Chem. Lett. 8, 3216–3222
(2017).
15. Falenty, A., Hansen, T. C. & Kuhs, W. F. Formation and properties of ice XVI Acknowledgements
obtained by emptying a type sII clathrate hydrate. Nature 516, 231–233 We are grateful to Drs. J. Abe and K. Funakoshi for their assistance with the experiments,
(2014). and to anonymous reviewers for their valuable comments, particularly on the relation
16. del Rosso, L., Celli, M. & Ulivi, L. New porous water ice metastable at with anomalous preservation of gas hydrates. Neutron diffraction experiments were
atmospheric pressure obtained by emptying a hydrogen-filled ice. Nat. performed through the J-PARC user programs (Nos. 2014B0187, 2015A0033,
Commun. 7, 13394 (2016). 2017A0092, 2017B0031). X-ray diffraction experiments were performed under the
17. del Rosso, L. et al. Refined structure of metastable ice XVII from neutron approval of the Photon Factory Program Advisory Committee (Proposal Nos. 2016G107,
diffraction measurements. J. Phys. Chem. C. 120, 26955–26959 (2016). 2018G656). This study was supported by JSPS KAKENHI (Grant Numbers: 18H05224,
18. Donnelly, M. E., Teeratchanan, P., Bull, C. L., Hermann, A. & Loveday, J. S. 18H01936, 15H05829).
Ostwald’s rule of stages and metastable transitions in the hydrogen–water
system at high pressure. Phys. Chem. Chem. Phys. 20, 26853–26858 (2018). Author contributions
19. Komatsu, K. et al. Development of a new P–T controlling system for neutron- K.K. and S.M. conceived and designed the experiments. K.K., S.M., T.H., A.S-F., R.Y.,
scattering experiments. High. Press. Res. 33, 208–213 (2013). K.Y., and H.K. conducted the neutron diffraction experiments. K.K., R.Y., K.Y., and H.K.
20. Diatschenko, V. et al. Melting curves of molecular hydrogen and molecular conducted the X-ray diffraction experiments. F.N. carried out the DFT calculations and
deuterium under high pressures between 20 and 373 K. Phys. Rev. B 32, wrote the corresponding part of the manuscript. K.K. analyzed the data and wrote the
381–389 (1985). manuscript with contributions from all authors.
21. Hansen, T. C., Koza, M. M., Lindner, P. & Kuhs, W. F. Formation and annealing
of cubic ice: II. Kinetic study. J. Phys.: Condens. Matter 20, 285105 (2008).
22. Hondoh, T. Dislocation mechanism for transformation between cubic ice Ic Competing interests
and hexagonal ice Ih. Philos. Mag. 95, 3590–3620 (2015). The authors declare no competing interests.
23. Chan, H. et al. Machine learning coarse grained models for water. Nat.
Commun. 10, 379 (2019).
24. Kuhs, W. F., Genov, G., Staykova, D. K. & Hansen, T. Ice perfection and onset
Additional information
Supplementary information is available for this paper at https://doi.org/10.1038/s41467-
of anomalous preservation of gas hydrates. Phys. Chem. Chem. Phys. 6,
020-14346-5.
4917–4920 (2004).
25. Johari, G. P. & Andersson, O. Effects of stacking disorder on thermal
Correspondence and requests for materials should be addressed to K.K.
conductivity of cubic ice. J. Chem. Phys. 143, 054505 (2015).
26. Mishima, O., Calvert, L. D. & Whalley, E. ‘Melting ice’ I at 77 K and 10 kbar: a
Peer review information Nature Communications thanks John Loveday and the
new method of making amorphous solids. Nature 310, 393–395 (1984).
anonymous reviewer(s) for their contribution to the peer review of this work.
27. Crivello, J.-C. et al. Review of magnesium hydride-based materials:
development and optimisation. Appl. Phys. A 122, 97 (2016).
Reprints and permission information is available at http://www.nature.com/reprints
28. Hattori, T. et al. Design and performance of high-pressure PLANET beamline
at pulsed neutron source at J-PARC. Nucl. Instr. Meth. Phys. Res. A 780, 55–67
Publisher’s note Springer Nature remains neutral with regard to jurisdictional claims in
(2015).
published maps and institutional affiliations.
29. Horita, J., dos Santos, A. M., Tulk, C. A., Chakoumakos, B. C. & Polyakov, V.
B. High-pressure neutron diffraction study on H–D isotope effects in brucite.
Phys. Chem. Miner. 37, 741–749 (2010).
30. Komatsu, K. et al. Crystal structure of magnesium dichloride decahydrate Open Access This article is licensed under a Creative Commons
determined by X-ray and neutron diffraction under high pressure. Acta Attribution 4.0 International License, which permits use, sharing,
Crystallogr. B 71, 74–80 (2015). adaptation, distribution and reproduction in any medium or format, as long as you give
31. Larson, A. & Von Dreele, R. General Structure Analysis System (GSAS). Los appropriate credit to the original author(s) and the source, provide a link to the Creative
Alamos National Laboratory, Report LAUR-86-748 (2004). Commons license, and indicate if changes were made. The images or other third party
32. Toby, B. EXPGUI, a graphical user interface for GSAS. J. Appl. Crystallogr. 34, material in this article are included in the article’s Creative Commons license, unless
210–213 (2001). indicated otherwise in a credit line to the material. If material is not included in the
33. Momma, K. & Izumi, F. VESTA 3 for three-dimensional visualization of crystal, article’s Creative Commons license and your intended use is not permitted by statutory
volumetric and morphology data. J. Appl. Crystallogr. 44, 1272–1276 (2011). regulation or exceeds the permitted use, you will need to obtain permission directly from
34. Piermarini, G. J., Block, S., Barnett, J. D. & Forman, R. A. Calibration of the the copyright holder. To view a copy of this license, visit http://creativecommons.org/
pressure dependence of the R1 ruby fluorescence line to 195 kbar. J. Appl. licenses/by/4.0/.
Phys. 46, 2774–2780 (1975).
35. Boehler, R. & De Hantsetters, K. New anvil designs in diamond-cells. High.
Press. Res. 24, 391–396 (2004). © The Author(s) 2020
NATURE COMMUNICATIONS | (2020)11:464 | https://doi.org/10.1038/s41467-020-14346-5 | www.nature.com/naturecommunications 5You can also read