ICR Conference January 2021 - Seeking Alpha

Page created by Claude Nelson
 
CONTINUE READING
ICR Conference January 2021 - Seeking Alpha
Invest in
                                         Leadership
                                           Brands

                          Optimize                        Double
                           Capital                       Down on
                         Deployment                    International

                 Maximize                                         Selective

ICR Conference   Operating
                 Efficiency
                                                                 & Strategic
                                                                    M&A

January 2021
                          Accelerate                    Consumer
                        Shared Service                   Centric
                          Excellence
                                            Unify,
                                          Include &
                                         Elevate the
                                         Best People
ICR Conference January 2021 - Seeking Alpha
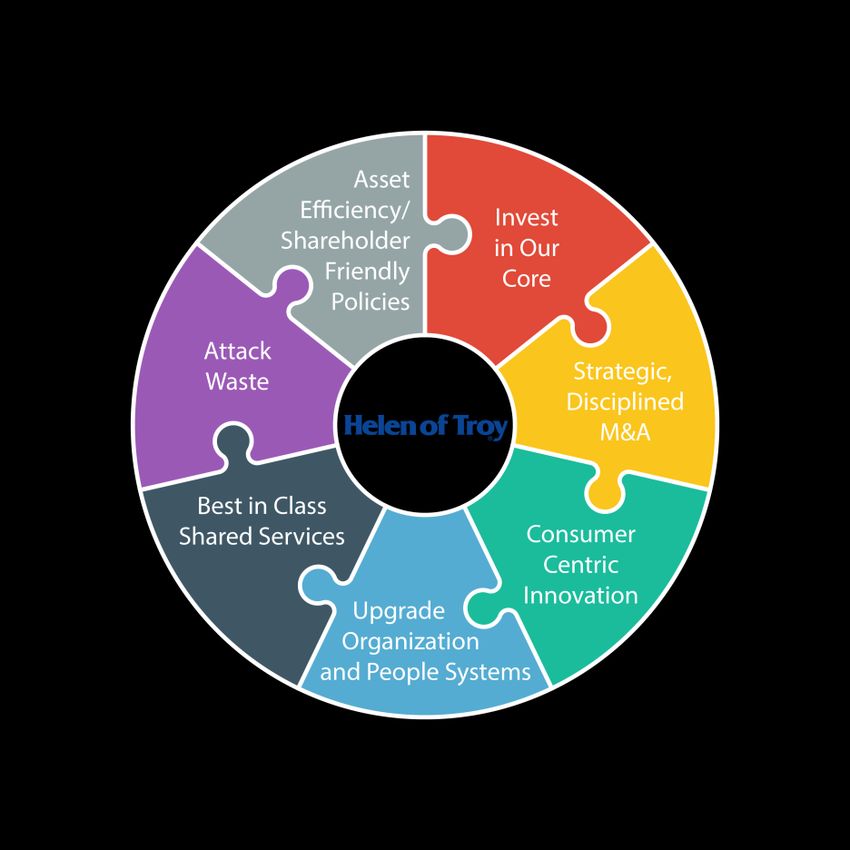
Forward Looking Statements and Reconciliation of Non-GAAP Financial Measures

Forward Looking Statements:
                                                                                                                                     foreign sources of supply and foreign manufacturing, and associated operational risks including, but not limited to, long
Certain written and oral statements made by the Company and subsidiaries of the Company may constitute “forward-looking
                                                                                                                                     lead times, consistent local labor availability and capacity, and timely availability of sufficient shipping carrier capacity,
statements” as defined under the Private Securities Litigation Reform Act of 1995. This includes statements made in this
                                                                                                                                     the impact of changing costs of raw materials, labor and energy on cost of goods sold and certain operating expenses,
presentation. Generally, the words “anticipates”, “believes”, “expects”, “plans”, “may”, “will”, “should”, “seeks”, “estimates”,
                                                                                                                                     the risks associated with significant tariffs or other restrictions on imports from China or any retaliatory trade measures
“project”, “predict”, “potential”, “continue”, “intends”, and other similar words identify forward-looking statements. All
                                                                                                                                     taken by China, the risks associated with the geographic concentration and peak season capacity of certain U.S.
statements that address operating results, events or developments that the Company expects or anticipates will occur in the
                                                                                                                                     distribution facilities, our projections of product demand, sales and net income are highly subjective in nature and future
future, including statements related to sales, earnings per share results, and statements expressing general expectations
                                                                                                                                     sales and net income could vary in a material amount from such projections, the risks associated with the use of
about future operating results, are forward-looking statements and are based upon its current expectations and various
                                                                                                                                     trademarks licensed from and to third parties, our ability to develop and introduce a continuing stream of new products
assumptions. The Company believes there is a reasonable basis for these expectations and assumptions, but there can be
                                                                                                                                     to meet changing consumer preferences, trade barriers, exchange controls, expropriations, and other risks associated
no assurance that the Company will realize these expectations or that these assumptions will prove correct. Forward-
                                                                                                                                     with U.S. and foreign operations, the risks to our liquidity as a result of changes to capital market conditions and other
looking statements are subject to risks that could cause them to differ materially from actual results. Accordingly, the
                                                                                                                                     constraints or events that impose constraints on our cash resources and ability to operate our business, the risks
Company cautions readers not to place undue reliance on forward-looking statements. The forward-looking statements
                                                                                                                                     associated with product recalls, product liability, other claims, and related litigation against us and the risks associated
contained in this presentation should be read in conjunction with, and are subject to and qualified by, the risks described in
                                                                                                                                     with changes in regulations or product certifications.
the Company’s Form 10-K for the year ended February 29, 2020, and in the Company's other filings with the SEC. Investors
are urged to refer to the risk factors referred to above for a description of these risks. Such risks include, among others, our
                                                                                                                                     Reconciliation of Non-GAAP Financial Measures:
ability to successfully manage the demand, supply and operational challenges associated with the actual or perceived
effects of COVID-19 and any similar future public health crisis, pandemic or epidemic, our ability to deliver products to our        This presentation includes non-GAAP financial measures. Adjusted operating income, adjusted operating margin,
customers in a timely manner and according to their fulfillment standards, the costs of complying with the business demands          adjusted income, adjusted diluted earnings per share, free cash flow, and free cash flow per diluted share (“Non-GAAP
and requirements of large sophisticated customers, our dependence on the strength of retail economies and vulnerabilities            Financial Measures”) that are discussed in this presentation or in the accompanying tables may be considered non-
to any prolonged economic downturn, including from the effects of COVID-19, our relationships with key customers and                 GAAP financial information as contemplated by SEC Regulation G, Rule 100. Accordingly, the Company is providing
licensors, our dependence on sales to several large customers and the risks associated with any loss or substantial decline          the tables within this presentation which reconcile these measures to their corresponding GAAP-based measures. The
in sales to top customers, expectations regarding recent, pending and future acquisitions or divestitures, including our ability     Company believes that these non-GAAP measures provide useful information to management and investors regarding
to realize anticipated cost savings, synergies and other benefits along with our ability to effectively integrate acquired           financial and business trends relating to its financial condition and results of operations. The Company believes that
businesses or separate divested businesses, circumstances which may contribute to future impairment of goodwill,                     these non-GAAP financial measures, in combination with the Company’s financial results calculated in accordance with
intangible or other long-lived assets, the retention and recruitment of key personnel, the costs, complexity and challenges of       GAAP, provide investors with additional perspective regarding the impact of certain charges/benefits on applicable
upgrading and managing our global information systems, the risks associated with cybersecurity and information security              income, margin and earnings per share measures. The Company also believes that these non-GAAP measures
breaches, the risks associated with global legal developments regarding privacy and data security could result in changes to         facilitate a more direct comparison of the Company’s performance with its competitors. The Company further believes
our business practices, penalties, increased cost of operations, or otherwise harm our business, risks associated with               that including the excluded charges/benefits would not accurately reflect the underlying performance of the Company’s
foreign currency exchange rate fluctuations, the risks associated with accounting for tax positions, tax audits and related          operations for the period in which the charges/benefits are incurred, even though such charges/benefits may be
disputes with taxing authorities, the risks of potential changes in laws in the U.S. or abroad, including tax laws, regulations or   incurred and reflected in the Company’s GAAP financial results in the near future. Additionally, the non-GAAP
treaties, employment and health insurance laws and regulations, laws relating to environmental policy, personal data,                measures are used by management for measuring and evaluating the Company’s performance. The material limitation
financial regulation, transportation policy and infrastructure policy along with the costs and complexities of compliance with       associated with the use of the non-GAAP measures is that the non-GAAP measures do not reflect the full economic
such laws, our ability to continue to avoid classification as a controlled foreign corporation, the risks of new legislation         impact of the Company’s activities. These non-GAAP measures are not prepared in accordance with GAAP, are not an
enacted in Bermuda and Barbados in response to the European Union’s review of harmful tax competition, risks associated              alternative to GAAP financial information, and may be calculated differently than non-GAAP financial information
with weather conditions, the duration and severity of the cold and flu season and other related factors, our dependence on           disclosed by other companies. Accordingly, undue reliance should not be placed on non-GAAP information.

       2
ICR Conference January 2021 - Seeking Alpha
Evolution of Transformation Strategy

        Phase I: FY15-FY19                   Phase II: FY20-FY24

                                                               Invest in
                                                              Leadership
                                                                Brands
                                               Optimize                        Double
                                                Capital                       Down on
                                              Deployment                    International

                                       Maximize                                       Selective
                                       Operating                                     & Strategic
                                       Efficiency                                       M&A

                                               Accelerate
                                                                             Consumer
                                             Shared Service
                                                                              Centric
                                               Excellence        Unify,
                                                               Include &
                                                              Elevate the
                                                              Best People

3
Phase I Generated Excellent Results and Phase II Off to a Strong Start
                                            Revenue ($ in Millions)                                                                  Adjusted Operating Income ($ in Millions)

                                                                                                                                                                                        $269
                                                                                           $1,707
                                                                                                                                                                                $239
                                                                                $1,564                                                                                 $224
                                                                                                                                                             $210
                                                                     $1,479                                                                        $194
                                                        $1,398                                                              $183        $188
                                            $1,383
                       $1,308    $1,335
                                                                                                              Adjusted
                                                                                                              Operating     14.0%       14.1%      14.0%     15.0%     15.1%    15.3%    15.8%
        YOY Growth      1.5%       2.1%       3.6%        1.0%         5.8%       5.8%      9.2%               Margin

                        FY14      FY15       FY16        FY17          FY18      FY19      FY20                            FY14         FY15       FY16      FY17      FY18     FY19    FY20

                                       Free Cash Flow ($ in Millions)                                                                       Non-GAAP Adjusted Diluted EPS

                                                                                                                                                                                        $9.30

                                                                                         $254                                                                                  $8.06
                                                      $197         $205                                                                                              $7.24
                                $166                                          $174
                                           $154                                                                                                            $6.49
                     $114                                                                                                                       $5.78
                                                                                                                                    $5.50
     Free Cash Flow $3.51
                      $3.51        $5.71
                                $5.71      $5.34 $5.34 $7.06     $7.06
                                                                     $7.52    $7.52
                                                                               $6.62       $6.62
                                                                                         $10.01
    per Diluted Share                                                                                               $4.50

                    FY14        FY15       FY16       FY17         FY18       FY19       FY20                       FY14            FY15        FY16       FY17      FY18      FY19     FY20
4
                                                                                                    Phase I   Phase II
Strong Portfolio of Leadership Brands
                                                                                                                                                Leadership Brand Net Sales Growth

                                                                                                                                                                                              #
                                                                                                                                                                                      27.3%
                                                                                                                                          9 Mo. FY21 vs 9 Mo. FY20

                                                                                                                                                                             9.4% *
                                                                                                                                                     FY20 vs FY19

                                                                                                                                                                             11.1%
                                                                                                                                        Phase I (FY14 - FY19 CAGR)

                                                                                                                                                   Leadership Brand Progression

                                                                                                                                                                         ˜20%
                                                                                                                                            ˜44%      ˜56%                        ˜80%
                                         Differentiated Market Leader                                                                               Leadership               Leadership
                                                                                                                                                      Brands                   Brands
                                                   Higher Margin
                                              Growth Adjacencies
                                                 Asset Efficient
                                                                                                                                              Beginning of                    FY20
                                                                                                                                                 Phase I                    Phase II
                                                                                                                                             Transformation              Transformation
                                                                                                                                                 FY2014

    * Fiscal 2020 includes approximately five weeks of net sales revenue for Drybar Products, which was acquired on January 23, 2020.
    # First nine months of fiscal 2021 includes nine months of net sales revenue for Drybar Products.

5
Value Creation Flywheel
      Accretive and Low Risk Capital Deployment   Leadership Brand Innovation and Investment

                  Low Capex                                      Organic Revenue Growth

     Working Capital Improvement                                 Margin Expansion

                       Debt and Tax Efficiency       High Quality Global Shared Services

6
FY21 Third Quarter: Exceptional Results

                                           FY21 Three Months Ended November 30, 2020 vs Same Period Year Ago*

     Consolidated Net Sales Growth                                                                                  34.3%

     Leadership Brands Growth                                      Represents ˜80% of total net sales               33.9%

     Adjusted Diluted EPS Growth                                                                            20.5%

     Online Net Sales Growth                                       Now represents ˜24% of total net sales            34%

*Same period year ago refers to the three months ended November 30, 2019

 7
FY21 Year to Date: Outstanding Performance

                                           FY21 Nine Months Ended November 30, 2020 vs Same Period Year Ago*

     Consolidated Net Sales Growth                                                                           25.6%

     Leadership Brands Growth
                                                                  Represents ˜81% of total net sales           27.3%

     Adjusted Diluted EPS Growth
                                                                                                                         35.4%

     Online Net Sales Growth                                        Now represents ˜25% of total net sales             33%

*Same period year ago refers to the nine months ended November 30, 2019

 8
Our Diversified Portfolio is Performing
                                                                                     Consolidated Net Sales
                                                                              Nine Months Ended November 30, 2020
                                                                                                                                                                 Housewares
                                                                                                                                                     YTD FY21 Net Sales: $564.9M
                                                                                                                                                            Organic +13.9% YOY*

             Health & Home
    YTD FY21 Net Sales: $661.6M                                                             Consolidated FY21:
             Organic +32.5% YOY*                                                                 $1.589B
                                                                                           Organic +23.1% YOY*

                                                                                                                                                                                    Beauty
                                                                                                                                                                      YTD FY21 Net Sales: $363.0M
                                                                                                                                                                              Organic +22.6% YOY*

    * YOY compares to nine months ended November 30, 2019.
    * Organic business refers to net sales revenue associated with product lines or brands after the first twelve months from the date the product line or brand is acquired, not
      including the impact that foreign currency had on reported net sales. Net sales revenue from internally developed brands or product lines is considered Organic business
9
      activity
Digital Transformation Investments Have Helped Quadruple Online Sales
                   Online Channel Net Sales as a % of Total Company Net Sales

     30%

     25%
                                                                                   25%
     20%                                                                   24%

     15%
                                                                19%                +33 %
                                                                                  Vs 9 Mos.
     10%                                             16%                            FY20

                                           12%                                     9 Mos.
                     9%         9%
      5%                                                                            FY21
            6%
      0%
            FY14     FY15       FY16       FY17      FY18       FY19       FY20       FY21
                                                                                      YTD
                                     PHASE I                               PHASE II

10
Strong Shareholder Return; Opportunity to Create Even More Value in Phase II

11
We Remain Confident in Our Average Annual Organic Sales and EPS Targets Over the Course of Fiscal
Years 2022 Through 2024

                                                                                          Revenue ($ in Millions)
                                                                                                                            FY21 Outlook
                                                                                                                           $2,075 to $2,100

                                                                                                                                21.5%
                                                                                                                                  to
                                                                                                                                23.0%
                                                                                                                                            Phase II
                                                                                                                                        Financial Targets
                                                                                                                                       Average Annual
                                                                                                                                     Organic Sales Growth
                                                                                                                                        2.5% to 3.5%
                                                                                                                                         Average Annual
                                                                                                                   $1,707
                                                                                                                                          EPS Growth
                                                                                             $1,479
                                                                                                          $1,564                              ≥ 8%
                                                                  $1,383        $1,398
                                       $1,308        $1,335

                                        FY14          FY15          FY16         FY17          FY18       FY19      FY20       FY21E      FY22E     FY23E   FY24E
                                                                         Phase I                                                         Phase II

 (1) Excludes share repurchases, acquisitions, material currency fluctuations and future tariff impacts
  * Annual targets are averages of performance over all of Phase II
12
Diversified Portfolio and Post-COVID Trends Expected to Help in FY22

                      •   Coronavirus expected to continue through 1H FY22
                      •   Resolution of inventory and supply constraints we experienced in 1H FY21
                      •   Higher COVID-driven installed base expected to drive more high margin filter sales for air and water purifiers and humidifiers
                      •   New normal: evolution of thermometers from a diagnostic tool to a first line of defense for families, offices, and institutions
     Health & Home    •   Expected normal cough/cold/flu season in FY22 vs. below historical average in FY21
                      •   Expected continued media and consumer focus on air purification from COVID-19 and expected FY22 wildfire season
                      •   New salesforce and products to develop the institutional market
                      •   International distribution gains

                      •   FY22 is expected to benefit from normalization of foot traffic following FY21 store closures and stay at home
                      •   FY22 is expected to have a more normalized back-to-school season vs FY21 as students return to the classroom
                      •   COVID drove increased household penetration and awareness that is expected to fuel incremental sales per household
                      •   International distribution gains in EMEA and Asia Pacific
      Housewares      •   Improved DTC, customization, and personalization capabilities from HOT Phase II investments
                      •   Consumers are demonstrating renewed joy from home activities and cooking even as the world reopens
                      •   Expected new demand for food storage and beverage bottles as consumers want the “Safety of Home” even as they go back
                          to the office and resume travel

                      • FY22 is expected to benefit from normalization of foot traffic following FY21 store closures and stay at home
                      • Resolution of inventory and supply constraints we experienced in 1H FY21
                      • Rise of do-it-yourself at home beauty is expected to be sticky as consumers mimic the salon experience at home, buy online,
                        and look great during virtual meetings
        Beauty        • Elevated influencer, social media attention and online reviews for major innovations like the One Step Volumizer franchise
                      • Salon re-openings, social gatherings, back to office, and increased travel expected as vaccine becomes more widespread
                      • Pipeline of new consumer-centric innovation and new product introductions
                      • Investing in international expansion for One-Step products
13
Helen of Troy’s Leadership Brand Portfolio is Well-Positioned to Succeed

                                                  Higher installed base

          Shift from cities to suburbs

                                                  "Safety of Home"
                                                  opportunity

           Consumer Centric
           innovation

                                                  Sustainability trend

           DTC and eCommerce

                                                  Beauty remains timeless

14
Value Creation Flywheel
      Accretive and Low Risk Capital Deployment   Leadership Brand Innovation and Investment

                  Low Capex                                      Organic Revenue Growth

     Working Capital Improvement                                 Margin Expansion

                       Debt and Tax Efficiency       High Quality Global Shared Services

15
Appendix
Glossary of Terms

Acquisition-related Expenses – Expenses associated with the definitive agreement to            Leadership Brand Net Sales (LB) – Consists of revenue from the OXO, Honeywell, Braun,
acquire Drybar Products LLC                                                                    PUR, Hydro Flask, Vicks, Hot Tools and Drybar brands
Adjusted Diluted Earnings per Share (EPS) – Non-GAAP Adjusted Income divided by                Online Channel Net Sales – Net sales to retail customers fulfilling end-consumer online
diluted shares outstanding                                                                     orders and pure-play online retailers, and direct to consumer online sales.
Adjusted Income – GAAP net income excluding Toys “R” Us (“TRU”) bankruptcy charge,             Organic Business – Previously referred to as Core business, Organic business refers to net
CEO succession costs, acquisition-related expenses, tax reform, Venezuelan currency re-        sales revenue associated with product lines or brands after the first twelve months from the
measurement related charges, patent litigation charges, non-cash asset impairment charges,     date the product line or brand is acquired, excluding the impact that foreign currency re-
restructuring charges, non-cash share-based compensation expense, and intangible asset         measurement had on reported net sales. Net sales revenue from internally developed brands
amortization expense (as applicable)                                                           or product lines is considered Organic business activity.
Adjusted Operating Income – GAAP operating income excluding TRU bankruptcy charge,             Peer Group – Derived from the Company’s compensation peer group for FY21, which
CEO succession costs, acquisition-related expenses, Venezuelan currency re-measurement         includes Church & Dwight Co. Inc., The Clorox Company, Coty Inc., Edgewell Personal Care
related charges, patent litigation charges, non-cash asset impairment charges, restructuring   Company, Energizer Holdings, Inc., La-Z-Boy Incorporated, Lifetime Brands Inc., Newell
charges, non-cash share-based compensation expense, and intangible asset amortization          Brands, Inc., Nu Skin Enterprises Inc., Prestige Consumer Healthcare, Inc., Revlon Inc.,
expense (as applicable)                                                                        Spectrum Brand Holdings Inc., Tempur Sealy International Inc., Tupperware Brands Corp
Adjusted Operating Margin – Non-GAAP Adjusted Operating Income divided by net sales            and Yeti Holdings Inc.
Compound Annual Growth Rate (CAGR) – Implied annual rate of return that would be               Project Refuel – In fiscal 2018, we announced a restructuring plan (referred to as “Project
required for compounded growth from a beginning balance to an ending balance                   Refuel”). Project Refuel includes charges for a reduction-in-force and the elimination of
Core and Non-Core Business – Core business is defined as strategic business that the           certain contracts.
Company expects to be an ongoing part of its operations, and Non-Core as business that it      Restructuring charges – Charges incurred in conjunction with the Company’s restructuring
expects to divest within a year of its designation as Non-Core.                                plan (Project Refuel).
Free Cash Flow (FCF) – Net cash provided by operating activities less capital and intangible
asset expenditures
Free Cash Flow per Diluted Share – Free cash flow divided by diluted shares outstanding

 17
Reconciliation of Non-GAAP Financial Measures - GAAP Operating Income to
     Adjusted Operating Income (Non-GAAP) (Unaudited) (in thousands)

                                                                                                            Fiscal Years Ended the Last Day of February
                                                         2020                  2019                  2018                     2017                        2016                   2015                  2014

Operating income as reported (GAAP)              $   178,251    10.4 % $   199,379    12.7 % $   169,062    11.4 % $     169,664      12.1 % $     116,294       8.4 % $    152,215     11.4 % $   117,100     9.0 %
 Asset impairment charges                             41,000    2.4 %           —      — %        15,447      1.0 %         2,900      0.2 %         6,000       0.4 %        9,000     0.7 %      12,049      0.9 %
 Restructuring charges                                 3,313    0.2 %        3,586    0.2 %        1,857      0.1 %            —        — %               —       — %            —       — %           —       — %
 Toys "R" Us bankruptcy charge                            —      — %            —      — %         3,596      0.2 %            —        — %               —       — %            —       — %           —       — %
 CEO succession costs                                     —      — %            —      — %            —       — %              —        — %          6,003       0.4 %           —       — %       18,228      1.4 %
 Acquisition-related expenses                          2,546    0.1 %           —      — %            —       — %              —        — %           698        0.1 %           —       — %           —       — %
 Venezuela re-measurement related charges                 —      — %            —      — %            —       — %              —        — %         18,733       1.4 %           —       — %           —       — %
 Patent litigation charge                                 —      — %            —      — %            —       — %           1,468      0.1 %        17,830       1.3 %           —       — %           —       — %
     Subtotal                                    $   225,110    13.2 % $   202,965    13.0 % $   189,962    12.8 % $     174,032      12.4 % $     165,558       12.0 % $   161,215     12.1 % $   147,377    11.3 %
 Amortization of intangible assets, net of tax        21,271    1.2 %       14,204    0.9 %       18,854      1.3 %       22,024       1.6 %        21,514       1.6 %       21,156     1.6 %      21,612      1.7 %
 Non-cash share-based compensation, net of tax        22,929    1.3 %       22,053    1.4 %       15,054      1.0 %       13,861       1.0 %         7,164       0.5 %        5,541     0.4 %      14,232      1.1 %
 Adjusted operating income (non-GAAP)            $   269,310    15.8 % $   239,222    15.3 % $   223,870    15.1 % $     209,917      15.0 % $     194,236       14.0 % $   187,912     14.1 % $   183,221    14.0 %

18
Reconciliation of Non-GAAP Financial Measures - GAAP Diluted Earnings Per Share
     (“EPS”) to Adjusted Diluted EPS (Non-GAAP) (Unaudited)

                                                                                                                      Fiscal Years Ended the Last Day of February
                                                                                  2020              2019               2018              2017              2016              2015              2014
      Diluted EPS as reported (GAAP)                                          $          6.02   $          6.62   $           4.73   $          5.17   $          3.23   $          4.36   $          2.66
       Tax reform                                                                         —                 —                 0.66               —                 —                 —                 —
       Asset impairment charges, net of tax                                              1.44               —                 0.51              0.09              0.18              0.28              0.37
       Restructuring charges, net of tax                                                 0.12              0.13               0.07               —                 —                 —                 —
       Toys "R" Us bankruptcy charge, net of tax                                          —                 —                 0.12               —                 —                 —                 —
       CEO succession costs, net of tax                                                   —                 —                  —                 —                0.14               —                0.51
       Acquisition-related expenses, net of tax                                          0.10               —                  —                 —                0.02               —                 —
       Venezuela re-measurement related charges, net of tax                               —                 —                  —                 —                0.65               —                 —
       Patent litigation charge, net of tax                                               —                 —                  —                0.05              0.62               —                 —
          Subtotal                                                                       7.68              6.75               6.08              5.32              4.85              4.64              3.54
       Amortization of intangible assets, net of tax                                     0.79              0.53               0.66              0.73              0.71              0.70              0.64
       Non-cash share-based compensation, net of tax                                     0.83              0.79               0.49              0.44              0.22              0.16              0.32
      Adjusted diluted EPS (non-GAAP)                                         $          9.30   $          8.06   $           7.24   $          6.49   $          5.78   $          5.50   $          4.50

      Weighted average shares of common stock used in computing diluted EPS         25,322            26,303              27,254           27,891            28,749            29,035            32,344

19
Reconciliation of Non-GAAP Financial Measures - GAAP Net Cash Provided by
     Operating Activities to Free Cash Flow and Free Cash Flow Per Diluted Share (Non-
     GAAP) (Unaudited) (in thousands, except per share data)

                                                                                                                     Fiscal Years Ended the Last Day of February
                                                                                   2020            2019                2018              2017              2016              2015              2014
       Net cash provided by operating activities (GAAP)                        $    271,293    $    200,568      $      218,609      $    212,491      $    170,263      $    171,742      $    154,165
        Less: Capital and intangible asset expenditures                             (17,759)        (26,385)            (13,605)          (15,507)          (16,676)           (5,908)          (40,463)
       Free cash flow (non-GAAP)                                               $    254,534    $    174,183      $      205,004      $    196,984      $    153,587      $    165,834      $    113,702

       Free cash flow per diluted share (non-GAAP)                             $      10.01    $          6.62   $            7.52   $          7.06   $          5.34   $          5.71   $          3.51

       Weighted average shares of common stock used in computing diluted EPS         25,322          26,303              27,254            27,891            28,749            29,035      $     32,386

20
Reconciliation of Non-GAAP Financial Measures - GAAP Net Income and Diluted
     EPS to Adjusted Income and Adjusted Diluted EPS (Non-GAAP) (Unaudited)
     (in thousands, except per share data)
                                                                                                                       Three Months Ended November 30, 2020
                                                                                                                    Income                                           Diluted EPS
                                                                                                 Before Tax          Tax          Net of Tax        Before Tax               Tax           Net of Tax
                     As reported (GAAP)                                                         $     97,876    $     13,721      $       84,155    $       3.89     $         0.55    $           3.34
                      Restructuring charges                                                              (12)               —                (12)             —                    —                 —
                        Subtotal                                                                      97,864          13,721              84,143            3.89               0.55                3.34
                       Amortization of intangible assets                                               4,501               204             4,297            0.18               0.01                0.17
                       Non-cash share-based compensation                                               6,739               403             6,336            0.27               0.02                0.25
                     Adjusted (non-GAAP)                                                        $    109,104    $     14,328      $       94,776    $       4.33     $         0.57    $           3.76

                     Weighted average shares of common stock used in computing diluted EPS                                                                                                       25,192

                                                                                                                           Three Months Ended November 30, 2019
                                                                                                                    Income                                               Diluted EPS
                                                                                                 Before Tax           Tax             Net of Tax        Before Tax            Tax            Net of Tax
                     As reported (GAAP)                                                         $     76,594    $      7,895          $    68,699       $     3.02       $         0.31      $       2.71
                       Acquisition-related expenses (1)                                                1,475                 22             1,453             0.06                     —             0.06
                       Restructuring charges                                                              12                 —                 12               —                      —                  —
                        Subtotal                                                                      78,081           7,917               70,164             3.07                 0.31              2.76
                       Amortization of intangible assets                                               4,790                252             4,538             0.19                 0.01              0.18
                       Non-cash share-based compensation                                               4,758                343             4,415             0.19                 0.01              0.17
                     Adjusted (non-GAAP)                                                        $     87,629    $      8,512          $    79,117       $     3.45       $         0.34      $       3.12

                     Weighted average shares of common stock used in computing diluted EPS                                                                                                         25,396

         (1) Acquisition-related expenses associated with the definitive agreement to acquire Drybar Products LLC included in SG&A for the three month period ended November 30, 2019.
21
Reconciliation of Non-GAAP Financial Measures - GAAP Net Income and Diluted
     EPS to Adjusted Income and Adjusted Diluted EPS (Non-GAAP) (Unaudited)
     (in thousands, except per share data)
                                                                                                                    Nine Months Ended November 30, 2020
                                                                                                                Income                                         Diluted EPS
                                                                                               Before Tax        Tax         Net of Tax       Before Tax               Tax          Net of Tax
                 As reported (GAAP)                                                         $    247,835    $    16,061      $    231,774     $       9.78     $         0.63       $         9.14
                  Restructuring charges                                                              355                 2            353             0.01                   —                0.01
                  Tax Reform                                                                          —           9,357             (9,357)             —                0.37                (0.37)
                    Subtotal                                                                     248,190         25,420           222,770             9.79               1.00                 8.79
                   Amortization of intangible assets                                              13,527            651             12,876            0.53               0.03                 0.51
                   Non-cash share-based compensation                                              20,654          1,406             19,248            0.82               0.06                 0.76
                 Adjusted (non-GAAP)                                                        $    282,371    $    27,477      $    254,894     $      11.14     $         1.08       $        10.05

                 Weighted average shares of common stock used in computing diluted EPS                                                                                                      25,350

                                                                                                                       Nine Months Ended November 30, 2019
                                                                                                                Income                                             Diluted EPS
                                                                                            Before Tax           Tax             Net of Tax       Before Tax            Tax             Net of Tax
                As reported (GAAP)                                                         $    172,018     $    16,530      $     155,488    $        6.80        $         0.65       $       6.15
                  Acquisition-related expenses (1)                                                 1,475               22            1,453             0.06                   —                 0.06
                  Restructuring charges                                                            1,061               68              993             0.04                   —                 0.04
                   Subtotal                                                                     174,554          16,620            157,934             6.90                  0.66               6.24
                  Amortization of intangible assets                                               13,129            621             12,508             0.52                  0.02               0.49
                  Non-cash share-based compensation                                               18,743          1,434             17,309             0.74                  0.06               0.68
                Adjusted (non-GAAP)                                                        $    206,426     $    18,675      $     187,751    $        8.16        $         0.74       $       7.42

                Weighted average shares of common stock used in computing diluted EPS                                                                                                         25,295

           (1) Acquisition-related expenses associated with the definitive agreement to acquire Drybar Products LLC included in SG&A for the nine month period ended November 30, 2019
22
You can also read