IDAHO ENERGY 2021 LANDSCAPE
←
→
Page content transcription
If your browser does not render page correctly, please read the page content below
IDAHO ENERGY
  LANDSCAPE
    2021

       Governor’s Office
        of Energy and
       Mineral Resources
       304 N. 8th Street, Suite 250
               P.O. 83720
        Boise, Idaho 83720-0199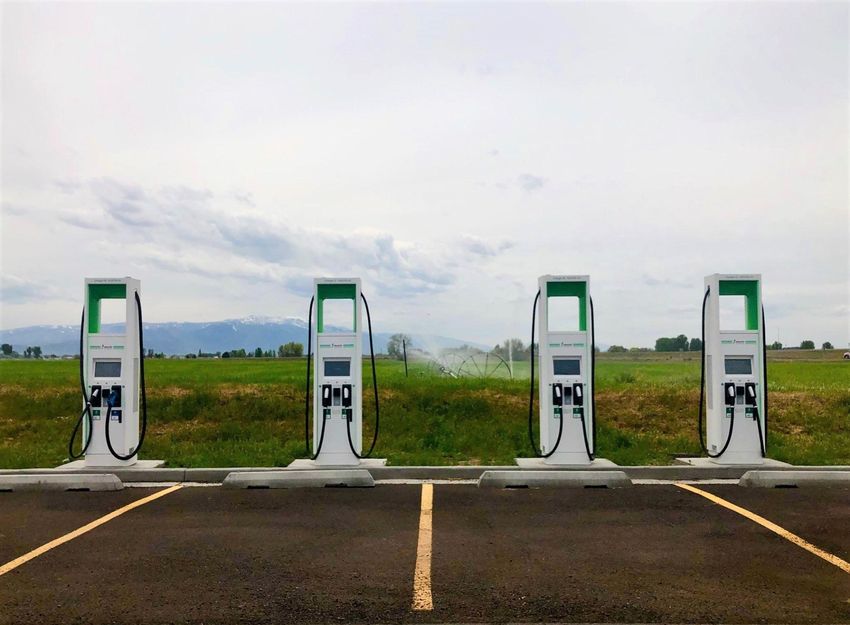
Created by the Idaho Governor’s
                   Office of Energy and Mineral Resources

                                304 N. 8th Street, Suite 250
                                     P.O. Box 83720
                                 Boise, Idaho 83720-0199

                            Special thanks to Intermountain
                             Gas Company, a subsidiary of
                               MDU Resources Group, for
                           printing and binding this edition of
                              the Idaho Energy Landscape.

  Note: All data referenced within this document is collected from entities that
update information at different intervals. Research was conducted to find the most
                               recent data available.

  Idaho Energy Landscape                                                       2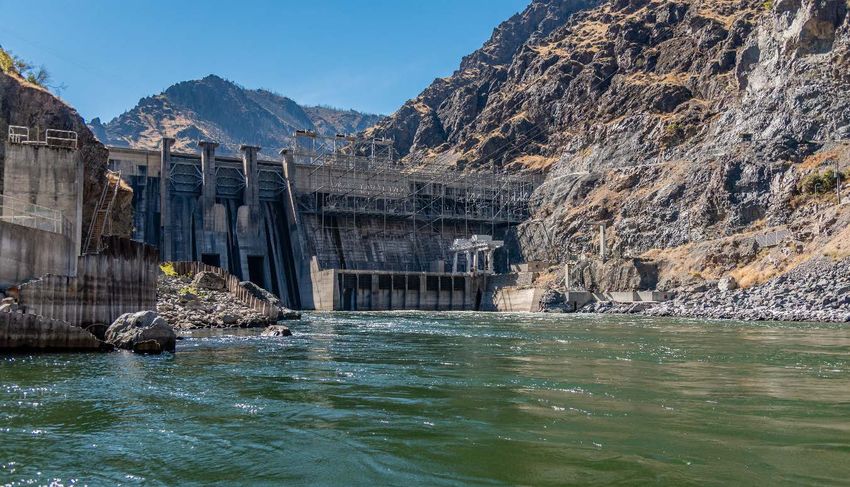
Table of Contents
       1. Idaho’s Energy Landscape ...............................................................................................6
           1.1 Energy and the Economy .........................................................................................6
               1.1.1. Energy Costs ..................................................................................................7
           1.2 Idaho Utilities, and Electric and Natural Gas Systems ............................................9
               1.2.1. Electricity .......................................................................................................9
               1.2.1.1. Avista Corporation ....................................................................................12
               1.2.1.2. Idaho Power Company ..............................................................................13
               1.2.1.3. PacifiCorp / Rocky Mountain Power ........................................................14
               1.2.1.4. Idaho’s Municipal and Cooperative Utilities ............................................15
               1.2.1.5. Utah Associated Municipal Power Systems .............................................15
               1.2.2. Natural Gas ..................................................................................................16
               1.2.2.1. Avista Utilities ..........................................................................................17
               1.2.2.2. Intermountain Gas Company ....................................................................17
               1.2.2.3. Dominion Energy ......................................................................................17
           1.3. Energy Consumption, Production, and Prices ......................................................18
               1.3.1. Sources of Idaho’s Energy ...........................................................................19
               1.3.2. Energy Rates Compared to Other States ......................................................22
           1.4. State, Regional, and Federal Energy Regulators ..................................................25
               1.4.1. Idaho Public Utilities Commission ..............................................................25
               1.4.2. Idaho Department of Lands and Oil and Gas Conservation Commission ...25
               1.4.3. Idaho Department of Environmental Quality ..............................................26
               1.4.4. Idaho State Department of Agriculture, Bureau of Weights and Measures 26
               1.4.5. Idaho Energy Resources Authority ..............................................................26
               1.4.6. Bonneville Power Administration................................................................27
               1.4.7. U.S. Department of Energy ..........................................................................28
               1.4.8. U.S. Federal Energy Regulatory Commission .............................................28
               1.4.9. North American Electric Reliability Corporation ........................................28
               1.4.10. Western Electricity Coordinating Council .................................................29
               1.4.11. RC West .....................................................................................................29
               1.4.12. Western Energy Imbalance Market and Extended Day-Ahead Market.....29
               1.4.13. U.S. Nuclear Regulatory Commission .......................................................30
               1.4.14. U.S. Department of the Interior .................................................................30
               1.4.15. U.S. Forest Service ....................................................................................31
               1.4.16. National Marine Fisheries Service .............................................................31
               1.4.17. U.S. Environmental Protection Agency .....................................................31
           1.5. State, Regional, and Federal Energy Coordinators ...............................................32
               1.5.1. Idaho Governor’s Office of Energy and Mineral Resources .......................32
               1.5.2. Idaho Strategic Energy Alliance ..................................................................32
               1.5.3. Leadership in Nuclear Energy Commission ................................................32
               1.5.4. Northwest Power and Conservation Council ...............................................32
               1.5.4.1 Northwest Power Pool ...............................................................................33
               1.5.5. Western Interstate Energy Board .................................................................33
               1.5.5.1. Committee on Regional Electric Power Cooperation ...............................34

Idaho Energy Landscape                                                                                                                  3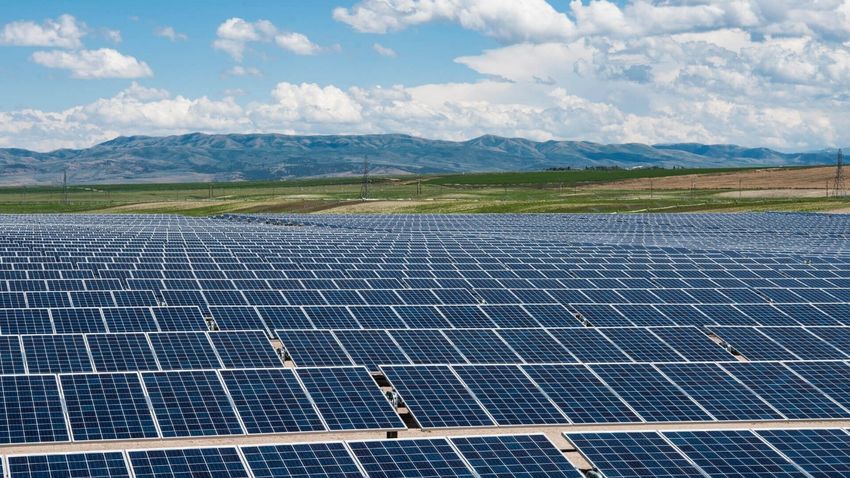
1.5.5.2. WIEB’s High-Level Radioactive Waste Committee ................................34
               1.5.6. Western Interconnection Regional Advisory Body .....................................34
           1.6 Regional and National Energy Issues ....................................................................35
               1.6.1. Transmission Planning .................................................................................35
               1.6.2. Public Utility Regulatory Policies Act of 1978 ...........................................35
       2. Idaho Energy Sources ....................................................................................................37
           2.1. Hydroelectricity ....................................................................................................37
           2.2. Wind......................................................................................................................38
           2.3. Solar ......................................................................................................................39
           2.4. Bioenergy ..............................................................................................................40
           2.5. Geothermal ............................................................................................................41
           2.6. Combined Heat and Power ...................................................................................42
           2.7. Nuclear ..................................................................................................................43
           2.8. Natural Gas ...........................................................................................................43
           2.9. Propane .................................................................................................................44
           2.10. Petroleum ............................................................................................................44
           2.11. Coal .....................................................................................................................45
       3. Conservation, Energy Efficiency, and Energy Storage .................................................46
           3.1. Northwest Power and Conservation Council’s Seventh Power Plan ....................47
           3.2. Bonneville Power Administration Energy Efficiency ..........................................47
           3.3. Idaho Power Energy Efficiency ............................................................................47
           3.4. PacifiCorp Energy Efficiency ...............................................................................48
           3.5. Avista Energy Efficiency ......................................................................................48
           3.6. Intermountain Gas Energy Efficiency ..................................................................48
           3.7. Energy Storage Technologies and Approaches ....................................................49
           3.8. Distributed Energy Resources...............................................................................50
           3.9. Pumped Hydroelectric Storage .............................................................................50
           3.10. Battery Storage....................................................................................................51
           3.11. Thermal Storage ..................................................................................................51
           3.12. Mechanical Storage .............................................................................................51
           3.13. Hydrogen Storage ...............................................................................................51
       4. Outlook ..........................................................................................................................53
           4.1. Utility Integrated Resource Plans .........................................................................53
           4.2. Future Planned Development ................................................................................54
           4.3. Microgrids .............................................................................................................57
               4.3.1. Smart Grid....................................................................................................57
           4.4. Electric Vehicles ...................................................................................................57
       5. Energy Research and Education Entities in Idaho .........................................................59
           5.1. Research at Idaho National Laboratory ................................................................59
           5.2. Center for Advanced Energy Studies ....................................................................60
           5.3. Universities, Colleges, and Technical Training ....................................................60
       Appendix A: List of Idaho Electric and Natural Gas Utilities ...........................................63
       Glossary: ............................................................................................................................64

Idaho Energy Landscape                                                                                                                       4
List of Tables and Figures
       FIGURE 1.1 IDAHO'S ENERGY INTENSITY AS A SHARE OF THE ECONOMY .......................... 7
       TABLE 1.1 AVERAGE ENERGY BILL PER PERSON, 2018 ....................................................... 8
       FIGURE 1.2 HELLS CANYON HYDROELECTRIC DAM ............................................................ 8
       FIGURE 1.3 NORTH AMERICAN ELECTRIC RELIABILITY CORPORATION REGIONAL ELECTRIC
           INTERCONNECTIONS..................................................................................................... 9
       FIGURE 1.4 IDAHO'S INVESTOR-OWNED ELECTRIC UTILITIES SERVICE TERRITORIES ........ 10
       FIGURE 1.5 IDAHO'S MUNICIPAL AND COOPERATIVE UTILITIES SERVICE TERRITORIES .... 11
       FIGURE 1.6 AVISTA ENERGY PRODUCTION MIX (2019) ..................................................... 12
       FIGURE 1.7 IDAHO POWER ENERGY MIX (2019) ................................................................ 13
       FIGURE 1.8 PACIFICORP’S ENERGY PRODUCTION MIX (2019) ........................................... 14
       FIGURE 1.9 WESTERN U.S. INTERSTATE NATURAL GAS PIPELINE SYSTEM AND NATURAL
           GAS SERVICE TERRITORIES........................................................................................ 16
       FIGURE 1.10 IDAHO ENERGY PRODUCTION AND CONSUMPTION ....................................... 18
       FIGURE 1.11 SOURCES OF END USE ENERGY CONSUMED IN IDAHO IN 2018..................... 19
       FIGURE 1.12 IDAHO’S 2019 ELECTRICITY SOURCES .......................................................... 20
       FIGURE 1.13 IDAHO’S 2018 ELECTRICITY FUEL MIX ......................................................... 21
       FIGURE 1.14 IDAHO’S 2019 AVERAGE ELECTRICITY RATES COMPARED TO OTHER STATES
           ................................................................................................................................... 22
       FIGURE 1.15 IDAHO’S 2019 RESIDENTIAL NATURAL GAS PRICES COMPARED TO OTHER
           STATES ...................................................................................................................... 23
       FIGURE 1.16 IDAHO’S 2020 RETAIL GASOLINE PRICES COMPARED TO OTHER STATES..... 24
       FIGURE 1.17 BPA RESOURCES (2019) ............................................................................... 27
       FIGURE 1.18 PURPA GENERATION IN IDAHO, 1981-2017................................................. 36
       FIGURE 2.1 CABINET GEORGE HYDROELECTRIC DAM ON THE CLARK FORK RIVER ......... 37
       FIGURE 2.2 POWER COUNTY WIND FARM IN EASTERN IDAHO. ......................................... 38
       FIGURE 2.3 AMERICAN FALLS II SOLAR PROJECT .............................................................. 39
       FIGURE 2.4 GEOTHERMAL LOCATIONS IN IDAHO ............................................................... 42
       FIGURE 2.5 IDAHO NATIONAL LAB ADVANCED TEST REACTOR FACILITY ........................ 43
       FIGURE 2.6 TRANSPORTATION FUEL PIPELINES AND REFINERIES SERVING IDAHO ........... 45
       FIGURE 3.1 GLOBAL DEMAND FOR PURE HYDROGEN IN METRIC TONS, 1975-2018 ......... 52
       TABLE 4.1 PLANNED INVESTMENTS IN ELECTRIC GENERATING FACILITIES BY IDAHO
           INVESTOR-OWNED UTILITIES, 2020-2030 ................................................................. 54
       TABLE 4.2 MAJOR PLANNED TRANSMISSION PROJECTS BY IDAHO INVESTOR-OWNED
           UTILITIES, 2020-2027 ................................................................................................ 55
       FIGURE 4.1 CONSTRUCTION OF THE GATEWAY WEST TRANSMISSION LINE ..................... 55
       TABLE 4.3 ANNOUNCED COAL-FIRED GENERATION FACILITY EXITS OR RETIREMENTS BY
           IDAHO INVESTOR-OWNED UTILITIES, 2019-2037 ...................................................... 56
       FIGURE 4.2 ELECTRIC VEHICLE DC FAST CHARGING STATION LOCATIONS IN IDAHO ...... 58

Idaho Energy Landscape                                                                                                                         5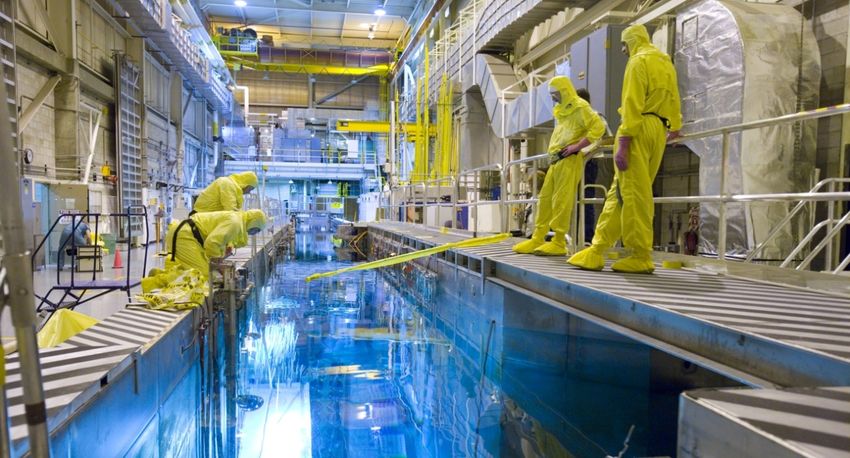
1. Idaho’s Energy Landscape
       1.1 Energy and the Economy

       The strength of Idaho’s economy and the quality of life in Idaho depend upon access to
       affordable and reliable energy resources. Idaho’s strong and diversified economy is
       fueled by energy-dependent sectors, including technology, manufacturing, agriculture,
       tourism, healthcare, and construction, all of which benefit from Idaho’s low cost of
       energy.

       Energy costs are affected by the economy, new technology, governmental regulation, and
       global market trends. For example, advancements in natural gas production technologies
       have increased the supply of domestically produced natural gas. This has substantially
       lowered the cost to consumers and nearly doubled consumption in the past decade. 1

       Historically, economic growth and energy consumption were strongly and positively
       correlated; however, technological changes and the increased utilization of energy
       efficiency have weakened this correlation. Idaho’s Gross Domestic Product on average
       grew 4.8% annually from 1998 to 2018, while Idaho’s energy consumption
       (transportation, heat, and power) only increased 0.5% annually from 1998 to 2018. 2
       Today, approximately 13,300 people work in Idaho’s energy sector, which pushes the
       boundaries of technology, launches start-ups, and fuels research, growth, and discovery. 3

       Energy statistics compiled for the Energy Landscape reflect the most recent data
       available from a wide variety of sources. Different sources will update energy data at
       irregular intervals, some more frequently than others. For that reason, the facts and
       statistics referenced in this document, including graphs and tables, represent the most up-
       to-date information available, but may be several years old. Each year, the Office of
       Energy and Mineral Resources staff conducts thorough research to ensure that the data
       presented in this document is accurate and complete.

       1 U.S. Energy Information Administration. “U.S. Natural Gas Deliveries to Electric Power Consumers.”
       www.eia.gov/dnav/ng/hist/n3045us2a.htm
       2 Federal Reserve Bank of St. Louis. “FRED: Total Gross Domestic Product for Idaho.”

       https://fred.stlouisfed.org/series/IDNGSP; and U.S. Energy Information Administration. “Total End-Use Energy
       Consumption Estimates, 1960-2016, Idaho.”
       www.eia.gov/state/seds/data.cfm?incfile=/state/seds/sep_use/tx/use_tx_ID.html&sid=ID
       3 National Association of State Energy Officials. “2020 U.S. Energy Employment Report: Idaho Report.”

       https://static1.squarespace.com/static/5a98cf80ec4eb7c5cd928c61/t/5e7813adac49515565fbcaa1/1584927662182/Idah
       o-2020.pdf

Idaho Energy Landscape                                                                                             6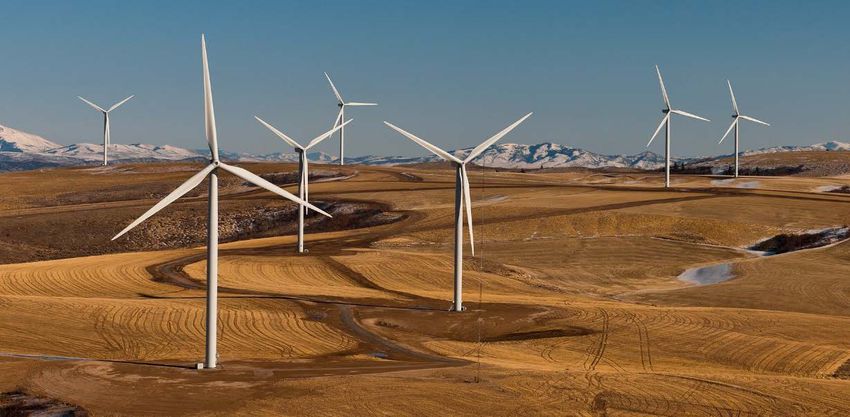
1.1.1. Energy Costs

       Figure 1.1 Idaho's Energy Intensity as a Share of the Economy 4

           16%

           14%                                                                     In 2018, Idaho had the 12th
           12%
                                                                                  highest energy intensity in the
                                                                                          United States.
           10%

            8%

            6%

            4%

            2%

            0%
                        West Virginia
                             Louisiana

                             Montana

                                Maine

                                Kansas

                             California
                             New York
                        United States

                           Minnesota
                             Wyoming

                             Nebraska
                              Alabama

                                 Idaho

                            Oklahoma
                        South Dakota

                                Illinois
                           Mississippi

                        Pennsylvania

                          Connecticut
                             Colorado
                             Maryland
                                Alaska

                              Vermont
                             Kentucky

                                   Iowa

                           Tennessee

                             Michigan

                               Nevada
                               Georgia

                          Washington

                 District of Columbia
                       North Carolina

                                Florida
                               Oregon
                               Virginia
                             Arkansas

                         New Mexico

                              Missouri
                       South Carolina
                                 Texas

                               Indiana

                         Rhode Island

                      Massachusetts
                               Arizona
                                   Ohio

                                   Utah
                           New Jersey

                             Delaware
                        North Dakota

                                Hawaii
                     New Hampshire
                            Wisconsin

           Low energy rates have consistently attracted energy-intensive industries to Idaho,
           including mining, pulp and paper, agriculture, food processing, and computer chip
           manufacturing. As a result, Idaho’s energy expenditures equated to almost 9% of the
           State’s Gross Domestic Product (GDP) in 2018, placing Idaho 12th for total energy costs
           compared to the rest of the states. 5 The total energy costs per GDP illustrated in Figure 1.1
           include the cost of gasoline to the State as well. Due to the rural nature of Idaho and the
           absence of a petroleum refinery in the State, Idahoans frequently spend more on
           transportation fuel than individuals who live in more densely populated regions of the
           country.

       4 U.S. Energy Information Administration. “Total Energy Price and Expenditure Estimates, Ranked by State, 2018.”
       https://www.eia.gov/state/seds/data.php?incfile=/state/seds/sep_sum/html/rank_pr.html&sid=US
       5 U.S. Energy Information Administration. “Total Energy Price and Expenditure Estimates, Ranked by State, 2018.”

       https://www.eia.gov/state/seds/sep_sum/html/pdf/rank_pr.pdf

Idaho Energy Landscape                                                                                                    7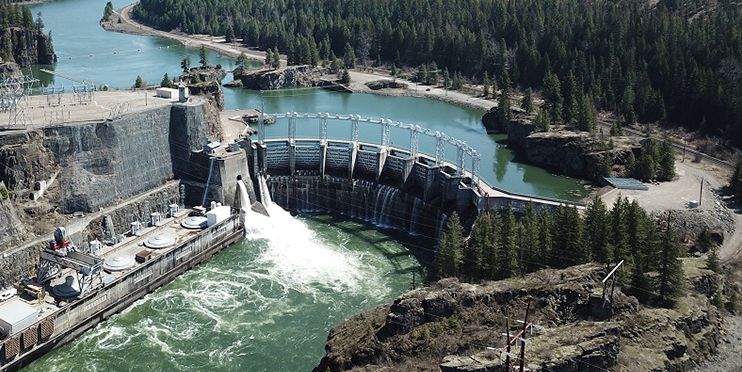
Table 1.1 Average Energy Bill per Person, 2018 6
Energy Source Dollars Per Year Percentage of Total Cost
Gasoline $1,199 63%
Electricity $487 26%
Natural Gas $111 6%
Propane $58 3%
Wood $40 2%
Coal $0 0%
Total $1,895 100%
Note: The fuel used to heat or power a home varies significantly across Idaho; therefore, the estimated cost
per person is an average of all energy types. Some people may use more or less of a specific energy source.
Collectively, Idaho’s residential, commercial, industrial, and transportation sectors spent
almost $7 billion on energy in 2018. 7 When those dollars were adjusted specifically for
residential use, the average Idahoan spent about $1,900 on direct energy products in
2018, as demonstrated in Table 1.1. This number was based on Idaho’s 2018 residential
energy expenditures and population estimate.
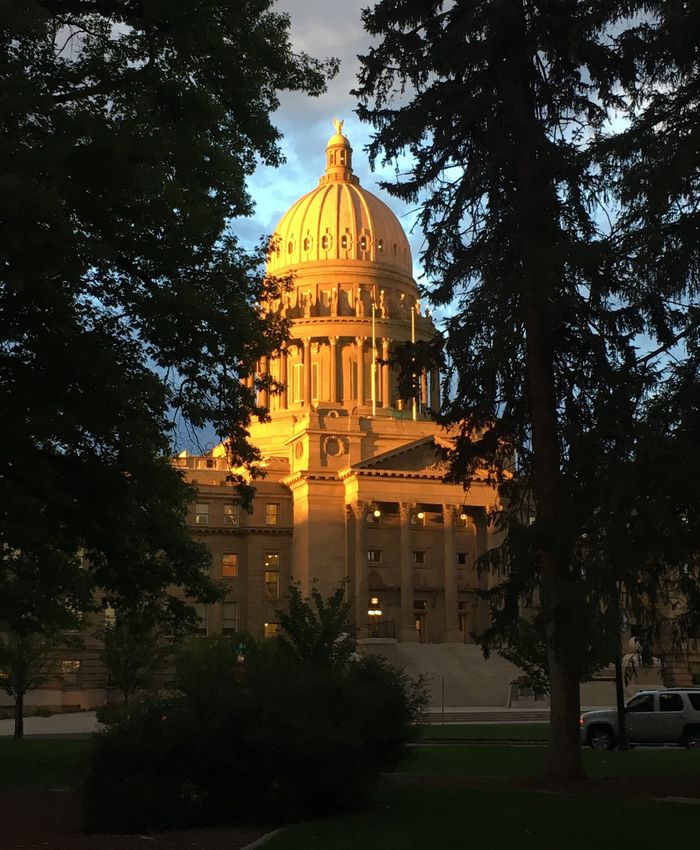
Figure 1.2 Hells Canyon Hydroelectric Dam 8
6 U.S. Energy Information Administration. “Idaho SEDS Data 2018 for the Residential, Commercial, Industrial and
Transportation Sectors.” https://www.eia.gov/state/seds/seds-data-complete.php?sid=ID; and Idaho Department of
Labor. “Census.” https://lmi.idaho.gov/census
7 U.S. Energy Information Administration. “Idaho SEDS Data 2018 for the Residential, Commercial, Industrial and
Transportation Sectors.” https://www.eia.gov/state/seds/seds-data-complete.php?sid=ID#PricesExpenditures
8 Sam Judy. Adobe Photo Stock License 225224371. https://stock.adobe.com/images/hells-canyon-
dam/225224371?prev_url=detail
Idaho Energy Landscape 8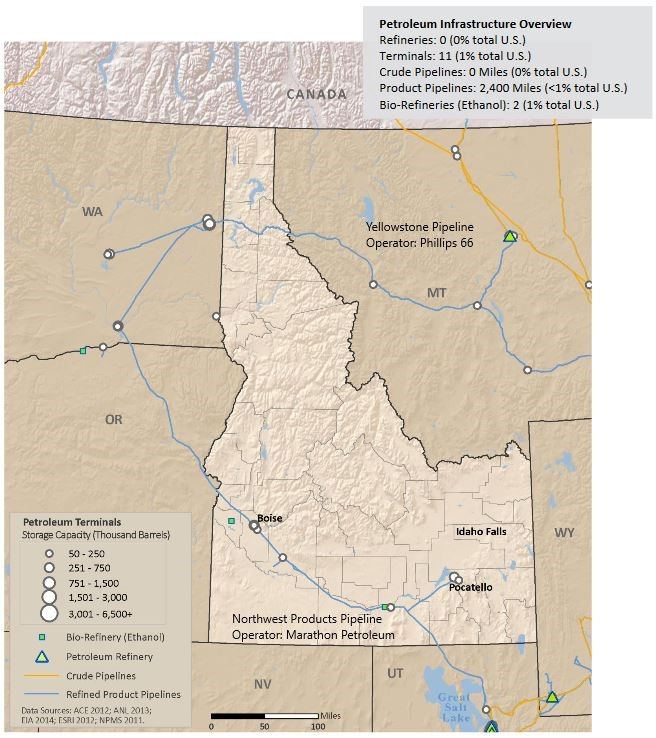
1.2 Idaho Utilities, and Electric and Natural Gas Systems

       1.2.1. Electricity

       Figure 1.3 North American Electric Reliability Corporation Regional Electric
       Interconnections 9

       The electrical transmission network in the United States and Canada is made up of four
       separate interconnections. The Western Interconnection links Idaho with the rest of the
       western United States and two Canadian provinces as shown in Figure 1.3. Coordination
       throughout the Western Interconnection on a local, sub-regional, and regional basis
       ensures a reliable and adequate integrated system of electricity for consumers. The
       Western Electricity Coordinating Council (WECC) is the regional entity that monitors
       and enforces compliance with electricity reliability standards throughout the Western
       Interconnection, including Idaho. 10

       9 North American Electric Reliability Corporation. “Maps: NERC Interconnections.”
       https://www.nerc.com/AboutNERC/keyplayers/PublishingImages/NERC%20Interconnections.pdf
       10 Western Electricity Coordinating Council. “About WECC.” https://www.wecc.org/Pages/AboutWECC.aspx

Idaho Energy Landscape                                                                                        9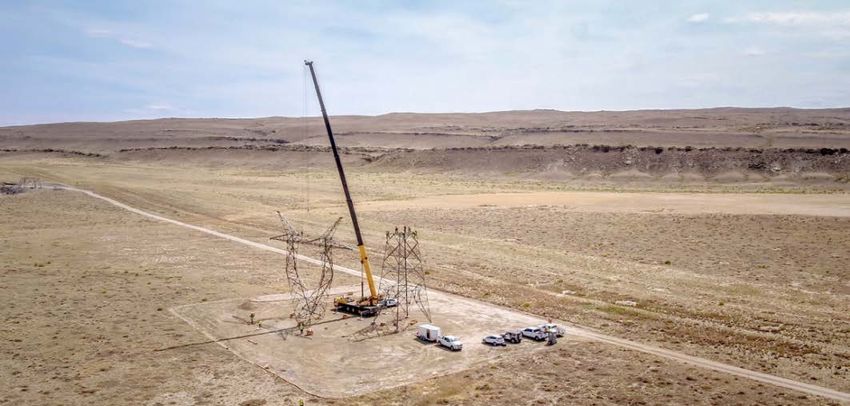
Figure 1.4 Idaho's Investor-Owned Electric Utilities Service Territories 11

       11 Idaho Public Utilities Commission. “Service Areas of Investor Owned Electric Utilities in Idaho.”

       https://puc.idaho.gov/Fileroom/PublicFiles/maps/elec.pdf

Idaho Energy Landscape                                                                                        10
Figure 1.5 Idaho's Municipal and Cooperative Utilities Service Territories 12
12 Idaho Public Utilities Commission. “Electric Co-ops, Mutual and Municipalities within Idaho.”
https://puc.idaho.gov/Fileroom/PublicFiles/maps/elecoop.pdf
Idaho Energy Landscape 11Idaho’s electrical grid is operated by three investor-owned utilities (IOUs), as well as
municipal and rural electric cooperative utilities, which are listed in Appendix A. The
three IOUs serve approximately 84% of the State’s electricity needs, while the municipal
and rural electric cooperative utilities serve the remaining 16%, as illustrated on the
previous pages by Figures 1.4 and 1.5. 13
1.2.1.1. Avista Corporation
Avista is an investor-owned electric and natural gas utility headquartered in Spokane,
Washington. Avista serves over 224,000 electric and natural gas customers in Idaho’s
northern and central regions. In April 2019, the company signed an agreement with the
California Independent System Operator (CAISO) to participate in the Western Energy
Imbalance Market (EIM) by the end of April 2022. 14 Additionally, in April 2019, Avista
announced its goal to serve its customers with 100% clean electricity by 2045, as
required under Washington law, and to have a carbon neutral portfolio by the end of
2027. 15
Figure 1.6 Avista Energy Production Mix (2019) 16
4% 2%
9%
Hydroelectric
Natural Gas
51% Coal
Wind
Biomass
34%
Avista generates electricity by utilizing a mix of hydroelectric, natural gas, coal, biomass,
and wind generation delivered over 2,770 miles of electrical transmission lines, 19,100
miles of electrical distribution lines, and 8,000 miles of natural gas lines. 17 Avista’s 2019
annual energy production mix and long-term contracted resources is shown in Figure 1.6.
Hydroelectric generation accounts for over half of its electricity mix, which provides a
significant price benefit for its customers. Avista’s company-owned and contract
13 U.S. Energy Information Administration. “Annual Electric Power Industry Report, Form EIS-861 detailed data
files.” https://www.eia.gov/electricity/data/eia861/
14 Avista. April 25, 2019. “Avista builds on commitment to renewable energy by joining the Western Energy Imbalance
Market.” https://investor.avistacorp.com/node/21551/pdf
15 Avista. “Our Commitment.” https://www.myavista.com/about-us/our-commitment
16 Avista. “About Our Energy Mix.” https://www.myavista.com/about-us/about-our-energy-mix
17 Avista. “2020 Quick Facts.” https://investor.avistacorp.com/static-files/437ad3b9-9fbf-4c20-a891-cbb4c2f1dcff
Idaho Energy Landscape 12hydroelectric resources are located in western Montana, eastern Washington, and
northern Idaho; and its natural gas-fired baseload and capacity resources are located in
Idaho, Oregon, and Washington. It also has an ownership share in the Colstrip coal-fired
power plant in Montana. 18
1.2.1.2. Idaho Power Company
Founded in 1916, Idaho Power Company is the largest electricity provider in the State.
Headquartered in Boise, it serves more than 570,000 customers across a 24,000 square
mile service territory in southern Idaho and eastern Oregon. 19 Electricity is supplied
through 4,800 miles of transmission lines and more than 27,000 miles of distribution
lines. 20 Idaho Power has a significant hydroelectric generation power base. It has 17 low-
cost, emission-free hydroelectric projects at the core of its generation portfolio, including
a 1,167 megawatt (MW), three-dam complex in Hells Canyon. 21 Idaho Power entered
the Western EIM in April 2018, 22 and announced its goal to provide 100% clean energy
to its customers by 2045 in March 2019.
Figure 1.7 Idaho Power Energy Mix (2019) 23
4% 2% 1%
9%
Hydroelectric
Coal
10%
Natural Gas
47% Wind
Other
Solar
11%
Geothermal
Biomass
16%
Idaho Power also generates electricity using natural gas at a combined-cycle combustion
plant at Langley Gulch, near New Plymouth, Idaho, and two simple-cycle plants near
Mountain Home. Additionally, it has partial ownership in baseload coal facilities located
in Wyoming and Nevada, the Bridger and Valmy plants. Idaho Power exited the
18 Avista. “2020 Electric Integrated Resource Plan.” https://www.myavista.com/about-us/integrated-resource-planning
19 Idaho Power Company. “Company Facts.” https://www.idahopower.com/about-us/company-information/company-
facts/
20 Idaho Power Company. “Transmission and Power Lines.” https://www.idahopower.com/energy-
environment/energy/delivering-power/transmission-and-power-lines/
21 Idaho Power Company. “Hydroelectric Plants.” https://www.idahopower.com/energy-environment/energy/energy-
sources/hydroelectric/hydroelectric-plants/
22 Western EIM. “About.” https://www.westerneim.com/Pages/About/default.aspx, and Idaho Power Company. “Clean
Today. Cleaner Tomorrow.” https://www.idahopower.com/energy/clean-today-cleaner-tomorrow/
23 Idaho Power Company. “Our Energy Sources.” https://www.idahopower.com/energy-environment/energy/energy-
sources/
Idaho Energy Landscape 13Boardman coal facility located in Oregon in 2020 and half of its share of the Valmy coal
facility in 2019. Idaho Power’s resource portfolio fuel mix for 2019 is shown in Figure
1.7. Idaho Power-owned generating capacity was the source for 72.4% of the energy
delivered to customers. Purchased power comprised 27.6% of the total energy delivered
to customers. 24
1.2.1.3. PacifiCorp / Rocky Mountain Power
PacifiCorp operates under the name Rocky Mountain Power in Idaho, Utah, and
Wyoming, and serves 82,000 customers in 14 Idaho counties. 25 PacifiCorp serves more
than 1.9 million retail customers across 141,390 square miles of service territory in
California, Idaho, Oregon, Utah, Washington, and Wyoming. 26 PacifiCorp merged in
1989 with Utah Power & Light Company and was purchased by MidAmerican Energy
Holdings Company in 2006, which later changed its name to Berkshire Hathaway
Energy. In 2014, PacifiCorp helped launch the Western EIM. 27
Figure 1.8 PacifiCorp’s Energy Production Mix (2019) 28
0.2% 4.5%
4.8%
8.0%
Coal
Other/Miscellaneous
Natural Gas
Wind
18.4%
56.5% Hydroelectric
Geothermal
Solar
7.7%
PacifiCorp owns 10,880 MW of net generation capacity, including coal, hydroelectric,
natural gas, wind, and geothermal resources. 29 PacifiCorp’s energy mix is shown in
Figure 1.8. Wind, hydro, geothermal, and other non-carbon-emitting resources currently
make up about 48% of PacifiCorp’s owned and contracted generating capacity.
PacifiCorp owns 2,222 MW of wind generation capacity and has long-term power
24 Idaho Power Company. “2019 Integrated Resource Plan, Second Amended.”
https://docs.idahopower.com/pdfs/AboutUs/PlanningForFuture/irp/2019/SecondAmended2019IRP.pdf
25 Rocky Mountain Power. “Just the Facts.”
https://www.rockymountainpower.net/content/dam/pcorp/documents/en/rockymountainpower/about/2020_BHE_FactS
heet-RockyMountainPower.pdf f
26 PacifiCorp. “About.” https://www.pacificorp.com/about.html
27 PacifiCorp. “Grid Modernization.” https://www.pacificorp.com/energy/grid-modernization.html
28 PacifiCorp. “Rocky Mountain Power – Power Content Label.” https://www.rockymountainpower.net/savings-
energy-choices/blue-sky-renewable-energy/product-content-label.html
29 PacifiCorp. “Generation Resources.” https://www.pacificorp.com/energy.html
Idaho Energy Landscape 14purchase agreements for 1,686 MW from wind projects owned by others. 30 PacifiCorp’s
customers receive electricity through approximately 16,500 miles of transmission lines,
64,000 miles of distribution lines, and 900 substations. 31
1.2.1.4. Idaho’s Municipal and Cooperative Utilities
Twenty-three electric utility municipalities and cooperatives are members of the Idaho
Consumer Owned Utilities Association (ICUA), serving more than 137,000 customers
throughout Idaho, accounting for about 16% of Idaho’s electric consumers. 32 Municipal
and cooperative utilities are not subject to regulation by the Idaho Public Utilities
Commission (PUC).33 Instead, Idaho’s municipal and cooperative electric utilities
provide competitively priced energy services to their members and residents and are
generally governed by an independently elected Board of Directors or city councils.
Most of Idaho’s municipalities and cooperatives purchase the bulk of their electricity,
over 96%, from Bonneville Power Administration (BPA); however, some are beginning
to acquire their own power generation resources and enter into power purchase
agreements with other energy providers. 34 For example, Idaho Falls Power owns and
operates five hydroelectric projects, owns a portion of the Horse Butte Wind project, and
operates a small amount of solar. 35 The low-cost, renewable electricity provided by the
Federal Columbia River Power System, including BPA and the four lower Snake River
dams, is vital to public power utilities across Idaho and the communities they serve.
1.2.1.5. Utah Associated Municipal Power Systems
Three of Idaho’s municipal and cooperative utilities and the Idaho Energy Authority, Inc.
are members of the Utah Associated Municipal Power Systems (UAMPS). UAMPS is a
project-based joint action agency headquartered in Salt Lake City, comprised of 48
public utilities in six western states. It provides comprehensive wholesale electric-energy
services on a nonprofit basis to community-owned power systems throughout the
Intermountain West. UAMPS conducts resource planning, evaluation of power resources
or services for its members, and develops power-generating facility projects. 36
30 PacifiCorp. “2019 Integrated Resource Plan – Volume I.” https://www.pacificorp.com/energy/integrated-resource-
plan.html
31 PacifiCorp. “Transmission.” https://www.pacificorp.com/transmission.html
32 Idaho Consumer-Owned Utilities Association. “Members.” https://www.icua.coop/members/
33 Idaho Public Utilities Commission. “About the Commission.” https://puc.idaho.gov/Home/About
34 Idaho Consumer-Owned Utilities Association. “Members.” https://www.icua.coop/members/
35 Idaho Falls Power. “Power Portfolio.” https://www.idahofallsidaho.gov/248/Power-Portfolio
36 UAMPS. “About Us.” http://www.uamps.com/About-Us
Idaho Energy Landscape 151.2.2. Natural Gas
Figure 1.9 Western U.S. Interstate Natural Gas Pipeline System and Natural Gas
Service Territories 37
Avista Utilities and Intermountain Gas Company provide the majority of natural gas
service in Idaho. A third utility, Dominion Energy, provides service to Idaho customers in
a portion of Franklin County in the southeastern part of the state. 38 Idaho has 380,000
residential, commercial and industrial natural gas customers. 39 Figure 1.9 shows the
major natural gas infrastructure in Idaho and Idaho utility service territories.
37 Northwest Gas Association. “Natural Gas Facts.” https://www.nwga.org/wp-
content/uploads/2017/06/NWGA_FactsWEBF.pdf
38 Dominion Energy “About Us – Western Gas Operations.” https://www.dominionenergy.com/about-us/moving-
energy/western-gas-operations
39 Northwest Gas Association. “Natural Gas Fact Sheet Idaho.” https://www.nwga.org/wp-
content/uploads/2016/02/IdahoFactSheet2017ForWeb.pdf
Idaho Energy Landscape 161.2.2.1. Avista Utilities
Avista serves 87,000 Idahoans in its northern Idaho natural gas service area, 90% of
whom are residential customers. 40 Avista’s natural gas distribution system consists of
approximately 3,300 miles of distribution pipelines in Idaho. Its North Division, which
covers about 26,000 square miles primarily in eastern Washington and northern Idaho, is
supplied by more than 40 points along interstate pipelines.
Avista holds firm access rights to both Canadian and Rocky Mountain natural gas
supplies through the Williams Northwest and Gas Transmission Northwest pipelines.
Avista also holds rights to the Jackson Prairie storage facility in Washington. According
to Avista’s latest Natural Gas Integrated Resource Plan (IRP), the number of customers in
Washington and Idaho is projected to increase at an average annual rate of 1.3%. 41
1.2.2.2. Intermountain Gas Company
Intermountain Gas Company (IGC) was founded in Idaho in 1950 and is a subsidiary of
MDU Resources Group. 42 IGC distributes natural gas to approximately 350,000
residential, commercial, and industrial customers in 76 Idaho communities. IGC uses
approximately 12,800 miles of pipelines across 50,000 square miles in southern Idaho. 43
IGC’s 125 industrial and transport customers comprise 50% of its annual energy demand,
while residential and commercial customers comprise 33% and 17% respectively.
IGC holds firm capacity rights on William’s Northwest Pipeline as well as three upstream
pipelines to deliver gas to the distribution system. The upstream systems are: Gas
Transmission Northwest, Foothills Pipeline and Nova Gas Transmission. IGC owns and
operates the Nampa liquified natural gas (LNG) storage facility and leases storage at the
Jackson Prairie underground facility, the Plymouth LNG facility, and leases capacity
from Dominion Energy’s Clay Basin underground storage field. Residential, commercial,
and industrial peak day load on IGC’s system under design conditions is forecast to grow
at an average annual rate of 2.08% over the five-year period of 2019-2023. 44
1.2.2.3. Dominion Energy
Dominion Energy, formerly called Questar Gas, based in Salt Lake City, provides natural
gas service to residential, commercial, and industrial customers in Utah, southwestern
Wyoming and about 2,200 customers in Franklin County, Idaho. 45 The Idaho Public
40 Avista. “2018 Natural Gas Integrated Resource Plan.” https://www.myavista.com/about-us/integrated-resource-
planning
41 Avista. “2018 Natural Gas Integrated Resource Plan.” https://www.myavista.com/about-us/integrated-resource-
planning
42 Intermountain Gas. “About Us.” https://www.intgas.com/in-the-community/about-us/
43 Intermountain Gas. “2019-2023 IRP.” https://www.intgas.com/wp-content/uploads/PDFs/commission_filings/IRP-
Write-Up-Book-2019.pdf
44 Intermountain Gas. “2019-2023 IRP.” https://www.intgas.com/wp-content/uploads/PDFs/commission_filings/IRP-
Write-Up-Book-2019.pdf
45 Idaho Public Utilities Commission. “2018 Annual Report – Natural Gas.”
https://puc.idaho.gov/Fileroom/PublicFiles/annualreports/ar2018/Section%20III%20Natural%20Gas.pdf; and
Dominion Energy. “Western Gas Operations.” https://www.dominionenergy.com/company/moving-energy/western-
gas-operations
Idaho Energy Landscape 17Utilities Commission has elected to allow the Utah Public Service Commission to
regulate Dominion Energy’s activities in its small Idaho service area. 46
1.3. Energy Consumption, Production, and Prices
Figure 1.10 Idaho Energy Production and Consumption 47
600
500
400
300
200
100
0
1990 1992 1994 1996 1998 2000 2002 2004 2006 2008 2010 2012 2014 2016 2018
Consumption Production
Idaho produces approximately 32% of the total energy it consumes, including electricity,
transportation fuels, and heating fuels. This is demonstrated in Figure 1.10, with
consumption and production of heat measured in increments of trillion BTUs, or British
Thermal Units. The State’s reliance upon imported energy requires a robust and well-
maintained infrastructure of highways, railroads, pipelines, and transmission lines to
facilitate economic development and maintain a high quality of life for Idaho’s citizens.
46Idaho Public Utilities Commission. “Merger Agreement.” https://puc.idaho.gov/Case/Details/3245
47U.S. Energy Information Administration. “State Energy Data System.” https://www.eia.gov/state/seds/seds-data-
complete.php?sid=ID#
Idaho Energy Landscape 181.3.1. Sources of Idaho’s Energy
Figure 1.11 Sources of End Use Energy Consumed in Idaho in 2018 48
6.8% 0.5%
Retail Electricity Sales &
16.6% Energy System Losses
Petroleum
41.9%
Renewables
0.3%
Natural Gas
Biomass
Coal
33.9%
As shown in Figure 1.11, petroleum–including those blended with ethanol–used primarily
for transportation, accounts for approximately 34% of Idaho’s end-use energy
consumption. Important energy commodities such as electricity sales and system losses
account for 42% and natural gas accounts for 17%, while the remaining 8% is attributable
to coal, biomass, and other renewable energy sources. Idaho’s total end-use energy
consumption in 2018 was 553.9 trillion BTUs.
48 U.S. Energy Information Administration. “State Energy Consumption Estimates.”
https://www.eia.gov/state/seds/sep_use/notes/use_print.pdf
Idaho Energy Landscape 19Figure 1.12 Idaho’s 2019 Electricity Sources 49
23%
Electric Utilities
50% IPP & CHP
Imports
27%
Figure 1.12 illustrates Idaho’s dependence upon imported electricity to meet load
demands. Idaho’s utilities generate approximately 50% of the energy utilized in-state.
27% is provided by combined heat and power (CHP) or independent power producers
(IPP). The remaining 23% is comprised of market purchases and energy imports from
out-of-state generating resources owned by Idaho utilities. Idaho’s retail sales of
electricity totaled 23,985,275 MWh.
49 U.S. Energy Information Administration. “Idaho Electricity Profile 2019.”
www.eia.gov/electricity/state/idaho/index.cfm
Idaho Energy Landscape 20Figure 1.13 Idaho’s 2018 Electricity Fuel Mix 50
63.3%
Hydroelectric
0.5%
Geothermal
Natural Gas
Wind
15.3%
Solar
Biomass
Coal
15.2%
0.1%
2.2% 3.4%
Note: The fuel mix percentages in this figure are based on Idaho’s power sector electrical consumption
data and not by generation data since Idaho consumes more electricity than it generates. These
percentages only account for electric use of energy resources; neither thermal nor fuel usage are
calculated into the percentages.
Shown in Figure 1.13, hydroelectricity is the dominant source of Idaho’s electricity,
comprising approximately 63%. Natural gas and wind both make up 15% each, and non-
hydro renewables, principally solar power, geothermal and biomass, account for
approximately 6%.
While hydroelectric is the primary resource utilized for electricity generation in Idaho, its
percentage depends upon the quality of the water year. 51 For example, droughts may
reduce the hydroelectric share, and non-hydroelectric sources must supply the remainder.
50;U.S. Energy Information Administration. “Detailed State Data.” https://www.eia.gov/electricity/data/state/; U.S.
Energy Information Administration. “State Energy Data System (SEDS): 1960-2018.”
https://www.eia.gov/state/seds/seds-data-complete.php?sid=US#Consumption
51 U.S. Energy Information Administration. “Idaho State Electricity Profile.”
https://www.eia.gov/electricity/state/idaho/index.php
Idaho Energy Landscape 211.3.2. Energy Rates Compared to Other States
Figure 1.14 Idaho’s 2019 Average Electricity Rates Compared to Other States 52
35
30
In 2019, Idaho had the 3rd
25 lowest average electricity
rate in the United States.
Cents per kWh
20
15
10
5
0
Kansas
Mississippi
Alabama
South Dakota
Wisconsin
Rhode Island
Michigan
Idaho
West Virginia
Nevada
Montana
Iowa
North Carolina
Virginia
Tennessee
Connecticut
Alaska
Oregon
Minnesota
Maryland
New Jersey
New Mexico
California
Pennsylvania
South Carolina
Arizona
Texas
U.S. Average
District of Columbia
Maine
Vermont
Massachusetts
North Dakota
Illinois
Ohio
Missouri
Colorado
Florida
New York
Wyoming
Arkansas
Utah
Georgia
Delaware
New Hampshire
Kentucky
Nebraska
Indiana
Hawaii
Louisiana
Oklahoma
Washington
Idaho’s baseload resources, including hydro, thermal, and geothermal, provide a constant
source of reliable low-cost electricity to Idaho utilities. As a result, Idaho’s average
electricity rates were the third lowest among the fifty states in 2019, shown in Figure
1.14.
52 U.S. Energy Information Administration. “Total Electricity Price.”
https://www.eia.gov/electricity/sales_revenue_price/pdf/table4.pdf
Idaho Energy Landscape 22Dollars per Thousand Cubic Feet
States 53
10
15
20
25
30
35
40
45
50
0
5
New Mexico
Idaho Energy Landscape
Idaho
North Dakota
Montana
South Dakota
Wisconsin
Colorado
shown in Figure 1.15.
Utah
Nebraska
Illinois
Minnesota
Wyoming
Michigan
Iowa
Indiana
Kansas
Oklahoma
Tennessee
Nevada
Ohio
New Jersey
Washington
West Virginia
Oregon
Missouri
the 2nd lowest
53 U.S. Energy Information Administration. “Natural Gas Prices.”
U.S. Average
Texas
the United States.
natural gas rate in
In 2019, Idaho had
average residential
www.eia.gov/dnav/ng/NG_PRI_SUM_A_EPG0_PRS_DMCF_A.htm
Mississippi
Kentucky
Arkansas
Alaska
Louisiana
Pennsylvania
Delaware
Maryland
New York
Virginia
District of Columbia
North Carolina
California
South Carolina
Vermont
Arizona
Connecticut
Massachusetts
Georgia
Rhode Island
Figure 1.15 Idaho’s 2019 Residential Natural Gas Prices Compared to Other
Alabama
New Hampshire
Maine
Florida
In 2019, Idaho’s average residential natural gas rates were the second lowest in U.S., as
Hawaii
23Figure 1.16 Idaho’s 2020 Retail Gasoline Prices Compared to Other States 54
4
Dollars per Thousand Cubic Feet In 2020, Idaho had the 9th-
3
highest average gas price in
3 the United States.
2
2
1
1
0
Mississippi
Kansas
Alabama
Wisconsin
Iowa
South Dakota
Tennessee
North Carolina
Michigan
Rhode Island
West Virginia
Virginia
Montana
Idaho
South Carolina
Connecticut
New Jersey
Alaska
Nevada
Maryland
Texas
Minnesota
New Mexico
Oregon
California
Missouri
Massachusetts
Arkansas
Ohio
Vermont
U.S. Average
Maine
Arizona
Pennsylvania
District of Columbia
Oklahoma
Louisiana
Kentucky
Georgia
Florida
North Dakota
Delaware
Colorado
Wyoming
New York
Illinois
New Hampshire
Utah
Indiana
Nebraska
Hawaii
Washington
Note: The average combined (local, state and federal) gasoline tax in 2020 was 54.78 cents per gallon.
Idaho’s combined gasoline tax rate in 2020 was 51.40 cents per gallon. 55
Idaho relies principally upon refineries in Utah and Montana for its supply of gasoline,
diesel, and other refined petroleum products. Idaho’s prices for these products are
typically higher than the national average. Idaho had the ninth highest average gasoline
price in the United States in 2020, as shown in Figure 1.16.
54 AAA. “Gas Prices.” https://gasprices.aaa.com/
55 American Petroleum Institute. “Gasoline Taxes.” http://www.api.org/~/media/Files/Statistics/Gasoline-Tax-Map.pdf
Idaho Energy Landscape 241.4. State, Regional, and Federal Energy Regulators
The entities listed below are involved in regulating aspects of Idaho’s energy systems. A
regulator is a government agency with authority to control energy services.
1.4.1. Idaho Public Utilities Commission
The Idaho PUC regulates Idaho’s investor-owned electric, natural gas,
telecommunications, and water utilities to ensure adequate service at just, reasonable, and
sufficient rates. The Idaho PUC has authority to promulgate administrative rules under
the Idaho Administrative Procedures Act. 56 The Idaho PUC consists of three
commissioners, appointed by the Governor and subject to Senate confirmation, who serve
staggered six-year terms. No more than two commissioners may be of the same political
party. The Idaho PUC renders decisions about utilities based upon all the evidence that is
presented in the case record. Idaho PUC orders may be appealed directly to the Idaho
Supreme Court.
The Idaho PUC holds formal hearings that resemble judicial proceedings in which parties
to the case may present testimony and evidence and may conduct cross-examinations. All
cases are a matter of public record. Information about the Idaho PUC and its Consumer
Assistance Section, which helps customers with billing and service-related questions, is
available on its website. 57
To ensure its decisions are based upon the best information available, the Idaho PUC
employs approximately 50 people – including engineers, accountants, economists, and
investigators – to analyze each matter before the Idaho PUC and issue recommendations.
In the Idaho PUC’s formal proceedings, the staff is a separate party to the case and may
present its own testimony, evidence, and expert witnesses. Staff recommendations are
considered by the Idaho PUC along with those of other parties to each case, which may
include utilities, the public, and agricultural, industrial, business, or consumer groups.
1.4.2. Idaho Department of Lands and Oil and Gas Conservation Commission
The Idaho Department of Lands (IDL) leases and issues rights-of-way for energy projects
on state endowment lands and provides some regulation of Idaho's mining industry. 58
IDL services are provided by 10 Supervisory Areas that include 14 offices.
The Oil and Gas Conservation Commission (OGCC) is administratively housed within
the IDL. 59 The OGCC regulates the exploration, drilling, and production of oil and gas
resources in Idaho to ensure the conservation of resources and the protection of surface
water and groundwater. 60
56 Idaho Statutes § 61and § 62.
57 Idaho Public Utilities Commission. https://puc.idaho.gov/
58 Idaho Department of Lands. “About Us.” https://www.idl.idaho.gov/about-us/; and “Oil & Gas Leasing.”
https://www.idl.idaho.gov/leasing/oil-gas-leasing/
59 Idaho Statute §47-314.
60 Idaho Oil and Gas Conservation Commission. “About the Commission.” https://ogcc.idaho.gov/
Idaho Energy Landscape 25The IDL reviews applications for drilling, well treatment, pit construction, and other
activities in conjunction with the Idaho Department of Water Resources and the Idaho
Department of Environmental Quality. The Director or her/his designee may hold
administrative hearings on applications for activities that may affect other mineral
interest owners. The OGCC consists of the Director of IDL, as well as a Governor-
appointed county commissioner from an oil and gas producing county and three
Governor-appointed technical experts with degrees in geosciences or engineering and at
least ten years of experience in the oil and gas industry.
1.4.3. Idaho Department of Environmental Quality
The Idaho Department of Environmental Quality (DEQ) is responsible for enforcing state
environmental regulations and administers a number of federal environmental protection
laws including the Clean Air Act, the Clean Water Act, and the Resource Conservation
and Recovery Act. 61 DEQ issues permits under the Idaho Pollutant Discharge
Elimination System, which began phasing authority from the Environmental Protection
Agency to DEQ in 2018. DEQ will have full permitting authority as of July 1, 2021. 62
DEQ has six regional offices across the State that work in partnership with local
communities, businesses, and citizens to identify and implement cost-effective
environmental solutions for projects. 63
1.4.4. Idaho State Department of Agriculture, Bureau of Weights and Measures
The Bureau of Weights and Measures (Bureau) is responsible for assuring the accuracy
of commercial weighing and measuring devices such as petroleum meters, fuel pumps,
and propane meters. The Bureau monitors gasoline octane levels and is responsible for
Idaho’s fuel quality and labeling. 64 It assures national traceability to Idaho’s primary
mass and volume standards through a nationally recognized metrology laboratory.
1.4.5. Idaho Energy Resources Authority
The Idaho Energy Resources Authority (IERA) is an energy lending/financing entity
authorized to issue revenue bonds to municipal and cooperative electric utilities. It was
established by the Idaho State Legislature in 2005 to promote transmission, generation,
and renewable energy development in the State and the region.
The IERA allows for Idaho utilities to jointly own and finance transmission and
generation projects for the benefit of their ratepayers. The IERA can participate in
planning, financing, constructing, developing, acquiring, maintaining, and operating
electric generation and transmission facilities and their supporting infrastructure. While
the IERA has bonding authority to promote specific projects, it has no legislative
appropriation, no full-time staff, and no ability to finance projects that are not backed by
ratepayers. The services provided by the IERA offer unique opportunities for Idaho’s
61 Idaho Department of Environmental Quality. “About.” http://deq.idaho.gov/about-us/
62 Idaho Department of Environmental Quality. “Idaho Pollutant Discharge Elimination System.”
http://deq.idaho.gov/water-quality/wastewater/
63 Idaho Department of Environmental Quality. “Regional Offices & Issues.” http://deq.idaho.gov/regional-offices/
64 Idaho State Department of Agriculture. “Weights and Measures.” https://agri.idaho.gov/main/weights-and-measures/
Idaho Energy Landscape 26municipal and cooperative electric utilities help to materially lower the development
costs of critical energy projects in the State.
1.4.6. Bonneville Power Administration
The Bonneville Power Administration (BPA) is one of four Power Marketing
Administrations (PMAs) under the U.S. Department of Energy (DOE) that supply power
throughout their regions. 65 BPA is a separate and distinct entity in the DOE under the
DOE Organization Act of 1977. 66 BPA is self-funded and has its own federal borrowing
and procurement authorities which it utilizes to serve the Northwest. BPA supplies about
28% of regional power. 67 BPA’s territory includes Idaho, Oregon, Washington, western
Montana and small parts of eastern Montana, California, Nevada, Utah and Wyoming.
BPA works with cooperatives, municipalities, IOUs, and directly provides electric power
to a number of federal installations, industrial, and irrigation customers in a practice
known as direct service. 68
Figure 1.17 BPA Resources (2019) 69
0.62% 4.76%
11.45%
Hydroelectric
Nuclear
Wind without RECs*
Non Specified
Purchases*
83.16%
Note: *BPA conveys its Renewable Energy Certificates to other parties and does not retire them.
BPA sources power from 31 federal hydroelectric dams that are operated by the U.S.
Army Corps of Engineers and the Bureau of Reclamation. These dams are referred to as
the Federal Columbia River Power System. It also markets power generated from some
non-federal plants in the Northwest, as well as additional power from the 1,169 MW
65 U.S. Energy Information Administration. “Federal Power Marketing Administrations operate across much of the
United States.” https://www.eia.gov/todayinenergy/detail.php?id=11651
66 Bonneville Power Administration. “About Us.” https://www.bpa.gov/news/AboutUs/Pages/default.aspx
67 Bonneville Power Administration. “BPA Facts.” https://www.bpa.gov/news/pubs/GeneralPublications/gi-BPA-
Facts.pdf
68 Bonneville Power Administration. “BPA Facts.” https://www.bpa.gov/news/pubs/GeneralPublications/gi-BPA-
Facts.pdf
69 Bonneville Power Administration. “Fuel Mix.” https://www.bpa.gov/p/Generation/Fuel-Mix/FuelMix/BPA-Official-
Fuel-Mix-2019.pdf
Idaho Energy Landscape 27Columbia Generating Station nuclear power plant in Richland, Washington. 70 BPA’s
energy resources are shown in Figure 1.17. BPA operates and maintains approximately
15,000 miles of the high-voltage transmission lines and 261 substations to 546
transmission customers that serve about 14 million people in its service territory. 71
BPA annually updates a Pacific Northwest Loads and Resources Study (White Book)
which documents regional retail loads and resource capabilities that serve the federal
system and Pacific Northwest for 10 years. The most recent White Book details resource
capabilities from 2021 through 2030. The study uses public resource planning reports
submitted by individual utilities, the Northwest Power and Conservation Council, and the
Pacific Northwest Utilities Conference Committee. Under average water conditions, the
Federal System is projected to have annual energy surpluses through the study period. 72
Under the Northwest Power Act, BPA is responsible for providing the net load
requirements of its requesting customers. This includes IOUs in the Pacific Northwest.
Under BPA’s current 20-year power sales contract, Idaho municipal and cooperative
utilities (customers) purchase power under a tiered rate methodology. Tier 1 locks in the
federal base system’s lowest cost generation portfolio. When the customer exceeds their
Tier 1 allocation, they can purchase a Tier 2 resource from BPA, acquire resources
independently, or jointly with other utilities to meet future demands.
1.4.7. U.S. Department of Energy
The U.S. Department of Energy (DOE) administers national energy, environmental, and
nuclear policies through science and technology solutions. 73 DOE oversees the nation’s
nuclear infrastructure, and operates energy research facilities throughout the nation,
including 17 national laboratories, among them Idaho National Laboratory.
1.4.8. U.S. Federal Energy Regulatory Commission
The Federal Energy Regulatory Commission (FERC) is an independent regulatory
agency within the U.S. DOE. FERC has jurisdiction over interstate electricity sales,
wholesale electric rates, hydroelectric licensing, natural gas transmission and related
services, pricing, oil pipeline rates and gas pipeline certification. 74
1.4.9. North American Electric Reliability Corporation
The North American Electric Reliability Corporation (NERC) is a non-profit subject to
oversight by the FERC and governmental authorities in Canada whose mission is to
ensure the reliability and security of the bulk power system in North America. NERC
accomplishes this by developing and enforcing reliability standards and assessing
70 U.S. Nuclear Regulatory Commission. “Columbia Generating Station.” https://www.nrc.gov/info-
finder/reactors/wash2.html
71 Bonneville Power Administration. “Newsroom.” https://www.bpa.gov/news/newsroom/Pages/BPA-powers-up-
future-energy-industry-workers.aspx
72 Bonneville Power Administration. “2019 Pacific Northwest Loads and Resources Study.”
https://www.bpa.gov/p/Generation/White-Book/wb/2019-WBK-Summary.pdf
73 U.S. Department of Energy. “About Us.” https://www.energy.gov/about-us
74 Federal Energy Regulatory Commission. “About FERC.” https://www.ferc.gov/about/what-ferc p
Idaho Energy Landscape 28You can also read