IEEE 802.3 Ethernet Working Group Communication
←
→
Page content transcription
If your browser does not render page correctly, please read the page content below
IEEE 802.3 Industry Connections Bandwidth Assessment                                                               19th July 2012

                IEEE 802.3 Ethernet Working Group Communication

From:          IEEE 802.3 Ethernet Working Group1
Subject: IEEE Industry Connections Ethernet Bandwidth Assessment
Date:          19th July 2012
Approval: Agreed to at IEEE 802.3 Plenary meeting, San Diego, 19th July 2012

During the IEEE P802.3ba 40Gb/s and 100Gb/s Ethernet project, it was observed
that the bandwidth requirements for core networking and computing applications
were growing at different rates, driving the need to develop the two new wireline
Ethernet speeds. In order to maintain an ongoing understanding of the industry
bandwidth trends, the IEEE 802.3 Ethernet Bandwidth Assessment Ad Hoc was
created. The scope of this ad hoc was to focus on gathering information that
would enable an assessment of the bandwidth needs for Ethernet wireline
applications, including, but not limited to, core networking and computing.
The attached assessment is the culmination of the open 2011 industry
assessment performed by the ad hoc. It includes a summary of the data brought
forward by individuals throughout the Ethernet ecosystem. All contributed
information is solely the perspective of the respective contributors. It should be
noted that all submitted data should be considered a snapshot of the perceived
bandwidth requirements at the time of submission.

Sincerely,
David Law
Chair, IEEE 802.3 Ethernet Working Group

1
 The views expressed in this document solely represent the views of the IEEE 802.3 Working Group, and do not necessarily represent a
position of the IEEE, the IEEE Standards Association, or IEEE 802.

i
IEEE 802.3 Industry Connections Bandwidth Assessment                                               19th July 2012

                                               IEEE 802.3 BWA Ad Hoc Report, 19th July 2012

IEEE 802.3™ Industry Connections
Ethernet Bandwidth Assessment
Prepared by the
IEEE 802.3 Ethernet Working Group

This is a report on the future bandwidth needs of Ethernet wireline applications.

This report can be found at the following URL:-
http://www.ieee802.org/3/ad_hoc/bwa/BWA_Report.pdf

Copyright © 2012 by the Institute of Electrical and Electronics Engineers, Inc.
All rights reserved. Published 19 July 2012.

Reproduction and distribution of this document in whole or in part by any medium is permitted. Appropriate
acknowledgement of the source and ownership of the material should be made with any such reproduction
and distribution.

IEEE and 802 are registered trademarks in the U.S. Patent & Trademark Office, owned by The Institute of
Electrical and Electronics Engineers, Incorporated.

Participants
The following individuals were officers and members of the IEEE 802.3 working group when this report
was approved.
                             David J. Law, IEEE 802.3 Working Group Chair
                       Wael William Diab, IEEE 802.3 Working Group Vice-Chair
                           Adam Healey, IEEE 802.3 Working Group Secretary
                    Steven B. Carlson, IEEE 802.3 Working Group Executive Secretary
                          Valerie Maguire, IEEE 802.3 Working Group Treasurer

        John D’Ambrosia, IEEE 802.3 Industry Connections Bandwidth Assessment Ad Hoc Chair
          Pete Anslow, IEEE 802.3 Industry Connections Bandwidth Assessment Ad Hoc Editor

    Abaye, Ali                              Barrass, Hugh                           Brophy, Timothy
    Abbas, Ghani                            Beaudoin, Denis                         Brown, Alan
    Abbott, John                            Belopolsky, Yakov                       Brown, Kevin
    Allard, Michel                          Bennett, Michael                        Brown, Matthew
    Amleshi, Peerouz                        Bhatt, Vipul                            Bugg, Mark
    Anderson, Jon                           Bhoja, Sudeep                           Busse, Robert
    Balasubramanian, Koussalya              Bliss, William                          Carroll, J. Martin
    Balasubramanian, Vittal                 Booth, Brad                             Chadha, Mandeep
    Baldwin, Thananya                       Boyd, Edward                            Chalupsky, David
    Barnett, Barry                          Braun, Ralf-Peter                       Chang, Frank
    Barr, David                             Breuer, Dirk                            Chang, Fuhlim

                                                                                                                ii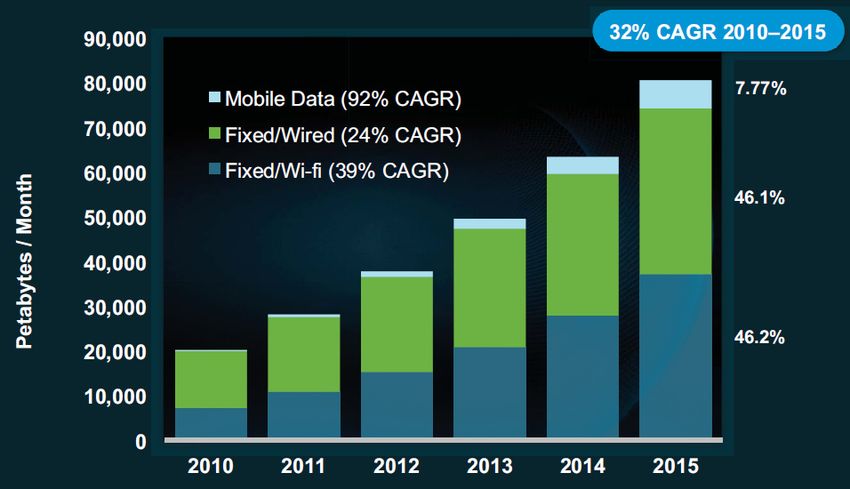
IEEE 802.3 Industry Connections Bandwidth Assessment                             19th July 2012

      Chen, Chung-Jue                       Kolze, Tom              Rahman, Saifur
      Cheng, Wheling                        Kono, Masashi           Ran, Adee
      Chou, Joseph                          Kosanovich, Keith       Remein, Duane
      Choudhury, Golam                      Kramer, Glen            Ressl, Michael
      Cideciyan, Roy                        Kvist, Bengt            Riani, Jamal
      Cole, Christopher R.                  Lackner, Hans           Salinger, Jorge
      Cui, Kai                              Lamb, Lowell            Salunke, Vineet
      Dai, Eugene                           Larsen, Wayne           Sambasivan, Sam
      Dawe, Piers                           Latchman, Ryan          Schmitt, Matthew
      Diamond, Patrick                      Laubach, Mark           Searles, Shawn
      Diminico, Chris                       Le Cheminant, Greg      Sela, Oren
      Donahue, Curtis                       Lewis, David            Shanbhag, Megha
      Donnay, Beth                          Li, Mike Peng           Shang, Song Quan
      Dove, Dan                             Lingle, Robert          Shariff, Masood
      Dudek, Mike                           Liu, Alexander          Shellhammer, Stephen
      Dwelley, David                        Lusted, Kent            Sheth, Siddharth
      Elbakoury, Hesham                     Lutz, Sharon            Shrikhande, Kapil
      Estes, David                          Maki, Jeffery J.        Slavick, Jeff
      Ewen, John                            Mallette, Edwin         Solomon, Joe
      Farhoodfar, Arash                     Marris, Arthur          Sommers, Scott
      Flatman, Alan                         Matsuda, Shougo         Sparrowhawk, Bryan
      Forbes, Harry                         Mcclay, Phil            Sprague, Edward
      Frazier, Howard                       McCormack, Michael S.   St Peter, Matthew
      Fu, Hongyan                           Mcdermott, Thomas       Stassar, Peter
      Ganga, Ilango S.                      McDonough, John         Sugawa, Jun
      Ghiasi, Ali                           McNarney, Martin
                                                                    Suzuki, Ken-Ichi
      Giannakopoulos, Dimitrios             Meghelli, Mounir
                                                                    Swanson, Steve
      Goergen, Joel                         Mei, Richard
                                                                    Szczepanek, Andre
      Grimwood, Michael                     Meier, Wolfgang
                                                                    Tawa, Katsuhisa
      Grow, Robert                          Mellitz, Richard
                                                                    Tazebay, Mehmet
      Gundubogula, Sudhakar                 Misek, Brian
                                            Moeller, Merrick        Teixeira, Antonio
      Gustlin, Mark
                                            Montreuil, Leo          Thompson, Geoffrey
      Hajduczenia, Marek
      Hamano, Hiroshi                       Moore, Charles          Tracy, Nathan
      Hammond, Bernie                       Muller, Shimon          Tremblay, Francois
      Heath, Jeffrey                        Nikolich, Paul          Trowbridge, Stephen
      Hidaka, Yasuo                         Nishihara, Susumu       Ulm, John
      Hou, Victor                           Noll, Kevin             Umnov, Alexander
      Huang, Xi                             Nordin, Ronald          Vaden, Sterling A.
      Irwin, Scott                          Northcott, Philip       Valle, Stefano
      Ishida, Osamu                         Nowell, Mark            Vanderlaan, Paul
      Isono, Hideki                         Ofelt, David            Wagner, Robert
      Iwadate, Hirotake                     Ossman, Valy            Wang, Zhong Feng
      Jain, Rajeev                          Palkert, Tom            Warland, Tim
      Jewell, Jack                          Panguluri, Sesha        Warren, David
      Jiang, Hongtao                        Park, Jisang            Winkel, Ludwig
      Jiang, Wenbin                         Parthasarathy, Vasu     Wong, Ching
      Jimenez, Andrew                       Patel, Pravin           Woodruff, Bill
      Kasturia, Sanjay                      Pepeljugoski, Petar     Wu, Wendy
      Kawatsu, Yasuaki                      Pepper, Gerald          Zambell, Andrew
      Kim, Yong                             Perrie, Randy           Zang, meiyan
      Kimmitt, Myles                        Petrilla, John          Zeng, Li
      King, Jonathan                        Pimpinella, Rick        Zhang, James
      Kipp, Scott                           Powell, William         Zhao, Wenyu
      Kodama, Satoshi                       Prodan, Richard         Zimmerman, George
      Kolesar, Paul                         Rabinovich, Rick        Zivny, Pavel

iii
IEEE 802.3 Industry Connections Bandwidth Assessment                                                                                      19th July 2012

Contents
       Executive summary............................................................................................................................. 1

1.     Abbreviations...................................................................................................................................... 1

2.     Introduction......................................................................................................................................... 2

       2.1 Overview..................................................................................................................................... 3
       2.2 Assessment limitations ............................................................................................................... 4

3.     Key findings........................................................................................................................................ 4

       3.1    Introduction................................................................................................................................. 4
       3.2    Visual Networking Index............................................................................................................ 4
       3.3    Storage growth ............................................................................................................................ 7
       3.4    Data center ................................................................................................................................ 11
              3.4.1 Server bandwidth scenarios .......................................................................................... 11
              3.4.2 High performance computing ....................................................................................... 13
              3.4.3 Data center bandwidth scenarios .................................................................................. 14
              3.4.4 Global data centers........................................................................................................ 14
       3.5    Data intensive science............................................................................................................... 17
       3.6    Financial sector ......................................................................................................................... 18
       3.7    Cable data ................................................................................................................................. 21
       3.8    Optical Transport Network ....................................................................................................... 27
       3.9    European peering ...................................................................................................................... 31

4.     Assessment........................................................................................................................................ 36

       4.1    Peripheral growth trends ...........................................................................................................          36
       4.2    Network growth trends .............................................................................................................           37
       4.3    Variation factors .......................................................................................................................     37
       4.4    Summary ...................................................................................................................................   38

5.     References......................................................................................................................................... 39

                                                                                                                                                            iv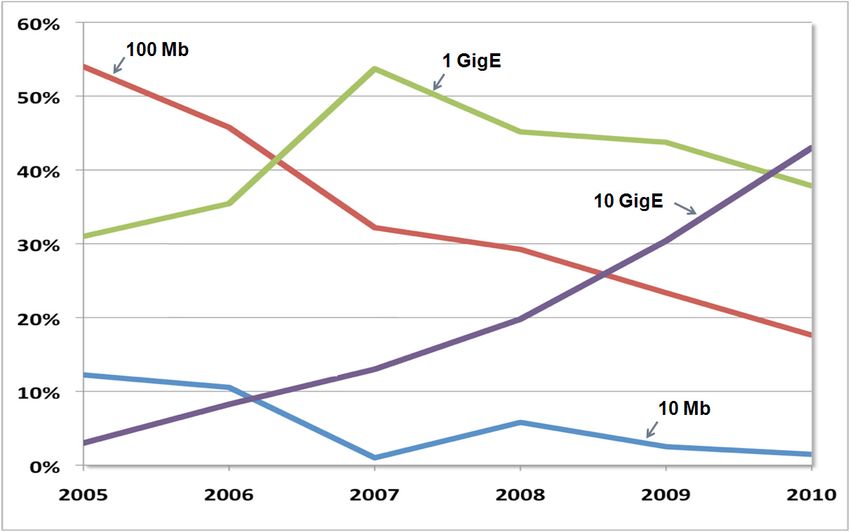
IEEE 802.3 Industry Connections Bandwidth Assessment 19th July 2012 Executive summary The release of this assessment completes a year-long effort by the IEEE 802.3 Industry Connections Ether- net Bandwidth Assessment Ad Hoc to provide an updated view of industry bandwidth trends impacting Ethernet wireline applications. Maintaining an ongoing understanding of bandwidth trends should be benefi- cial to a future higher speed study group, as the time necessary to develop this knowledge is significant, as evident by the effort exerted by this ad hoc. This assessment builds upon the work of the 2007 IEEE 802.3 Higher Speed Study Group (HSSG), which observed that core networking and computing applications were growing at different rates. The bandwidth associated with core networking was observed, on average, to be doubling every eighteen months. On the other hand, the bandwidth capability associated with high volume x86 servers and computing applications, fueled by Moore's Law, was doubling every twenty-four months [1]. Input was submitted from eleven source presentations, which looked at a variety of application spaces including servers, data center networks, high performance computing, financial markets, carrier and cable operators, Internet exchanges, and the scientific community. In addition to the different application spaces, data on different geographical regions was also explored. This data can be thought of in two different man- ners: end-station applications, which initiated the transmission and receipt of the data, and network aggrega- tion nodes. The 2007 HSSG observed that the computing end-station application was growing at a slower pace than the aggregation networks. This ad hoc obtained data from multiple sources that indicated the continuation of the trend that the bandwidth requirements of aggregation nodes were growing at a faster rate than end-station applications. Furthermore, while there was a wide variation in aggregated bandwidth needs, the observed trend that the doubling every eighteen months on average of bandwidth requirements associated with core networking is still a reasonable approximation. If the current trend continues, then this translates to an increase in traffic of a factor of 10 by 2015 compared to 2010 and by a factor of 100 by 2020. While this is the forecasted bandwidth capacity requirement, no assumptions regarding a given interface speed have been made by the ad hoc. Such bandwidth requirements might be serviced by a given higher interface speed or some parallel configuration of lower speeds. It is left to future standards activities to determine the best way to service these application spaces. 1. Abbreviations This document contains the following abbreviations: 1GbE 1 Gb/s Ethernet 10GbE 10 Gb/s Ethernet 40GbE 40 Gb/s Ethernet 100GbE 100 Gb/s Ethernet 3D TV three-dimensional television BW bandwidth CAGR compound annual growth rate CMTS cable modem termination system DAC digital-to-analog converter DAS direct attached storage DOCSIS Data Over Cable Service Interface Specification DS downstream EPON Ethernet passive optical network FCoE Fibre Channel over Ethernet 1
IEEE 802.3 Industry Connections Bandwidth Assessment                                         19th July 2012

HDTV              high-definition television
HHP               house-holds passed
HPC               high performance computing
HSSG              Higher Speed Study Group
I/O               input/output
IP                Internet Protocol
iSCSI             Internet small computer system interface
ISP               Internet service provider
IXP               Internet exchange point
LAN               local area network
LAG               link aggregation
LHC               Large Hadron Collider
LOM               LAN on motherboard
MAN               metropolitan area network
MSO               multi-system operator
NAS               network attached storage
NIC               network interface card
OEM               original equipment manufacturer
OTN               Optical Transport Network
P2P               peer-to-peer
PC                personal computer
PCIe              Peripheral Component Interconnect Express
QAM               quadrature amplitude modulation
RFOG              radio frequency over glass
SAN               storage area network
SMB               small and medium business
US                upstream
VOD               video on demand
WAN               wide area network
x86               a family of architectures based on the Intel® 8086 CPU

2. Introduction

During the 2007 incarnation of the IEEE 802.3 Higher Speed Study Group (HSSG), there was a significant
amount of debate regarding whether two rates of Ethernet were needed. Multiple meetings and presentations
were necessary to resolve this debate, and ultimately, it was agreed that core networking and computing
applications were growing at different rates. The bandwidth associated with core networking was observed,
on average, to be doubling every eighteen months, while the bandwidth capability associated with high vol-
ume x86 servers and computing applications, fueled by Moore's Law, was doubling every twenty-four
months [1]. These observations, illustrated in Figure 1, drove the rate objectives for the two new wireline
Ethernet speeds that were developed by the IEEE P802.3ba Task Force - 40 Gigabit Ethernet and
100 Gigabit Ethernet.

                                                                                                          2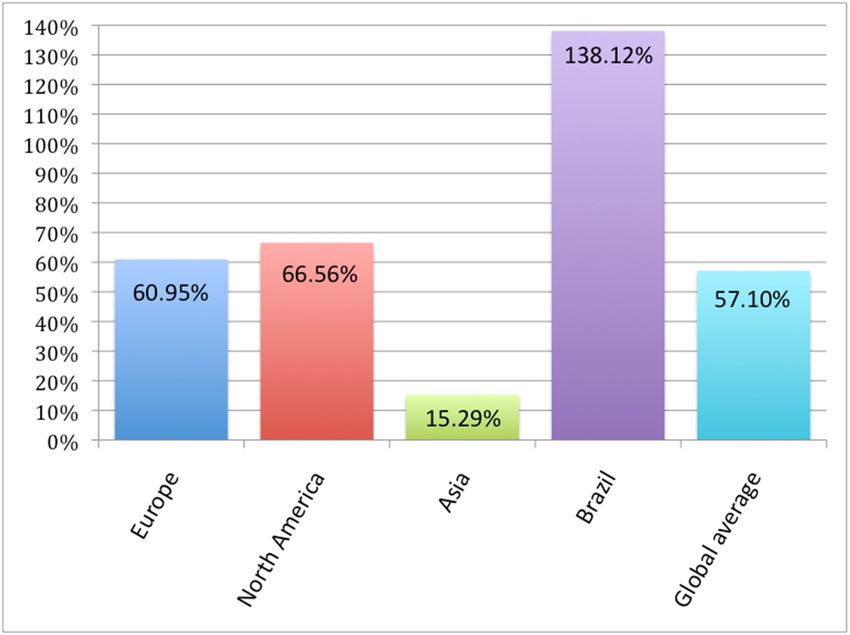
IEEE 802.3 Industry Connections Bandwidth Assessment                                           19th July 2012

                Figure 1—2007 IEEE 802.3 HSSG bandwidth demand projections

Looking ahead, the exponential growth cited by multiple end-users was such that they told the HSSG that
work on the next speed of Ethernet needed to begin once 100 Gigabit Ethernet was completed [2], [3], [4].
This need is corroborated by the bandwidth growth rate for core networking illustrated in Figure 1, where
400 Gb/s is shown as needed by 2013 and 1 Tb/s is shown as needed by 2015. As “The Great Rate Debate”
was a source of delay during the effort to develop the next rate of Ethernet beyond 10 Gb/s, it was realized
that a pro-active effort to provide an updated view of industry bandwidth trends impacting Ethernet wireline
applications would be beneficial to the Ethernet industry and future standards efforts targeting an Ethernet
rate beyond 100 Gb/s. Thus, the IEEE 802.3 Industry Connections Ethernet Bandwidth Assessment Ad Hoc
was created.

2.1 Overview

The IEEE 802.3 Industry Connections Ethernet Bandwidth Assessment Ad Hoc was formed in early 2011.
Its scope was to focus on gathering information that would enable an assessment of the bandwidth needs for
Ethernet wireline applications including, but not limited to, core networking and computing. The gathered
information forms the basis for an assessment that can be used for future reference by an appropriate related
standards activity. It should be noted that the role of this ad hoc was solely to gather information, and not
make recommendations or create a call-for-interest for the next speed of Ethernet.

To gather this information, the ad hoc sought out contributions from individuals from various application
areas and made a public request for information [5]. The following individuals presented their information
to the ad hoc at various meetings and teleconferences throughout 2011:
    •   Scott Kipp, Brocade, “Data Center Bandwidth Scenarios” [6];
    •   Andy Bach, NYSE Euronext, “Bandwidth Demand in the Financial Industry - The Growth Contin-
        ues”[7];

3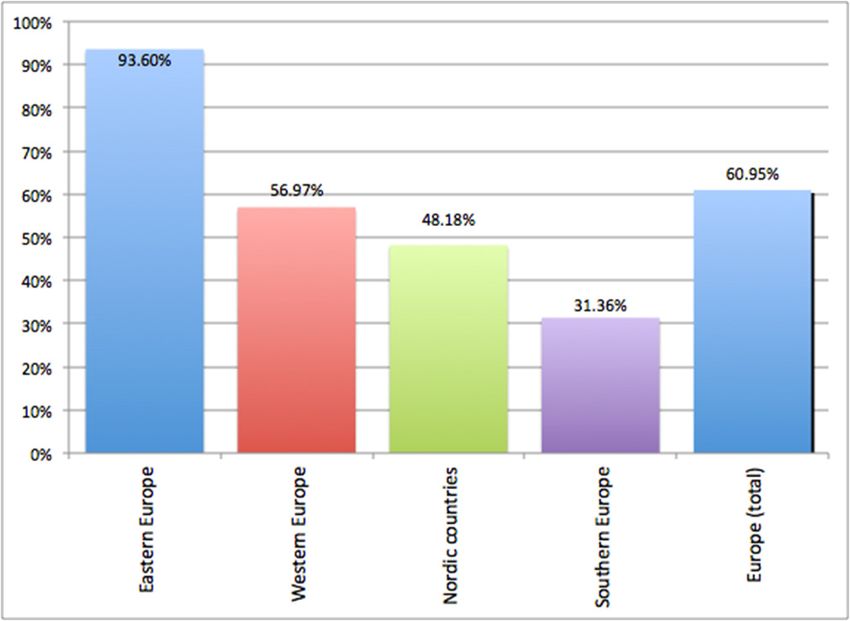
IEEE 802.3 Industry Connections Bandwidth Assessment                                               19th July 2012

  •     Kimball Brown, LightCounting, “Server Bandwidth Scenarios - Signposts for 40G/100G Server
        Connections” [8];
  •     Tom Cloonan, Arris, “Bandwidth Trends on the Internet... A Cable Data Vendor's Perspective” [9];
  •     Scott Kipp, Brocade, “Storage Growth and Ethernet” [10];
  •     Mark Nowell, Cisco, “Cisco Visual Networking Index (VNI) Global IP Traffic Forecast Update;
        2010 - 2015” [11];
  •     Petar Pepeljugoski and Paul Coteus, IBM, “Bandwidth needs in HPC taking into account link redun-
        dancy” [12];
  •     Xi Huang, Huawei, “Bandwidth Needs in Core and Aggregation nodes in the Optical Transport Net-
        work” [13];
  •     Henk Steenman, AMS-IX / Euro-IX, “The European Peering Scene” [14];
  •     Lone Hansen, BSRIA, “Global Data Centres Presentation IEEE” [15];
  •     Eli Dart, ESnet, “Data Intensive Science Impact on Networks” [16].

All contributed information is solely the perspective of the respective contributors.

2.2 Assessment limitations

Given the magnitude of the task, it is understandable that there were a number of limitations faced by the ad
hoc during the course of this assessment:
  •     As approved, the duration of the Ad Hoc was for a maximum duration of 18 months [17]. This time
        duration placed a limit on the amount of data that could be gathered. This is countered, however, by
        the fact that the longer the duration of the information gathering, the more the data becomes dated
        and potentially inaccurate. It should be noted that all submitted information should be considered a
        snapshot of the perceived bandwidth requirements at the time of submission.
  •     Bandwidth forecasts based on past trends may not be an accurate predictor of future bandwidth
        requirements. Other influences such as, but not limited to, emerging bandwidth intensive applica-
        tions, availability of technologies to support higher bandwidth needs, costs, and standardization
        efforts may have an impact on bandwidth requirements. Also, the potential inaccuracy in any fore-
        casted data will grow the further out in time one looks.
  •     There are underlying assumptions regarding market adoption of technologies and the continuation
        of businesses and consumers utilizing applications (present, emerging, and yet to be developed) that
        require increasing bandwidth capabilities.

3. Key findings

3.1 Introduction

The following is a summary of the key findings from all contributed information. All contributed informa-
tion is the sole perspective of the respective contributors. It should be noted that all submitted data should be
considered a snapshot of the perceived bandwidth requirements at the time of submission.

3.2 Visual Networking Index

This section discusses the overall global IP network and the various trends within the network that are
behind the on-going bandwidth explosion being seen throughout the network [11].

                                                                                                                4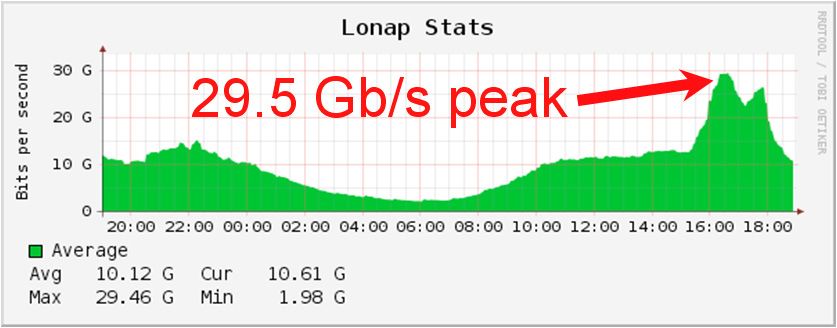
IEEE 802.3 Industry Connections Bandwidth Assessment                                              19th July 2012

As noted in the 2007 IEEE 802.3 Higher Speed Study Group (HSSG) Tutorial [18], the bandwidth explosion
everywhere was being driven by the increase in the number of users, increased access methodologies and
rates, and increased services (such as, but not limited to, video on demand, social media, etc.). It was sim-
plistically captured by Equation (1). While simplistic, this equation provides a meaningful way to under-
stand the underlying forces driving the never-ending bandwidth explosion networking has been
experiencing.

     Increased             Increased access                Increased              Bandwidth
                    x                               x                      =                                (1)
    no of users           rates and methods                 services              explosion

Globally, the number of Internet users is forecast to increase from 1.9 billion users in 2010 to 3 billion Inter-
net users in 2015. Table 1 breaks down these numbers by region.

                    Table 1—2015 Regional forecast of users and connections

                                                          Internet        Network
                                  Region                   users         connections
                                                          (million)        (billion)

                         North America                      288                 2.2
                         Latin America                      260                 1.3
                         Western Europe                     314                 2.3
                         Central/Eastern Europe             201                0.902
                         Asia Pacific                      1330                 5.8
                         Japan                              116              0.727
                         Middle East & Africa               495                 1.3

The number of Internet users alone is insufficient information, as a single end-user may have multiple types
of devices. It is forecast that in 2015 there will be nearly 15 billion fixed and mobile networked devices and
machine-to-machine connections. The increase in the number of consumer broadband devices affects band-
width in a number of ways. It enables a consumer to be continuously consuming bandwidth, as well as to be
consuming bandwidth on multiple devices simultaneously. Also, different consumer broadband devices
enable different applications, which may have greater traffic generation capability. For example, Table 2
compares the amount of traffic on a fixed network that newer, next-generation devices will create, using the
traffic created by a 32-bit laptop as a baseline [11].

In addition to these increases, a 4 times increase in fixed broadband speeds is forecast for 2015, as the aver-
age fixed broadband speed of 7 Mb/s in 2010 is expected to rise to 28 Mb/s in 2015 [19]. Table 3 tabulates
the growth of average broadband speeds for the 2010 to 2015 time period [11].

These forecasts are all for average fixed broadband speeds. However, in 2015 68 % of all broadband con-
nections are forecast to be at least 5 Mb/s, 40 % will be at least 10 Mb/s, and 3 % will be at least 100 Mb/s
[11].

5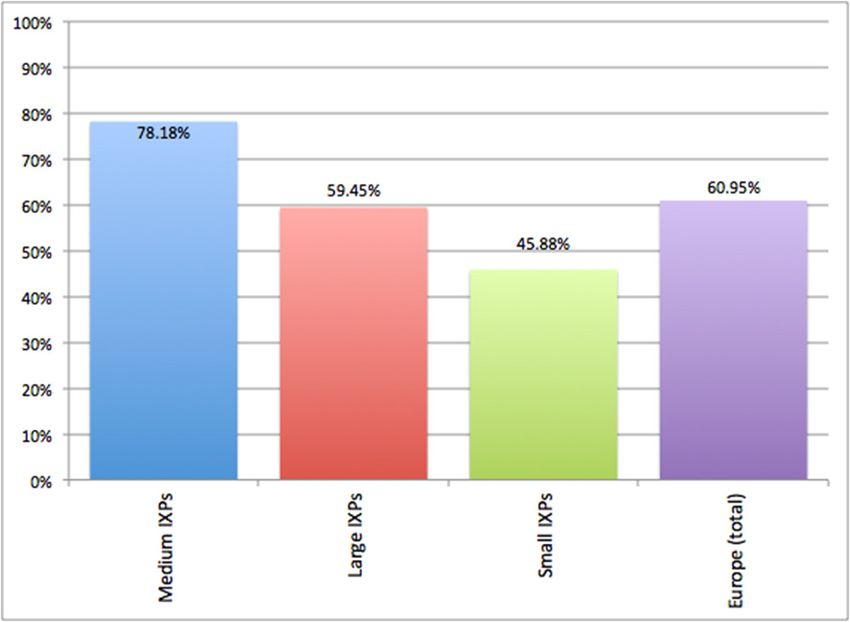
IEEE 802.3 Industry Connections Bandwidth Assessment                                               19th July 2012

                       Table 2—Fixed network traffic generation comparison

                                      Device                  Traffic multiplier

                            Tablet                                    1.1
                            64-bit Laptop/PC                          1.9
                            Internet enabled HDTV                     2.9
                            Gaming console                            3.0
                            Internet enabled 3D TV                    3.2

                          Table 3—Growth of broadband speeds by region

                                                   2010             2015            Growth
                          Region
                                                  (Mb/s)           (Mb/s)           factor

                North America                       7.5               27               3.7
                Latin America                       2.8               8                2.9
                Western Europe                      9.2               36               3.9
                Central/Eastern Europe              6.1               20               3.3
                Asia Pacific                        5.5               25               4.6
                Japan                              15.5               64               4.1
                Middle East & Africa                2.8               7                2.5

As described in Equation (1) with the increase in access capabilities and applications, one would expect
increased bandwidth usage. This expectation is observed by various forecasts [11]:
  •     Traffic per average Internet user will grow from 7.3 gigabyte per month to 24.8 gigabyte per month
  •     Traffic per average Internet household will grow from 17.1 gigabyte per month to 61.8 gigabyte per
        month
  •     Global consumer Internet traffic / applications will have a 34 % compound annual growth rate
        (CAGR) from 2010 to 2015 and reach nearly 60 exabytes per month. (1 exabyte is 1018 bytes.)
  •     Consumer Internet video will experience a 48 % CAGR from 2010 to 2015 and reach approximately
        35 exabytes per month.
  •     Internet video (including video calling) will increase from 40 % to approximately 61 % of all con-
        sumer Internet traffic [19].

Taking all of these trends into consideration, it is forecast that from 2010 to 2015 global IP traffic will expe-
rience a 4-fold increase from 20 exabyte per month in 2010 to 81 exabyte per month in 2015, a 32 % CAGR.
Table 4 provides a breakdown of predicted IP traffic for 2015 by region [11].

Mobile data will experience a 92 % CAGR between 2010 and 2015, but still only account for 7.77 % of the
overall traffic in 2015. Fixed/Wired will experience a 24 % CAGR during the same period, and account for
46.1 % of the overall traffic in 2015. Finally, Fixed/Wi-Fi® will experience a 39 % CAGR over this period,
and account for 46.2 % of all traffic. Figure 2 summarizes the global IP traffic by local access technology
[11].

                                                                                                                6
IEEE 802.3 Industry Connections Bandwidth Assessment 19th July 2012
Table 4—2015 Regional IP traffic forecast
Growth factor
IP Traffic
Region since 2010
(exabyte/month)
(CAGR)
North America 22.3 3 x (26 %)
Latin America 4.7 7 x (48 %)
Western Europe 18.9 4 x (32 %)
Central/Eastern Europe 3.7 5 x (39 %)
Asia Pacific 24.1 4 x (35 %)
Japan 4.8 3 x (27 %)
Middle East & Africa 2.0 8 x (52 %)
Figure 2—Global IP traffic by local access technology
3.3 Storage growth
The total amount of data created or replicated on the planet in 2010 was over 1 zettabyte (1 zettabyte is 1021
bytes) - that’s 143 GB for each of the 7 billion people on the planet [10].
According to the “Digital Universe” study [10], stored data is growing at 40 % to 50 % per year (i.e., dou-
bling every two years) compared to IP traffic growth of 30 % to 40 % per year. While 75 % of this data is
created by individuals, enterprises have some responsibility for 80% of it at some point in its life. 25 % of
data is generated by machines and that is growing fast with sensors and remote monitoring on the increase.
7IEEE 802.3 Industry Connections Bandwidth Assessment 19th July 2012
Over the next decade, the number of servers (physical and virtual) is expected to grow by a factor of 10, stor-
age is expected to grow by a factor of 50 (see Figure 3) and the number of files is expected to grow by a fac-
tor of 75 [10].
Figure 3—Storage growth
One example of a large data source is the Large Hadron Collider [10] which generates 15 petabyte of data
per year (1 petabyte is 1015 bytes) which is then replicated at 11 Tier 1 storage sites around the world (150+
petabyte of storage) and partially replicated at a further 160 Tier 2 sites requiring an additional 150+ pet-
abyte of storage per year.
There are a number of ways to access storage from the network [10] as shown in Figure 4.
8IEEE 802.3 Industry Connections Bandwidth Assessment 19th July 2012
Figure 4—Storage access arrangements
External storage sales was about 17 exabyte in 2011 and is projected to grow to about 90 exabyte in 2015
(About 1 % of the digital universe as shown in Figure 3). Ethernet-based storage is expected to grow to over
50 % of storage capacity in 2015 [10]. See Figure 5.
Figure 5—Ethernet based storage growth
9IEEE 802.3 Industry Connections Bandwidth Assessment 19th July 2012
Some discernible trends in storage are [10]:
• Application migration benefits from networked storage compared to direct attached storage;
• Cloud computing requires major data moves;
• Virtual Desktop Infrastructure (VDI) leads to centralized storage and increased network traffic;
• Solid State Drives (SSDs) or flash storage leads to higher bandwidth demands on the network.
Cloud computing offers the vision of hosting and scaling applications from the data center to the cloud pro-
vider or another data center on demand [10]. To enable this transition, the data needs to be exchanged or
mirrored from the primary data center to the cloud provider or secondary data center first. See Figure 6.
From the total storage of 7.9 zettabyte projected to be needed in 2015, 0.8 zettabyte (10 %) is expected to be
in maintained in a cloud and 1.4 zettabyte (20 %) is expected to be “touched” by cloud computing service
providers [10].
Figure 6—Data mirroring between storage arrays
Virtual Desktop Infrastructure (VDI) as depicted in Figure 7 enables centralized management and simple
upgrades to software and applications at the expense of an increase in LAN traffic [10].
10IEEE 802.3 Industry Connections Bandwidth Assessment 19th July 2012
Figure 7—Virtual desktop infrastructure architecture
3.4 Data center
3.4.1 Server bandwidth scenarios
This section will cover information related to server bandwidth scenarios [8].
Today, 90 % of server units in the market are based on the x86 architecture. Figure 8 shows LightCounting's
forecast of the transition of 1GbE server ports to 10GbE server ports. In 2011 10GbE server ports account
for about 17 % of the total, but this is forecast to grow to 59 % in 2014.
Figure 8—LightCounting forecast: server transition, 1GbE to 10GbE
This growth is fueled by the capabilities of PCIe (Peripheral Component Interconnect Express). Table 5 tab-
ulates the total bandwidths (both directions) for the different generations of PCIe and Figure 9 plots the PCIe
bandwidth (both directions) for x8 links by generation.
11IEEE 802.3 Industry Connections Bandwidth Assessment 19th July 2012
Table 5—PCIe bandwidth (both directions)
Link width
x1 x2 x4 x8 x16
PCIe 1.x (gigabyte/s) 0.5 1 2 4 8
PCIe 2.x (gigabyte/s) 1 2 4 8 16
PCIe 3.0 (gigabyte/s) 2 4 8 16 32
Figure 9—PCI Bandwidth by generation
From an Ethernet perspective, PCIe 3.0 can support 40 Gb/s in a x8 configuration. It is anticipated that the
next generation of PCIe will support 100 Gb/s in a x8 configuration, but the future of PCIe was unknown at
the time of writing this assessment. It was suggested that PCIe 4.0 would enable dual 100GbE server ports
starting in 2015 [8].
A view of how the I/O bandwidth for servers is expected to grow over the next few years is shown in
Table 6. This perspective is based on three definitions of classes for servers:
• Free: A large portion of server buyers will only implement what is offered as the base configuration.
These buyers would choose the "Free" option.
• Performance: Users who demand more I/O performance due to virtualization or, in some cases, the
desire to converge the SAN and LAN networks within the rack.
• Fringe: Users who demand the most possible bandwidth. The servers that would need this band-
width would typically be the high end 4 or 8 socket versions (translating into 40 or 80 cores in
Intel’s Romley cycle, and huge amounts of memory).
12IEEE 802.3 Industry Connections Bandwidth Assessment 19th July 2012
Table 6—Server interconnect scenarios
Year Free Performance Fringe
2011 2 x 1GbE LOM 2 x 1GbE LOM 2 x 1GbE LOM
n x 1GbE NIC n x 10GbE NIC
2012 2 x 1GbE LOM Option 2 x 10GbE LOM Option 2 x 10GbE LOM Option
n x 40GbE NIC
2014 2 x 10GbE LOM Option 2 x 10GbE LOM Option 2 x 40GbE LOM Option
n x 10GbE NIC n x 40GbE NIC
2016 2 x 10GbE LOM Option 2 x 10GbE LOM Option 2 x 40GbE LOM Option
n x 40GbE NIC n x 100GbE NIC
3.4.2 High performance computing
This section describes observations of bandwidth needs in high performance computing (HPC) [12].
During the 2006 IEEE 802.3 Call-For-Interest for a Higher Speed Ethernet Study Group, it was observed
that during the period of 1993 to 2005 performance, as measured by average gigaflops per second, had pro-
ceeded in a very predictable linear manner for High Performance Computing: every four years corresponded
to a 10x leap in processing power [20]. See Figure 10.
Figure 10—Observed HPC performance trend from 2006 HSSG CFI
At this point in time, the US government is targeting an exascale machine by 2019, which is more than two
orders of magnitude in performance improvement over today’s fastest machines [12].
While single line data rates are anticipated to increase, it is not anticipated that they will grow by a corre-
sponding two orders of magnitude in performance, hence it is anticipated that increased parallelism will be
13IEEE 802.3 Industry Connections Bandwidth Assessment 19th July 2012
necessary to meet the performance requirements for system interconnects in order to meet the necessary per-
formance targets.
Current Ethernet link technologies do not employ lane redundancy. There is a concern that the use of
increased parallelism will make these links more vulnerable to failure. Failure analysis indicates an unac-
ceptable number of single fiber fails for a typical HPC/server environment.
It has been suggested by the authors that at least 400 Gb/s will be needed for future HPC/server environ-
ments. It has also been suggested that investment in extra bandwidth for lane redundancy is also necessary.
3.4.3 Data center bandwidth scenarios
This section discusses potential bandwidth scenarios by looking at different server configurations and then
looking at the bandwidth throughout the data center network [6].
Four types of intra / inter cluster traffic were identified: 1) Within a rack; 2) Between racks; 3) Cluster-to-
cluster; and 4) Server-to-link. Their characteristics are defined in Table 7.
Table 7—Types of communication
Latency
No of switches No of links Reach
(No of switches)
Within a rack 1 1 2 Few meters
Between racks within a cluster 3 3 4 < 100 m
Cluster to cluster 5+ 5+ 6 100’s of m
Server to Internet 3+ 3+ plus router 4+ 100’s of m
The bandwidth to and from rack switches, based on various I/O capabilities per server, number of uplinks,
and different subscription rates is tabulated in Table 8.
The bandwidth of a cluster will then depend on the number of racks within a given cluster. For example, a
40 server rack might produce anywhere from 0.4 to 3.2 terabit per second (Tb/s). A cluster, consisting of
twenty-five of these racks, would produce 10 to 80 Tb/s. Typically, there is a high oversubscription rate to
the wide area network (WAN), as illustrated in Table 9. High oversubscription rates occur because users
don't perceive a need for 1:1 subscription and won't pay for it.
3.4.4 Global data centers
This section covers the findings of an international survey conducted by BSRIA [15]. The scope of the
online survey included individuals from the United States, United Kingdom, Germany, France, India, and
China in the following sectors:
• Government (federal, military, state, and local)
• Finance and insurance
• Healthcare (and pharmaceutical)
• Education (primary, secondary, and universities)
• Professional and information services
• Co-location, co-hosting, and carrier hotels.
14IEEE 802.3 Industry Connections Bandwidth Assessment 19th July 2012
Table 8—Bandwidth to / from rack switches
I/O per server (Gb/s)
5 10 20 40 80
Servers / rack 40 40 40 40 40
Bandwidth / rack (Gb/s) 200 400 800 1600 3200
10GbE uplinks with 1:1 subscription 20 40 80 160 320
40GbE uplinks with 1:1 subscription 5 10 20 40 80
100GbE uplinks with 1:1 Subscription 2 4 8 16 32
10GbE uplinks with 4:1 subscription 5 10 20 40 80
40GbE uplinks with 4:1 subscription 1.25 2.5 5 10 20
100GbE uplinks with 4:1 subscription 0.5 1 2 4 8
Table 9—Oversubscription to WAN
Bandwidth cluster to core (Tb/s)
0.4 1 2 4
Clusters 10 10 10 10
Bandwidth to core (Tb/s) 4 10 20 40
Bandwidth to WAN (Gb/s) 20 40 200 400
Oversubscription to WAN 200 250 100 100
Figure 11 illustrates the speeds deployed within the surveyed data centers in 2011 and what is expected in
2013. The trend towards higher speed links and away from the lower speeds is noticeable. This is also
noticeable in Figure 12, which is broken out to the Finance, Government, and Health sectors.
15IEEE 802.3 Industry Connections Bandwidth Assessment 19th July 2012
Figure 11—Data center study - percentage of links by speed
Figure 12—Speeds in finance, government, and health
Table 10 provides insight into deployed media on a per speed basis. Details regarding the information in
Table 10 are not available for further exploration.
Table 10—Media deployment
Media 10 G 40 G 100 G
Over copper point-to-point links 33 % 11 % 11 %
Over copper structured cable 26 % 38 % 23 %
Over OM3 / OM4 multimode fiber cable 25 % 29 % 41 %
Over single-mode fiber cable 13 % 21 % 20 %
16IEEE 802.3 Industry Connections Bandwidth Assessment 19th July 2012
3.5 Data intensive science
Modern science is becoming increasingly dependent on high speed data networks and is generating ever
increasing amounts of traffic [16].
Perhaps the best known example of this is the Large Hadron Collider (LHC) at CERN. The ATLAS detector
alone generates very large data sets (transfers of tens of terabytes are routine) with automated data distribu-
tion to two tiers of storage sites [10] over multiple continents.
The ATLAS detector generates ~1 petabyte per second from the instrument (1 petabyte is 1015 bytes) and a
multi-stage trigger farm reduces this to ~200 to 400 megabyte/s with additional data from event reconstruc-
tion. This data is then distributed to multiple international collaborating organizations via 10 to 40 Gb/s links
out to large repositories in Europe, North America, and Asia as well as 5 to 10 Gb/s links to analysis centers
worldwide [16]. This will increase over time as the LHC is upgraded.
A second example data source is genome sequencing [16]. While this field is clearly in its infancy, a signifi-
cant increase in the data it is generating can already be seen. This increase is coming from two directions:
• Per-instrument data rate is increasing significantly (~10x over 5 years)
• Cost of sequencers is plummeting (10x over 5 years) – Human genome sequencing cost $10,500 in
July 2011 from $8.9 million in July 2007 – NYTimes
The use of genomics (and hence the need to transfer genomics data) is expanding very rapidly as the science
improves and new applications are discovered.
Many of the instruments used in basic science research are essentially high-resolution digital cameras and
the data rates from these instruments are increasing with the capabilities of the instruments [16]. Some
instruments in development will be able to collect terabits per second of data internally but there is not
enough I/O capability on the chip to get all the data out so some level of on-chip data reduction will be
required. Transfer or streaming of the resulting data to computing resources will then be necessary. This is
typically at about 2.5 Gb/s today, but with a significant growth curve going forward.
An example of a new experiment that is currently under development is the Square Kilometer Array (SKA)
[16]. This is a very large radio telescope in the southern hemisphere with approximately one square kilome-
ter of combined signal collection area. This will have ~2800 receivers in the telescope array with most
receivers within a 180 km diameter area. There is an average run of about 100 km to the central correlator
which receives about 2 petabytes of data per second. Data will then be distributed to international collabora-
tors with an expected rate of about100 Gb/s from the correlator to other analysis centers worldwide. Other
experiments that are likely to generate large amounts of data include sensor networks, ITER, etc.
The very structure of modern science assumes there is a network interconnecting all parts of the collabora-
tion [16]. Large, unique facilities (e.g. LHC, SKA, ITER) provide a focus for all members of a field with
data distributed to scientists and analysis results distributed among collaborators. Data analysis using local
resources also drives data movement. For example, a large simulation run at a supercomputer center fol-
lowed by secondary analysis at home institution. The modern trend is towards large data sets with increasing
scope for collaboration over analysis where scientific productivity is gated on data analysis. In the general
case both data moved to analysis and analysis moved to data must be supported.
The Energy Sciences network (ESnet) provides a data network that links scientists at national laboratories,
universities and other research institutions. Figure 13 shows how the traffic on this network has evolved
from January 1990 to August 2011. This network is expecting 100 petabytes per month of data in 2015 [16].
17IEEE 802.3 Industry Connections Bandwidth Assessment 19th July 2012
Figure 13—ESnet accepted traffic (petabytes per month)
Networks for data intensive science have somewhat different characteristics from other networks. For a
given bandwidth, they have much larger per-flow rates and a much smaller flow count. There is often a sig-
nificant fraction (10 to 50 %) of link bandwidth in a single flow (often over intercontinental distances). In
future, data rates are expected to continue to increase due to sensor data rate scaling with semiconductor
capabilities and large facilities replicating data multiple times within large collaborations [16]. Science net-
works are expected to continue to see a different traffic profile with relatively small flow count and rela-
tively large flow rates (which does not favor LAG-like implementations).
3.6 Financial sector
This section examines the bandwidth demand in the financial industry [7].
18IEEE 802.3 Industry Connections Bandwidth Assessment 19th July 2012
The financial industry's use of networking technology has grown significantly. For example, Figure 14 dem-
onstrates how the total number of messages per second for options data, equities trades, equities quotes, and
order traffic has grown exponentially over the past few years.
Figure 14—Financial industry and messaging
Another example is shown in Figure 15, which illustrates how source data from one data center was then
distributed via multicast into the public network and the resulting bandwidth impact.
Figure 15—Bandwidth distributed to the financial community
19IEEE 802.3 Industry Connections Bandwidth Assessment 19th July 2012
Figure 16 illustrates an exemplar external network.
Figure 16—Exemplar external network
The next generation network will employ a flat layer 2 approach with reaches of approximately 1000 feet
needed. Within an example data center environment, a number of interesting relevant data points were pro-
vided. There are approximately 10,000 servers that are mostly 2U and 4U rack servers with some blade serv-
ers. At the time of the presentation in mid 2011, there were more 1GbE servers than 10GbE servers, but
10GbE servers were being deployed that year, and it was indicated that 40GbE servers would be deployed in
2012. The servers were described as "off-the-shelf x86 servers from major OEM", which deploy x8 PCIe
slots. The typical servers being deployed have six 10GbE ports and / or eight 1GbE ports. A top-of-rack
(ToR) configuration is used, with two switches provided for every three racks. Multimode fiber links are
being used for short reach connections to the top-of-rack switches. Furthermore, the data center core band-
width was described as 18.35 Tb/s [21].
The optical footprint of a single center includes support for 170 lambdas, based on 10G and 100G wave-
lengths that support 1GbE and 10GbE circuits for a total delivery of 2.87 Tb/s. The 100G wavelengths bear
further consideration - initially the plan for the specific data center specified four 100G wavelengths, but
ultimately thirteen 100G wavelengths were deployed. At the time of the presentation the thirteen 100G
wavelengths were being used to support delivery of one hundred and thirty 10GbE circuits. There was a
stated immediate need for terabit links for the core network and external links [21].
Additionally, the financial industry is known to be sensitive to latency. Low latency data is uncompressed,
and requires more bandwidth. The financial industry is looking for latency numbers to be reduced from mil-
liseconds to microseconds.
20IEEE 802.3 Industry Connections Bandwidth Assessment 19th July 2012
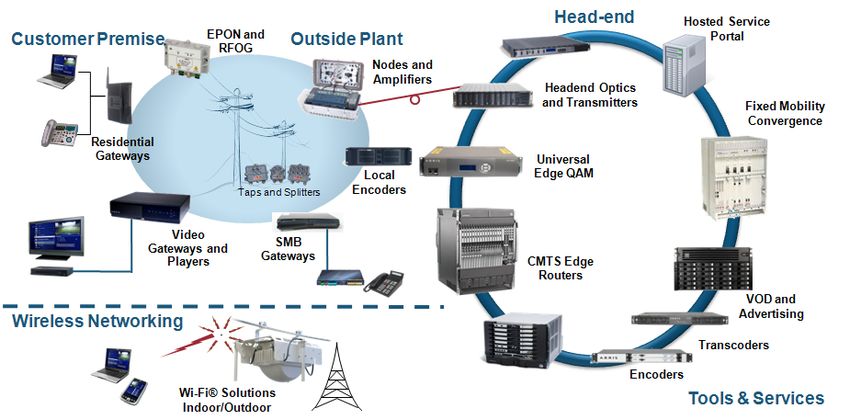
3.7 Cable data
This section discusses the bandwidth trends for the cable industry and also aims to predict that trend in the
future. The various devices involved in the cable infrastructure [9] are shown in Figure 17.
Figure 17—The cable infrastructure
The bandwidth related terms that are used in this section are defined according to Figure 18.
Figure 18—Bandwidth related terms
The average consumed bandwidth is used quite extensively for traffic engineering calculations (determining
how much capacity is required to satisfy a given Service Group (pool) of subscribers).
21IEEE 802.3 Industry Connections Bandwidth Assessment 19th July 2012
Data for the maximum permitted downstream bandwidth over time is plotted in Figure 19 [9]. This plot
(which is on a logarithmic vertical scale) shows a roughly constant rate of increase in maximum permitted
downstream bandwidth of about 1.5 times per year over the 29 years from 1982 to 2011.
Figure 19—Maximum permitted downstream bandwidth trend
This trend (a 50% Compound Annual Growth Rate (CAGR) for a high end user’s Internet connection speed)
is called “Nielsen's Law of Internet bandwidth”. If this trend were to be continued, it would predict a maxi-
mum permitted downstream bandwidth of about 300 Mb/s by 2016.
Data for the average downstream byte consumption for a typical 40k HHP (House-Holds Passed) head-end
over time is plotted in Figure 20 [22]. This plot (which is also on a logarithmic vertical scale) predicts an
average downstream byte consumption in a 40k HHP head-end of about 8.51015 bytes by 2016 which is an
increase of roughly 10 times over the average downstream byte consumption seen in 2011.
Data for the average downstream bandwidth over time is plotted in Figure 20 [9]. This plot (which is also on
a logarithmic vertical scale) predicts an average downstream bandwidth of about 3.5 Mb/s by 2016 which is
an increase of roughly 10 times over the average downstream bandwidth seen in 2011.
22IEEE 802.3 Industry Connections Bandwidth Assessment 19th July 2012
Figure 20—Average downstream byte consumption trend
Data for the maximum permitted upstream bandwidth over time is plotted in Figure 21 [9]. This plot (which
is on a logarithmic vertical scale) shows a roughly constant rate of increase in maximum permitted upstream
bandwidth of about 1.1 times per year. Upstream bandwidth is comprised of two types of traffic: protocol
messages (e.g., HTTP GETs, TCP ACKs, etc.) and uploads (e.g., P2P torrents, web page inputs, FTP trans-
fers). The protocol message bandwidth is predictable [9] and so it should increase in line with the rate of
downstream bandwidth increase. The upload bandwidth is harder to predict [9] as it is highly dependent on
the popularity of apps at any given time. For example when P2P represented a large percentage of the traffic
in 2008, upstream bandwidth was ~41 % of downstream bandwidth. However, when over-the-top IP video
(delivery of video content from sources other than the ISP) became popular in 2010, upstream bandwidth
dropped to be only ~28 % of downstream bandwidth.
23IEEE 802.3 Industry Connections Bandwidth Assessment 19th July 2012
Figure 21—Maximum permitted upstream bandwidth trend
If the maximum permitted upstream bandwidth trend continues to grow at a 10 % CAGR, then it would be
expected rise to ~8 Mb/s by 2016. However, indicators are that this upstream trend could grow at a much
faster rate in the next four years.
Data for the average upstream byte consumption for a typical 40k HHP (House-Holds Passed) head-end
over time is plotted in Figure 22 [22]. This plot (which is also on a logarithmic vertical scale) predicts an
average downstream byte consumption in a 40k HHP head-end of about 4.21014 bytes by 2016 which is an
increase of roughly 2.7 times over the average downstream byte consumption seen in 2011.
24IEEE 802.3 Industry Connections Bandwidth Assessment 19th July 2012
Figure 22—Average upstream byte consumption trend
In the period since 2009, there has been a rapid uptake of over-the-top IP video which has helped drive the
continual increase in downstream consumption that is shown in Figure 20. This transition has also changed
the mix of traffic types carried over the cable networks. These changes can be clearly viewed within
Figure 23.
The increase in average downstream bandwidth per subscriber during the period 1Q 2010 to 1Q 2011 [9] is
shown in Figure 23.
25IEEE 802.3 Industry Connections Bandwidth Assessment 19th July 2012
Figure 23—Mix of traffic type vs. time
In order for the bandwidth trends predicted above to materialize, the available equipment must be able to
support the predicted bandwidths at acceptable cost levels. The following explores this topic from the point
of view of DOCSIS Cable Modem Termination System (CMTS) equipment, which serve 20 to 50 “Service
Groups”. For a typical single high speed data “Service Group” with ~1000 homes passed, MSOs [9] predict:
• 2008: 1 DOCSIS Downstream (~40 Mb/s)
• 2011: 4 DOCSIS Downstreams (~160 Mb/s)
• 2015: ~20 DOCSIS Downstreams (~800 Mb/s)
To support this need the Converged Cable Access Platform (CCAP) has been designed with a 20 to 80 times
increase in capacity, a 14 to 60 times power per bit reduction and a 20 to 80 times space per bit reduction [9].
The new technologies becoming available to support this are described in Table 11.
Table 11—Enabling technologies for CCAP
Building blocks 2007 capabilities 2011 capabilities Increase factor
L2/L3 switch chips 60 Gb/s 640 Gb/s 10
Digital-to-analog converters 1 channel / chip 100+ channels / chip 100
Burst receivers 2 channels / chip 12 channels / chip 6
Processor chips 2 cores / chip 32 cores / chip 16
26IEEE 802.3 Industry Connections Bandwidth Assessment 19th July 2012
3.8 Optical Transport Network
For the purpose of this section the network is divided into the following categories [13] (See Figure 24):
• Access Node: xDSL, FTTx, 3G, Wi-Fi …
• Aggregation Node: Aggregate the data from access node to the edge of metro networks
• Core Node: Transport data in backbone networks
Where the “Optical Transport Network (OTN) consists of the Aggregation Nodes and the Core Nodes.
Figure 24—Network classification
Figure 25 and Figure 26 [13] show the projected bandwidth needs of operators from China in Aggregation
Nodes and Core Nodes respectively. As the networks of three Chinese operators are not the same, the band-
width per wavelength in an Aggregation Node or a Core Node shows some variation.
The bandwidth per wavelength in an Aggregation Node is expected to converge around 100G in 2015 and is
expected to be in the range of 200G to 400G in 2020.
The bandwidth per wavelength in a Core Node is expected to be in the range of 100G to 400G in 2015 and is
expected to be in the range of 400G to 1T in 2020.
27IEEE 802.3 Industry Connections Bandwidth Assessment 19th July 2012
Figure 25—Bandwidth needs per wavelength in an Aggregation Node - China
Figure 26—Bandwidth needs per wavelength in a Core Node - China
Figure 27 and Figure 28 [13] show the projected bandwidth needs of operators from Asia in Aggregation
Nodes and Core Nodes respectively. As the development levels of Asian countries are so different, the band-
width per wavelength in an Aggregation Node or a Core Node varies significantly from 2011 onwards.
The bandwidth per wavelength in an Aggregation Node is expected to be in the range of 40G to 100G in
2015 and is expected to be in the range of 100G to 400G in 2020.
The bandwidth per wavelength in a Core Node is expected to be in the range of 100G to 400G in 2015 and is
expected to be in the range of 400G to 1T in 2020
28IEEE 802.3 Industry Connections Bandwidth Assessment 19th July 2012
Figure 27—Bandwidth needs per wavelength in an Aggregation Node - Asia
Figure 28—Bandwidth needs per wavelength in a Core Node - Asia
Figure 29 and Figure 30 [13] show the projected bandwidth needs of operators from Africa in Aggregation
Nodes and Core Nodes respectively. Due to the large difference in economic development, Africa shows a
much lower rate of increase for bandwidth demand than Asia.
The bandwidth per wavelength in an aggregation node is expected to be up to 40G in 2015 and is expected to
be up to 100G in 2020.
The bandwidth per wavelength in an core node is expected to be up to 200G in 2015 and is expected to be up
to 400G in 2020.
29IEEE 802.3 Industry Connections Bandwidth Assessment 19th July 2012
Figure 29—Bandwidth needs per wavelength in an Aggregation Node - Africa
Figure 30—Bandwidth needs per wavelength in a Core Node - Africa
30IEEE 802.3 Industry Connections Bandwidth Assessment 19th July 2012
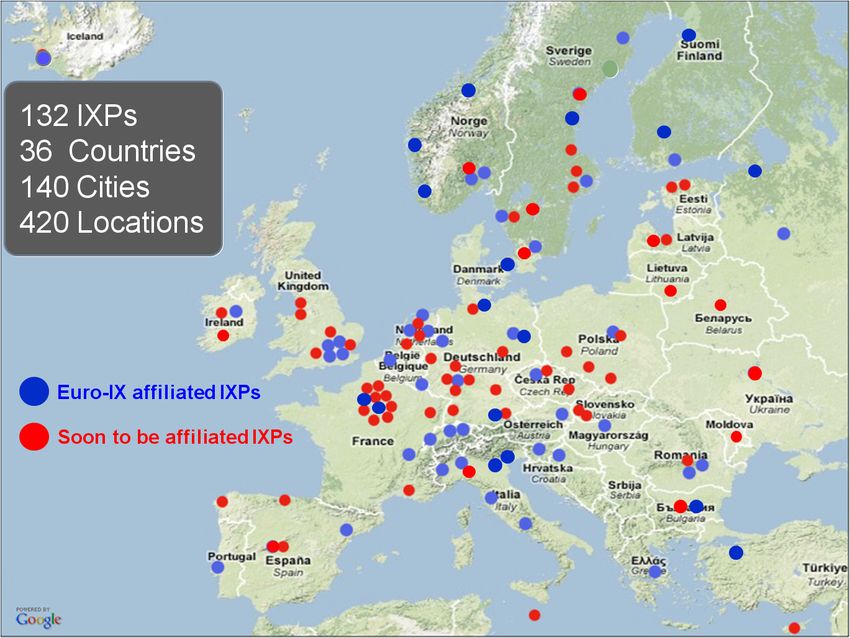
3.9 European peering
The European Internet Exchange Association (Euro-IX) is made up of 60 affiliated IXP entities: 46 from
Europe (27 countries) and 14 from the rest of the world operating a total of 160 IXPs worldwide [14]. A map
showing the location of Euro-IX affiliated and soon to be affiliated IXPs is shown in Figure 31.
Figure 31—Euro-IX IXP locations
The formal definition of an Internet Exchange Point (IXP) (for example used in RIPE-451) is:
A physical (Ethernet based) network infrastructure operated by a single entity whose purpose it is to
facilitate the exchange of Internet traffic between ISPs. There must be a minimum of three ISPs
connected.
ISP in this context is any company that sends and/or receives Internet IP traffic.
The global distribution of IXPs [14] is shown in Table 12.
Table 12—Global distribution of IXPs
Number of
Region % of total
IXPs
Europe 132 41 %
Asia/Pacific 60 19 %
Africa 22 7%
Latin America 27 8%
North America 80 25 %
Global 321
31IEEE 802.3 Industry Connections Bandwidth Assessment 19th July 2012
Over the last five years, the costs of Ethernet ports from the Euro-IX members have seen significant reduc-
tions [14] as shown in Table 13 and the usage of each port type has changed [14] as shown in Figure 32.
Table 13—Euro-IX european members average relative monthly Ethernet port costs
Port 2005 2010 Decrease
10 Mb/s 1 0.2 80 %
100 Mb/s 1 0.45 55 %
1 Gb/s 1 0.53 47 %
10 Gb/s 1 0.44 56 %
Figure 32—Euro-IX european member port usage trends
The combined Euro-IX european member IXP traffic shows a significant variation during the day [14]. On a
typical day in September 2011 the average was 4.08 Tb/s, the maximum was 6.80 Tb/s and the minimum
was 1.29 Tb/s which is a peak to trough ratio of 5.27.
This peak traffic rose from 4.9 Tb/s at the end of September 2010 to 7.2 Tb/s at the end of September 2011
which is a 49% increase in 12 months [14]. See Figure 33.
32IEEE 802.3 Industry Connections Bandwidth Assessment 19th July 2012
Figure 33—Euro-IX european member peak traffic growth
In addition to this steady growth in peak traffic, individual IXPs also see occasional spikes due to special
events (such as sport) [14]. Figure 34 shows the traffic at the LONAP (London) IXP on a normal weekday
when the peak traffic was 8.5 Gb/s. Figure 35 shows the traffic through the same IXP on a Wednesday when
there was a football match between England and Slovenia during the 2010 World Cup when the peak traffic
rose to 29.5 Gb/s.
Figure 34—LONAP (London) traffic on a ‘normal’ weekday
33IEEE 802.3 Industry Connections Bandwidth Assessment 19th July 2012
Figure 35—LONAP (London) traffic during the World Cup 2010 England vs. Slovenia
The annual IXP peak traffic growth rates show some variation according to the size of the IXP and also
according to region [14]. The Global annual IXP peak traffic growth rates in 2010 shown by IXP size are
given in Figure 36, shown by region within Europe are given in Figure 37 and shown by global region are
given in Figure 38.
Figure 36—Global annual IXP peak traffic growth rates by IXP size 2010
34IEEE 802.3 Industry Connections Bandwidth Assessment 19th July 2012
Figure 37—European annual IXP peak traffic growth rates by region 2010
Figure 38—Global annual IXP peak traffic growth rates by region 2010
35IEEE 802.3 Industry Connections Bandwidth Assessment 19th July 2012
Fitting an exponential trendline to the data from the end of August 2005 to the end of August 2010 shows
that the IXP peak traffic increase during this period was 12 times. See Figure 39.
If this trend continues, this would result in IXP peak traffic of 47 Tb/s by 2015. See Figure 39.
Figure 39—Five year peak European IXP traffic projection
4. Assessment
4.1 Peripheral growth trends
The key findings section of this report includes information on the growth trends for a variety of peripheral
devices that create data that is transmitted over Ethernet networks. In particular, these are:
• 3.2 Visual Networking Index
• 3.7 Cable data
• 3.3 Storage growth
• 3.4.1 Server bandwidth scenarios
As discussed in 3.2, the number of Internet users is steadily increasing, the rate that each of those users can
download (and upload) data is steadily increasing and there is a trend towards those users accessing increas-
ing amounts of video content via the Internet. These factors combined are predicted to cause a 32 % CAGR
for global IP traffic as shown in Figure 2. Similarly, in 3.7 it is shown that the trend for the maximum per-
mitted downstream bandwidth for cable users has shown a CAGR of 50 % for the past 29 years (see
Figure 19), the average downstream bandwidth has a similar slope (see Figure 20) and the cable industry is
developing future platforms to enable this trend to continue.
Data storage is also growing with a CAGR of about 50 % (see 3.3 for details). While this does not directly
relate to the rate of increase of Ethernet traffic, there is a trend towards data being maintained within a cloud
or being “touched” by cloud computing service providers, which does relate to Ethernet traffic increase.
Most Ethernet traffic involves a server at one or other end of the link. Section 3.4.1, and in particular Table 6
gives a view of how the I/O bandwidth for servers is expected to grow over the next few years. To relate this
information to Ethernet bandwidth demand requires knowledge of server deployment rates, the mix of the
various server types and the average utilisation of the server interfaces, but since for all server types there is
36You can also read