IFC SME Ventures Investing in Private Equity in Sub-Saharan African Fragile and Conflict-Affected Situations
←
→
Page content transcription
If your browser does not render page correctly, please read the page content below
IFC SME Ventures
Investing in Private Equity in Sub-Saharan African
Fragile and Conflict-Affected Situations

IN PARTNERSHIP WITH

© International Finance Corporation [2018]. All rights reserved.

2121 Pennsylvania Avenue, N.W.

Washington, D.C. 20433

Internet: www.ifc.org

The material in this work is copyrighted. Copying and/or transmitting portions or all of this work without permission may
be a violation of applicable law. IFC encourages dissemination of its work and will normally grant permission to reproduce
portions of the work promptly, and when the reproduction is for educational and non-commercial purposes, without a fee,
subject to such attributions and notices as we may reasonably require.

IFC does not guarantee the accuracy, reliability or completeness of the content included in this work, or for the conclusions
or judgments described herein, and accepts no responsibility or liability for any omissions or errors (including, without
limitation, typographical errors and technical errors) in the content whatsoever or for reliance thereon. The boundaries,
colors, denominations, and other information shown on any map in this work do not imply any judgment on the part of
The World Bank concerning the legal status of any territory or the endorsement or acceptance of such boundaries. The
findings, interpretations, and conclusions expressed in this volume do not necessarily reflect the views of the Executive
Directors of The World Bank or the governments they represent.

The contents of this work are intended for general informational purposes only and are not intended to constitute legal,
securities, or investment advice, an opinion regarding the appropriateness of any investment, or a solicitation of any type.
IFC or its affiliates may have an investment in, provide other advice or services to, or otherwise have a financial interest in,
certain of the companies and parties named herein.

All other queries on rights and licenses, including subsidiary rights, should be addressed to IFC Communications, 2121
Pennsylvania Avenue, N.W., Washington, D.C. 20433.

International Finance Corporation is an international organization established by Articles of Agreement among its member
countries, and a member of the World Bank Group. All names, logos and trademarks are the property of IFC and you may
not use any of such materials for any purpose without the express written consent of IFC. Additionally, “International
Finance Corporation” and “IFC” are registered trademarks of IFC and are protected under international law.

Cover Image:      SCS Malienne de Cartonnerie, a cardboard and packaging manufacturing plant backed by regional and
                  international investors. (Allen Nahounou, Mali, 2018)
October 2018

IFC SME Ventures
Investing in Private Equity in Sub-Saharan African
Fragile and Conflict-Affected Situations
Foreword

             Invitation to the world’s most underserved markets
             Small and medium-sized enterprises (SMEs) are important drivers of growth in economies across Sub-
             Saharan Africa, accounting for about 90% of all businesses in these markets. IFC’s research shows that
             more than 17 million SMEs in developing countries have unmet financing needs. Young, growing businesses
             lack the track record on which banks base their lending criteria. SMEs are often too large to be served by
             microfinance institutions, yet too small for commercial banks. They require ‘risk capital’ – forms of finance
             that have a higher risk tolerance than bank loans.

             Risk capital is particularly scarce in fragile and conflict-affected countries. Investors are wary of these
             markets for good reason – weak governance, poor infrastructure, unreliable energy supply, and physical
             safety concerns pose significant challenges. Yet the need for risk capital is most dire in fragile and frontier
             countries where SMEs can have an enormous impact on job creation and economic growth. With access to
             the right kind of capital, local entrepreneurs in fragile countries would be able to expand their businesses,
             create a significant number of jobs, and provide essential goods and services.

             It is for this reason that IFC, together with other development partners, created SME Ventures in 2008,
             an innovative program that provides risk capital in the form of debt instruments, quasi equity, and equity
             alongside technical assistance to entrepreneurs and fund managers in the world’s most challenging
             markets. IFC believes that supporting such Funds provides a cost-effective, results-oriented, and sustainable
             complement to other initiatives that support these markets.

             This report provides lessons from IFC’s decade of experience with SME Ventures, including the insights of fund
             managers who grapple with endless challenges. We intend for it to serve as a guide to investors and fund
             managers operating in difficult environments.

             We invite you to push the boundaries, explore the potential of underserved markets and support Africa’s
             resilient entrepreneurs.

             Kevin Warui Njiraini
             Director, Southern Africa and Nigeria, IFC
             October 2018

iv   IFC SME VENTURES
Acknowledgments
This study was led by Samuel Gaddiel Akyianu (Senior Operations Officer, IFC SME Ventures) and Jiyeon Janice
Ryu (Senior Operations Officer, FCS Africa).

The team is very grateful for comments received from Michel M. Botzung (Manager, FCS Africa), Cassandra
Colbert (former Country Manager, Côte d’Ivoire), Kailash Sharma Ramnauth (Country Manager, Madagascar
and Comoros), Rahila Malaika Danjuma (FCS Africa Consultant, Liberia), Katia Daude (Senior Country Officer,
Mozambique), Babacar Sedikh Faye (Resident Representative of the Democratic Republic of the Congo), Eric
Mabushi (FCS Africa Country Coordinator, Mali), Charlotte Ndaw (Senior Operations Officer, Côte d’Ivoire),
Aissata Tapo Niangado (FCS Africa Consultant Mali), Kevin Warui Njiraini (Director, Southern Africa and
Nigeria ), Markus Scheuermaier (FCS Africa Country Coordinator, Mozambique), Tracy Washington (Principal
Investment Officer, IDA/FCS Coordination Unit), and Olivier N'Gonian Yao (FCS Africa Country Coordinator,
Madagascar). Neha Sud (Communications Officer, IFC) provided editorial guidance and input.

Our deepest gratitude to all the fund managers in Côte d’Ivoire, Liberia, the DRC, Madagascar, Mali, and
Mozambique who gladly gave of their time for interviews, and a special thanks to Lesley Bendig (Present
Value) for her insightful contribution to the report.

This report was funded by IFC’s Fragile and Conflict-affected Situations (FCS) in Africa program and its SME
Ventures program. Funding for this publication was provided by Ireland, the Netherlands, and Norway,
which support our Conflict-affected Situations in Africa Initiative (CASA), and the Denmark Global Business
Innovation Partnerships, one of the supporting donors of the SME Ventures program.

It was researched in partnership with CrossBoundary LLC, a team led by Jake Cusack and Soline Miniere,
with support from Bryan Epps, Nathan Kelly, and Marcos Sampablo, and additional assistance from Malick
Antoine, Blaise Buma, Peter Douglas, Stefan Freeman, Claudia Masemola, Matthew O’Sullivan, Ousmane
Sacko, Busiswa Vilakazi, and Pooja Yadav. CrossBoundary LLC, a frontier market investment advisory firm,
has offices in Nairobi, Johannesburg, Bamako, Lagos, Dubai, New York City, and Washington, D.C.

The research for this report was primarily conducted between October 2017 and March 2018.

Creative design and copy-editing services were provided by ITL Communication and Design.

                              INVESTING IN PRIVATE EQUITY IN SUB-SAHARAN AFRICAN FRAGILE AND CONFLICT-AFFECTED SITUATIONS   v
Solar company employee installing a panel (Stefan Freeman, Mozambique, 2018)

vi       IFC SME VENTURES

Contents
Foreword                                                                                                                                                        iv
Acronyms                                                                                                                                                         3
1. Executive summary                                                                                                                                             5
2. Investors should adopt a context-specific approach                                                                                                            7
   Macroeconomic data and financing needs help to understand the country context...................................... 8
   Risk capital has a strong development impact and is desperately needed in fragile states ............................11
   FCS gross return expectations must be appropriate .................................................................................. 12
   A net return environment is particularly difficult ....................................................................................... 13
   Impact metrics and incentive structure are important to demonstrate investment
   value beyond financial returns.................................................................................................................. 15
       Frameworks and indicators to measure impact are becoming more standardized but are still diverse......................15
        Impact and return performances should be evaluated/incentivized in parallel ......................................................17

3. Challenges in investing in SMEs in fragile states                                                                                                           19
   Funds prioritize countries based on the attractiveness of the investment environment .............................. 20
      Security risks arising from political conflict or criminal violence as a result of diminished rule of
      law are challenges particularly relevant in fragile states...................................................................................20
        Macroeconomic factors, including currency risk, GDP growth, and population size will be used to generate
        a list of priority countries.............................................................................................................................20
        Political risks arising from institutional fragility and lack of government legitimacy diminish the
        attractiveness of fragile states ...................................................................................................................... 22
        The regulatory framework will influence investor confidence in a market............................................................ 22
        Between stable emerging markets and frontier markets, deal flow differs in quality, maturity, and size of companies.......23
        Companies targeted by impact investors tend to be informal............................................................................ 23
        High relative transaction costs decrease net IRR............................................................................................. 25
   During the investment process, risk capital investors will need to overcome the lack of knowledge of
   entrepreneurs, a weak banking system, and free donor money..................................................................25
       The investor has an educating role to play to increase the knowledge of entrepreneurs on equity investment........... 25
        A weak banking sector can be both a barrier and an opportunity for risk capital investors.................................... 25
        A high level of donor presence can provide unfair competition and hinder the potential of risk capital investors.......28
   During the managing period, risk capital investors must support growth to ensure high returns on investment ..... 29
      The lack of reliable infrastructure is a challenge limits returns on investment...................................................... 29
        Monitoring a company will be facilitated by being local, and finding relevant technical experts..............................31
   There are limited exit opportunities.......................................................................................................... 31
      Funds complain about the lack of flexibility in the timing of exits........................................................................31
        The lack of a secondary market is a characteristic of frontier markets..................................................................31
   Several challenges are cross-cutting in the investment process .................................................................. 32
      The lack of data and general information hinders the fund’s strategy development, pipeline creation,
      and monitoring of its investments ................................................................................................................ 32
        The lack of local skills needs to be overcome by risk capital investors.................................................................. 32
        The lack of a conducive and enabling business environment also contributes to low IRRs..................................... 33

                                     INVESTING IN PRIVATE EQUITY IN SUB-SAHARAN AFRICAN FRAGILE AND CONFLICT-AFFECTED SITUATIONS                                      1
Several funds described the challenges of raising a fund to invest in FCS ..................................................... 33
          A relevant track record is critical for fundraising and presents a significant challenge in FCS................................. 34
            Investor perception is sometimes that higher risks should lead to higher returns................................................. 34
            Fund location will influence its level of impact................................................................................................ 35

    4. Observed patterns and best practices for successful funds in fragile states                                                                                                  36
       Funds investing in FCS with better net returns often tend towards two ends of the strategy spectrum.........36
       Sectors can be selected based on observed patterns of success in comparable environments,
       nuanced by unique local context .............................................................................................................. 37
       Higher velocity and recycling of capital improve IRR .................................................................................39
       Specific mitigation strategies at all stages of the investment process can lso improve the risk/return profile........ 41
          GPs need to create innovative origination mechanisms.................................................................................... 41
       GPs working in FCS must adapt their investment strategy to the local context............................................ 41
          GPs should follow best practices in management and tailor monitoring tools to the portfolio company..................42
            GPs have found few mitigation mechanisms to the challenges of exiting investments ......................................... 43
       Technical assistance is an important tool that requires a nuanced approach...............................................43
       More broadly, the standard fund model is not well adapted to investing in SMEs in FCS.............................. 46

    5. Interventions to support risk capital entering in fragile states                                                                                                             50
       Exploring new ways to accommodate and attract other LPs into FCS........................................................ 50
       Creating comprehensive shared services and tailored toolboxes for GPs.....................................................52
       Country or regional investment facilitation platforms can catalyze risk capital provision.............................53

    Conclusion                                                                                                                                                                      54
    Appendix A: Definitional clusters of fragile states                                                                                                                             55

    Figures
            Figure 1: Dimensions of state fragility in SSA........................................................................................................................ 10
            Figure 2: Share of agriculture in GDP of SSA, 2016 (annual % GDP).......................................................................................... 11
            Figure 3: Share of services (a) and industry (b) in GDP of SSA, 2016 (annual % GDP)...................................................................12
            Figure 4: Africa versus other emerging markets’ investment-level returns as of June 30,
            2017 (vintage years 1995-2015)............................................................................................................................................ 14
            Figure 5: Stylized framework of gross returns for individual investments in FCS.........................................................................15
            Figure 6: Africa versus other emerging markets’ fund level status: liquidated versus
            active funds as of June 30, 2017.......................................................................................................................................... 16
            Figure 7: From gross returns to net fund performance.............................................................................................................17
            Figure 8: Example of fund performance frameworks.............................................................................................................. 18
            Figure 9: Representative sets of challenges at different stages of the investment process............................................................21
            Figure 10: Currency fluctuation, 2008-2018......................................................................................................................... 23
            Figure 11: Level of formalization by country category............................................................................................................. 26
            Figure 12: Domestic credit to private sector by banks, 2000-2016 (% of GDP)...........................................................................28
            Figure 13: Percentage of firms identifying access to finance as a major constraint (by firm size).................................................. 29
            Figure 14: Net ODA received as % of GNI, FDI net inflows as % of GDP, remittances as % of GDP.....................................................30
            Figure 15: Perceptions on severity and FCS-specificity of challenges, 2016................................................................................ 32
            Figure 16: Share of write-offs by investment size based on 323 exits from IFC-invested funds....................................................... 37
            Figure 17: FCS funds with better net realized returns often tend towards two ends of the
            spectrum: standardized flexible debt-type investments or majority control positions................................................................ 38
            Figure 18: Investment-level gross IRRs per sector.................................................................................................................. 39
            Figure 19: Distribution of sector shares in inward FDI flows across FCS, 2008–2014................................................................. 40
            Figure 20: Funds in FCS tend to invest in companies with the following characteristics.................................................................. 41
            Figure 21: Velocity of capital drives fund performance J-curve................................................................................................. 42
            Figure 22: Framework for deploying technical assistance.......................................................................................................46
            Figure 23: Findings on TA for SMEs in FCS countries.............................................................................................................. 47
            Figure 24: Number of investment professionals and investments for selected funds ..................................................................49
            Figure 25: Funds and LPs should adapt funds structure to the location and company needs.......................................................50
            Figure 26: FCS (21) and other IDA and SSA countries..............................................................................................................58
            Figure 27: FCS and other IDA countries per CPIA and FSI indicators......................................................................................... 59
            Figure 28: FSI in 2017 for countries in SSA............................................................................................................................ 60

2       IFC SME VENTURES
Acronyms
ANDE Aspen Network of Development Entrepreneurs
AVCA African Private Equity and Venture Capital Association
AUM Assets Under Management
AWA Amethis West Africa
BRVM Bourse Régionale des Valeurs Mobilières
CAR Central African Republic
CPIA Country Policy and Institutional Assessment
DFI Development Finance Institution
DOI Digital Object Identifier
DRC Democratic Republic of the Congo
EAC East African Community
EBITDA Earnings Before Interest, Taxes, Depreciation and Amortization
EMPEA Emerging Markets Private Equity Association
ERP Enterprise Resource Planning
ESG Environmental, Social, and Governance
FCS Fragile and Conflict-affected Situations
FDI Foreign Direct Investment
FSI Fragile State Index
FFP Fund for Peace
GAAP Generally Accepted Accounting Principles
GDP Gross Domestic Product
GIIN Global Impact Investing Network
GIIRS Global Impact Investment Rating System
GNI Gross National Income
GP General Partner
I&P Investisseurs et Partenaires
IDA International Development Association
IDP Internally Displaced Person
IFC International Finance Corporation
IFRS International Financial Reporting Standards
IPO Initial Public Offering
IRIS Impact Reporting and Investment Standards
IRR Internal Rate of Return
LP Limited Partner
MDB Multilateral Development Bank
MFI Microfinance Institution
MNC Multinational Company
MWh Megawatt hour
NBFI Non-bank Financial Institution
ODA Official Development Assistance
OECD Organisation for Economic Co-operation and Development
OPIC Overseas Private Investment Corporation
PCV Permanent Capital Vehicle
PE Private Equity
SADC Southern African Development Community
SDG Sustainable Development Goal
SME Small and Medium-sized Enterprise
SSA Sub-Saharan Africa
TA Technical Assistance
TAF Technical Assistance Facility
UN United Nations
UNDP United Nations Development Programme
WAEMU West African Economic and Monetary Union
WBG World Bank Group
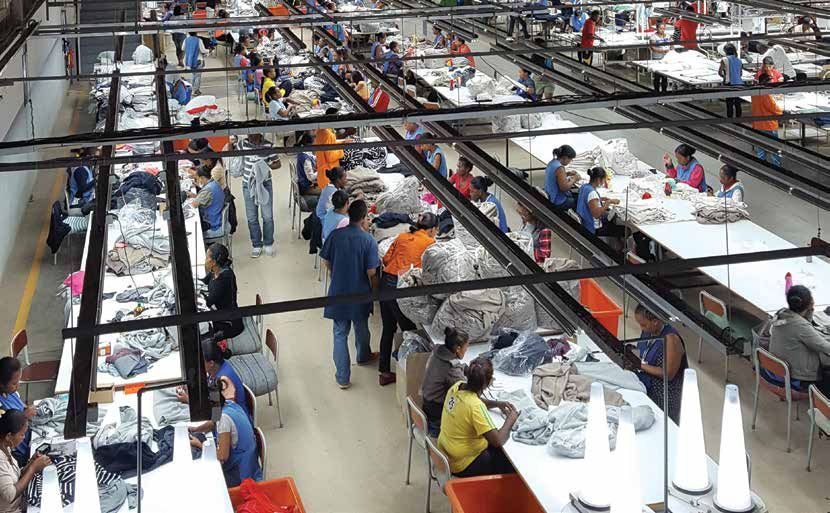
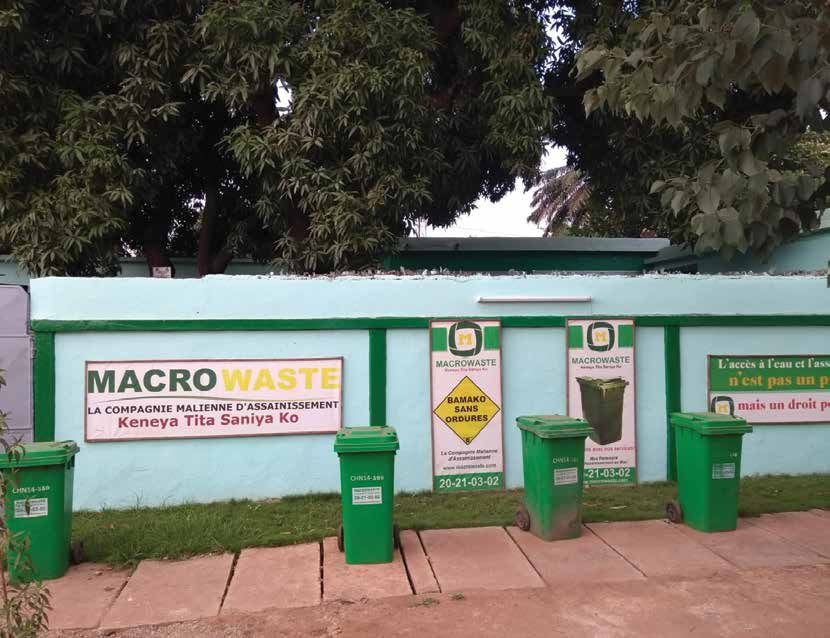
INVESTING IN PRIVATE EQUITY IN SUB-SAHARAN AFRICAN FRAGILE AND CONFLICT-AFFECTED SITUATIONS 3Macrowaste is providing private waste management services in Bamako. Non-tradable services
represent investment opportunities for investors in FCS. (Kelley Gasper, Mali, 2018)
4 IFC SME VENTURESExecutive summary 1
F
oreign direct investment (FDI) in fragile and conflict-affected situations (FCS)1 represents just 1% of global
FDI flows, more than five times less per capita than the world average.2 However, to grow businesses
beyond the micro level, most entrepreneurs need financing. In fragile states, risk capital investments can
have a significant catalytic impact, even with relatively low commercial returns.3 Funds in frontier markets
often help spur the emergence of new sector leaders and domestic challengers and/or partners to multinational
firms. New jobs are created, providing training and formal sector social protections such as health insurance.
The impact through potential spillover effects of FDI is also enhanced by local sourcing.4 The International
Finance Corporation’s (IFC’s) Small and Medium-sized Enterprise (SME) Ventures program is one
of very few initiatives supporting entrepreneurs and high growth companies through investing in
private equity funds that deploy risk capital in fragile states.
This report, researched in partnership with CrossBoundary LLC, highlights the critical success factors when
investing in fragile states, as well as existing innovations being developed by current investors.5 While the
challenges of investing in FCS are well known, the most effective approaches and factors required for success
are still being explored. New financial instruments, fund structures, and types of technical assistance are
constantly being designed and tested. The lack of shared information, including results and best practices for
developing and delivering mechanisms to invest in FCS can lead to missed opportunities for limited partners
(LPs) and general partners (GPs).
Companies operating in fragile states face challenges that are often more severe and sometimes unique
compared to those in emerging markets or developed markets. In this operating and investment context,
average risk-adjusted returns are lower. Reasonable net returns (5%-10%) are more difficult to achieve
in fragile states and require a tailored approach. Investors need to adopt context-specific methodologies,
adjusting to market/population size and growth, currency risk, and political uncertainty, among other factors.
However, several observed patterns and best practices have led to more successful funds. First, funds with
better net financial returns have the tendency to either be highly active and in control positions on a small set
of investments, or deploy standardized (but flexible) debt-like instruments to a larger group of investments.
Additionally, certain types of sectors appear to be more favorable to investments: (i) companies with
revenues in hard currency, (ii) companies with insulation from international competition (basic goods and
1
For the purpose of this report, the IFC definition of FCS is used. FCS are countries or territories with (i) a harmonized
country policy and institutional assessment (CPIA) rating of 3.2 or less, and/or (ii) the presence of a UN and/or regional
peacekeeping or political/peacebuilding mission during the last three years. Throughout the report, the countries
considered are referred to as either fragile or FCS, and can also be categorized as frontier markets – although the latter is
not always associated with a post-conflict or fragile situation.
2
Alexandros Ragoussis and Heba Shams, “FDI in Fragile and Conflict-Affected Situations”, Global Investment
Competitiveness, Chapter 5 of Global Investment Competitiveness Report 2017/2018, Digital Object Identifier (DOI):
10.1596/978-1- 4648-1175-3., 2017.
3
Dr. Josh Lerner, Ann Leamon, Andrew Speen, and Chris Allen, “Risk Capital in Emerging Markets and the SME-Ventures
Model”, Bella Research Group for IFC, 2015.
4
Thomas Farole and Deborah Winkler, “Making Foreign Direct Investment Work for Sub-Saharan Africa – Local Spillovers
and Competitiveness in Global Value Chains”, International Bank for Reconstruction and Development / The World Bank,
International Trade Unit, 2014, p87-114.
5
CrossBoundary LLC is a frontier market investment advisory firm with offices in Nairobi, Johannesburg, Bamako, Lagos,
Dubai, New York City, and Washington, D.C. The research for this report was primarily conducted from October 2017 to
March 2018, and included extensive interviews in Côte d’Ivoire, the Democratic Republic of the Congo (DRC), Liberia, Mali,
Mozambique, Sierra Leone, and Madagascar. The primary authors of this summary report are Jake Cusack and Soline
Miniere, with support from Bryan Epps, Nathan Kelly, and Marcos Sampablo.
INVESTING IN PRIVATE EQUITY IN SUB-SAHARAN AFRICAN FRAGILE AND CONFLICT-AFFECTED SITUATIONS 5essential services), (iii) companies with restricted domestic competition (a monopoly/oligopoly/first mover),
and (iv) opportunistic comparative advantage companies (country specific). However, while financial returns
are important, the potential social or environmental impact should be considered with similar weight, as
measured through metrics such as whether alternative sources of financing were available, jobs were created
after investment, employee benefits and training flowed from the investment, taxes/government revenue was
generated, or improvements were effected in the overall value chain or ecosystem. The optimal investment
from a net return perspective may differ from the optimal development impact investment, as transaction/
monitoring costs are often higher with earlier-stage, entrepreneur-led businesses in more fragile economies.
Even with a customized approach, GPs and companies in FCS still face challenges in originating and
closing transactions, running businesses, and exiting investments. Specific mitigation strategies at
each step of the investment process can improve the risk/return profile. For instance, during the origination
process, investment opportunities will be earlier stage than typical private equity, facing higher risk of failure
than those available in more mature enterprises.6 Several GPs end up partially incubating greenfield projects in-
house to improve control and results. During the structuring of the investment, GPs need to adapt and innovate
in terms of investment instruments and can also often leverage donor/concessional capital. Lastly, GPs and LPs
have highlighted the lack of flexibility in the timing of exits in countries with limited or no secondary market. Exit
opportunities are primarily limited to management buy-outs or trade sales, while initial public offerings (IPOs)
are very rare.7 Beyond the self-liquidating type of instruments that many funds employ, several funds also seek
to mitigate this challenge by identifying the exit opportunity pathway before investing, or by adopting a holding
company structure with no fixed time requirements for exit. At all steps of the investment process, GPs face
challenges specific to fragile states that require tailored mitigation strategies.
More broadly, the standard features of a typical private equity structure (generally incorporating a
2/20 compensation structure over a 10-year life cycle) can also create difficulties in implementation
for some GPs in FCS. For instance, in a large fund a 2% management fee may adequately cover the costs of
the needed investment professionals. But in other contexts, the GP’s choice of strategy, ticket size, and fund
size may create very different requirements for management time and the number of investment professionals
required. Management fees for FCS funds should not only be based on a simple percentage benchmark but
should also consider the strategy and desired impact of the fund. Additionally, other incentives are often not
aligned. Fund personnel in FCS may never see carry (performance compensation) due to low net commercial
returns (although they may potentially still deliver high development impact) and a too high hurdle rate. If carry
is low or unlikely, salary and bonus are the only incentives on which GPs can recruit skilled professionals. Lower
hurdle rates (e.g. 5%) or hybrid incentive schemes should therefore be considered in FCS.
In this challenging context, additional support to risk capital providers is highly valued and sometimes
critical to success. Technical assistance (TA) should be used to pay for expertise that directly increases revenue/
earnings before interest, taxes, depreciation and amortization (EBITDA) or reduces costs and other challenges
such as environmental, social, and governance (ESG) issues of the investment. GPs in FCS have mentioned the
effectiveness of hiring specialized industry experts, providing assistance with marketing and setting/achieving
key performance indicators, as well as supporting the development of accounting, management, and other
enterprise resource planning (ERP) systems. Separately, TA can also be used for direct support of the set-up
of the GP in first-time funds and for crosscutting macro support (for example, for private equity regulatory
environment reform).
IFC SME Ventures has played a crucial role in developing the investment landscape in fragile states in Sub-Saharan
Africa (SSA). IFC SME Ventures was catalytic in developing first-time funds and supporting them in building an
initial track record. In this report, to build on that success, three complementary angles are suggested to
spur additional risk capital into FCS: first, methods for attracting additional LPs and innovating on fund
structure; second, providing a suite of shared services and toolboxes to support FCS GPs; and finally, country- or
region-centric platforms to facilitate investment from a broad range of risk capital sources into a variety of FCS
companies.
6
“IPDEV, a pioneering initiative to promote African SMEs”, Investisseurs et Partenaires (I&P), May 2018.
7
“Due Diligence in Emerging Markets”, IFC, World Bank Group (WBG) and Overseas Private Investment Corporation (OPIC),
Vancouver Conference – Institutional Limited Partners Association, October 2011.
6 IFC SME VENTURESInvestors should adopt a
context-specific approach 2
T
he strategy to approaching fragile states must be tailored to the local context, with the country-level
environment presenting different challenges and opportunities depending on a number of factors.
First, while this report refers to the IFC framework for FCS, there is no single internationally recognized
definition of fragility (see Appendix A), with FCS often characterized by different political, social, and security
metrics. FCS factors, including political conflict, criminality, institutional fragility, and lack of government
legitimacy will all influence how investors prioritize countries based on their tolerance for uncertainty and
perceived return potential. For example, in the Fragile State Index of 2017, Côte d’Ivoire is considered as more
fragile in terms of violence than Mali and identical in terms of institutional fragility. Yet Côte d’Ivoire has still
been able to attract significant investment, thanks to a legacy of past economic opportunity, a supportive
ecosystem, and strong economic fundamentals. Some businesses even gain revenue in fragile situations – for
example, hotels, airport logistics, and vehicle rental companies in Liberia and Sierra Leone did better during
the Ebola outbreak, as they provided housing and transportation for the influx of aid agencies. However,
ensuring that growth driven by such a temporary market dynamic is sustainable can present a subsequent
challenge.
Poor hard infrastructure (such as transport and energy) and soft infrastructure (such as education and legal
systems), informality, and limited export capacity (including satisfying quality assurance) affect operating
costs in emerging markets generally but are more severe in FCS:
• The cost and reliability of electricity are often considered to be the most significant challenges for
businesses operating in fragile states.8 Whether light manufacturing, hotels, or healthcare clinics –
power outages and the subsequent use of generators lead to a high cost of production and operation for
local companies.
• In order to export consumable and/or perishable goods such as mangoes or shea butter internationally, the
supply chain must operate to an international standard of quality control. Fragile states have difficulties
reaching the required levels, with both public investment and technical assistance being critical.
The most specific risks for fragile states are (a) security challenges arising from political conflict and/or (b)
institutional fragility or lack of government capabilities.9 Figure 1 illustrates how countries in SSA compare on
a select set of dimensions, especially in FCS.
8
Alexandros Ragoussis and Heba Shams, “FDI in Fragile and Conflict-Affected Situations”, Global Investment
Competitiveness, Chapter 5 of Global Investment Competitiveness Report 2017/2018, DOI: 10.1596/978-1-4648-1175-3.,2017.
9
Ibid
INVESTING IN PRIVATE EQUITY IN SUB-SAHARAN AFRICAN FRAGILE AND CONFLICT-AFFECTED SITUATIONS 7FIGURE 1: DIMENSIONS OF STATE FRAGILITY IN SSA10
10.00
CAR South Sudan
Mozambique
Guinea
Madagascar DRC
Swaziland Guinea-Bissau
9.00
Liberia Chad Somalia
Eritrea Zimbabwe
Sudan
Mauritania Nigeria
8.00
Ethiopia
INSTITUTIONAL FRAGILITY
Mali Kenya
7.00
Côte d'Ivoire
South Africa Rwanda
Senegal
6.00 Ghana
Namibia
Botswana Cabo Verde
5.00
4.00 Seychelles
Mauritius
3.00
3.00 4.00 5.00 6.00 7.00 8.00 9.00 10.00
SECURITY/VIOLENCE
FCS Other IDA Other SSA
Macroeconomic data and financing needs help to
understand the country context
Comparing gross domestic product (GDP), population size, purchasing power, and growth can give an
investor an indication of the potential size of a market. While fragile countries vary in population and market
size, most of them experience market access challenges due to disruptions in trade routes and enabling
infrastructure. But even in countries with low accessible local demand, there can still be opportunity for
investors with a regional or export-led investment strategy.
In the context of variable GDP and GDP growth for most fragile countries, several sectors will be more
resilient to shocks. As per the 2017/2018 Global Investment Competitiveness report, labor-intensive activities
such as agriculture dominate highly fragile economies. “The bulk of employment in FCS is in the small farmer
and household enterprise sectors, driven by necessity and resilience rather than growth.” In FCS in SSA, the same
trend is apparent. The share of agriculture in GDP is higher, on average, in FCS countries (33%) than in overall
International Development Association (IDA) (27%) or SSA countries (24%). Agriculture, as a necessary basic
good and labor-intensive activity, is relatively resilient (albeit fragmented) and typically contributes a higher
share of GDP in fragile states compared to services and industry.11
10
Derived from the Fund for Peace (FFP) Failed State index (FSI): http://fundforpeace.org/fsi/. Security and violence
values were computed using the average of security apparatus (C1), factionalized elites (C2), and group grievance (C3).
Institutional fragility values were computed using the average of state legitimacy (P1), public services (P2), and economic
decline (E1).
11
Alexandros Ragoussis and Heba Shams, “FDI in Fragile and Conflict-Affected Situations”, Global Investment
Competitiveness, Chapter 5 of Global Investment Competitiveness Report 2017/2018, DOI: 10.1596/978-1- 4648-1175-3., 2017.
8 IFC SME VENTURESFIGURE 2: SHARE OF AGRICULTURE IN GDP OF SSA, 2016 (ANNUAL % GDP)12
60 Sierra Leone
50 Chad
Guinea-Bissau
SHARE OF AGRICULTURE IN GDP (PERCENT)
Mali CAR
Togo
40 Burundi Sudan
Ethiopia
Kenya
Liberia
TanzaniaRwanda
30
Burkina Faso
Malawi
Madagascar Mauritania
Benin Uganda
Côte d’Ivoire
Mozambique Nigeria DRC
20 Ghana Guinea
Senegal The Gambia
Cameroon
São Tomé and Príncipe
10 Cabo Verde Swaziland Zimbabwe
Congo
Namibia
TRENDLINE Gabon Lesotho Zambia
Mauritius
Botswana South Africa Equatorial Guinea
0
40 50 60 70 80 90 100 110
FRAGILE STATE INDEX (FFP, 2016)
FCS Other IDA Other SSA
Services and industrial activities, on the other hand, are less prevalent in FCS countries. The share of industrial
activity in GDP is defined as value-added mining, manufacturing, construction, electricity, water, and gas. As
such, countries with strong mining sectors such as the Democratic Republic of the Congo (DRC) will have
a higher concentration of these activities. General services include value-added wholesale and retail trade
(including hotels and restaurants), transport, and other services such as education, health care, and real
estate services.
12
FSI Indicator: http://fundforpeace.org/fsi/; World Bank data: https://data.worldbank.org/indicator/NV.AGR.TOTL.CD.
INVESTING IN PRIVATE EQUITY IN SUB-SAHARAN AFRICAN FRAGILE AND CONFLICT-AFFECTED SITUATIONS 9FIGURE 3: SHARE OF SERVICES AND INDUSTRY IN GDP IN SSA, 2016 (ANNUAL % GDP)13
Mauritius
75
São Tomé and Príncipe
70 Cabo Verde
TRENDLINE South Africa The Gambia
Zimbabwe
65
SHARE OF SERVICES IN GDP (PERCENT)
Botswana
Namibia
60 Nigeria
Senegal
Lesotho Sudan
Zambia Cameroon
Malawi
55 Madagascar Mozambique
Ghana Swaziland Liberia
Benin Uganda
50 Rwanda
Equatorial Guinea Guinea
Gabon Côte d’Ivoire
45 Kenya
Burkina Faso DRC
Burundi
Togo Mauritania
Tanzania Congo Ethiopia CAR
40
Mali
Guinea-Bissau
35 Chad
Sierra Leone
30
40 50 60 70 80 90 100 110
FRAGILE STATE INDEX (FFP, 2016)
FCS Other IDA Other SSA
Equatorial Guinea
50 Congo
Gabon
45
SHARE OF INDUSTRY IN GDP (PERCENT)
40
Swaziland
TRENDLINE Lesotho Zambia
35 Botswana
DRC
Namibia Côte d’Ivoire Guinea
30 Mauritania
South Africa
Ghana
Tanzania Cameroon
Burkina Faso
25
Benin Senegal
Mozambique Zimbabwe
Uganda
Mauritius Madagascar Ethiopia
20
Cabo Verde Mali Kenya
Nigeria
Togo Rwanda
Burundi CAR
São Tomé and Príncipe Malawi
15 Chad
The Gambia
Liberia Guinea-Bissau
10
40 50 60 70 80 90 100 110
FRAGILE STATE INDEX (FFP,2016)
FCS Other IDA Other SSA
13
FSI Indicator: http://fundforpeace.org/fsi/; World Bank data: https://data.worldbank.org/indicator/NV.IND.TOTL.ZS,
https://data.worldbank.org/indicator/NV.SRV.TETC.ZS.
10 IFC SME VENTURESRisk capital has a strong development impact and is
desperately needed in fragile states
There is a substantial body of research showing that capital investments in SMEs drive job creation. As
noted in the 2015 Bella Research Group report commissioned by the IFC,14 “SMEs are the primary engines of
job creation in low income countries, and employ about 78% of permanent, full-time employees in the formal sector
of these countries.15 In addition, SMEs can provide alternative employment opportunities for skilled but unemployed
workers.”16 A study of 200 private equity funds conducted by the African Private Equity and Venture Capital
Association (AVCA) in Africa between 2009 and 2015, found that private equity backed companies generated
a net increase of 10,990 jobs.17 Firms without access to finance are not able to grow as fast, as they are capped
by the company’s ability to generate cash. A 2013 IFC study found that firms having even just a loan or
overdraft facility had a 3.1% higher rate of growth in permanent employees than firms without access to
finance.18 Beyond simply creating new jobs, additional benefits include training and formal sector social
protections such as health insurance. Impact through the potential spillover effects of FDI has been measured
in recent World Bank research and is enhanced by local sourcing.19
According to multiple researchers, financing also reduces inequality: “Financial development, measured by
growth in private credit, disproportionately boosts incomes of the poorest quintile of the population and reduces
income inequality.”20 This has been reinforced by studies at the individual level, such as Christopher Blattman’s
work in Uganda, which found that: “After four years, the treatment group [individuals with access to capital] had
57% greater capital stocks, 38% higher earnings, and 17% more hours of work than did the control group. Treatment
group members also became more 'firm-like' in that they were 40%–50% more likely to keep records, register their
business, and pay taxes.”21
Supporting the entry of new risk capital providers can create the well-functioning financial intermediaries
that are frequently absent from these markets. Such intermediaries are an effective tool to improve corporate
governance, boosting productivity and growth.22 Additionally, increased risk capital provision spurs the
development of the business ecosystem (lawyers, accountants, and consultants) and an appropriate
regulatory environment. Development finance institutions (DFIs) should seek to back locally based GPs
in FCS, as they can be particularly beneficial in this regard. As Ross Levine has noted, “Legal and accounting
reforms that strengthen creditor rights, contract enforcement, and accounting practices can boost development and
accelerate economic growth.”23
More specifically, GPs in frontier markets often lead to the emergence of new sector leaders and domestic
challengers and/or partners to multinational firms. Yet the risk capital gap is most significant in fragile
14
Dr. Josh Lerner, Ann Leamon, Andrew Speen, and Chris Allen, “Risk Capital in Emerging Markets and the SME-Ventures
Model”, Bella Research Group for IFC, 2015.
15
Mighana Ayyagari, Asli Demirguc-Kunt, and Vojislav Maksimovic, “Small Vs. Young Firms Across the World: Contribution to
Employment, Job Creation, and Growth”, World Bank Policy Research Working Paper no. 5631 (2011), p. 37 (table 1). The 78%
figure is for the median low-income countries. The paper uses the World Bank’s Enterprise Surveys between 2006 and 2010,
and supplements them with data from 44 other countries drawn from other comparable sources that were taken mostly
from 2008 but ranges from 1997 to 2009.
16
“Transition Report”, European Bank for Reconstruction and Development, London, 1995, cited in Aidis, 2005.
17
Aubrey Hruby, “The developmental difference of African private equity”, Financial Times, 25 January 2017,
https://on.ft.com/2FXgeml.
18
“IFC Jobs Study: Assessing Private Sector Contributions to Job Creation and Poverty Reduction”, IFC, January 2013.
19
Thomas Farole and Deborah Winkler, “Making Foreign Direct Investment Work for Sub-Saharan Africa – Local Spillovers
and Competitiveness in Global Value Chains”, International Bank for Reconstruction and Development/The World Bank,
International Trade Unit, 2014, p87-114.
20
Independent Evaluation Group, “The World Bank Group’s support to capital market development”, 2016,
https://bit.ly/2rzKm3d.
21
Christopher Blattman, Nathan Fiala, and Sebastian Martinez, “Generating skilled self-employment in developing countries:
experimental evidence from Uganda”, The Quarterly Journal of Economics (2014), p697-752. DOI: 10.1093/qje/qjt057, 2014,
https://chrisblattman.com/documents/research/2014.GeneratingSkilledEmployment.QJE.pdf.
22
Valerie Bencivenga and Bruce Smith, “Some consequences of credit rationing in an endogenous growth model”, Journal of
Economic Dynamics and Control, 1993, vol. 17, issue 1-2, p97-122.
23
Ross Levine, Norman Loayza, and Thorsten Beck, “Financial Intermediation and Growth: Causality and Causes”, World Bank
Policy Research Working Paper No. 2059, February 1999.
INVESTING IN PRIVATE EQUITY IN SUB-SAHARAN AFRICAN FRAGILE AND CONFLICT-AFFECTED SITUATIONS 11states. For instance, a survey of finance providers in one country found that the IFC SME Ventures fund
(managed by XSML) was one of the sole providers of flexible risk capital (including loans with tailored and
flexible repayment schedules, royalty-based lending, convertible loans, and equity), while others that existed
primarily deployed more standard debt instruments. In Liberia, before the IFC SME Ventures fund, very
few small/mid-size risk capital investments had recently occurred (today, several private equity funds are
exploring entry).24 In judging the development impact of such funds, not just the explicit outcomes achieved
should be considered, but also the ‘missed opportunities’ if nothing had been attempted. Many investees of
FCS funds state that they had no other viable options for financing.
Finally, inflows of capital from DFIs and foreign investors typically encourage fund managers and their
companies to follow ESG best practices. Although the long-term role of DFIs and multilateral development
banks (MDBs) is to push for more private LPs in these funds over time, these anchor organizations put in place
high expectations and “continue to influence the setting of high environmental, social, and governance standards”.25
FCS gross return expectations must be appropriate
In Africa, the gross internal rate of return (IRR) on fully realized investments has demonstrated good returns
compared to other emerging markets. However, as of yet the gross returns on partially realized and unrealized
investments are lower than in emerging Asia and Europe (see figure 4; note that this chart’s data are for all
markets, not just FCS).
FIGURE 4: AFRICA VERSUS OTHER EMERGING MARKETS’ INVESTMENT-LEVEL RETURNS AS OF
JUNE 30, 2017 (VINTAGE YEARS 1995-2015)26
55
21.5
20
17.1
16.4
15.4
15
GROSS IRR (%)
10
8.1
7.5
5
2.8
0
Africa Emerging Asia Emerging Europe Latin America
-5
Fully Realized Partially Realized & Unrealized
24
As of January 2018, several funds, including Pan African Capital and Gemini Capital, were being raised in Liberia with the
purpose of investing in the country or in the larger Mano River Union area.
25
“The World Bank Group's Support to Capital Market Development”, WBG, 2016.
26
“Cambridge Associates LLC Private Investments Database; AVCA Focus Series 2018 Private Benchmarks for Africa”. The
database includes 24 participating fund managers, 51 institutional quality Africa-focused private equity and venture capital
funds, and over 450 unique portfolio investments in nearly 400 companies. Vintage year coverage: 1995 to 2015; total
fund capitalization: US$12.6 billion of commitments; average fund size: US$248 million, ranging from US$800 million. Geographic strategies of funds: South African (13 funds), pan-African (34 funds), other regional (four
funds). Individual investments headquartered in 33 different African countries.
12 IFC SME VENTURESInvesting in FCS presents significant challenges, and gross returns are, in
“No trade-offs on a deal by deal
general, lower than in other markets. GPs can, and should, still seek 15%-
basis… we have to target gross IRRs
20% returns on individual investments, as their portfolio companies should around 20% in hard currency.”
be experiencing sustainable growth even within the complexities of a fragile Chief Investment Officer of SME Fund
state. In general, if targeting lower gross returns, the fund is not sustainable
and/or investments are not in sufficiently high growth and job-creating
companies, and thus the GP is likely not adding particular value to the investment ecosystem. However,
LPs must be realistic in grading their GPs given the challenges of a tougher environment. Additionally,
when appropriate to the sector of the investment, performance should be judged in local currency terms
before hard currency.
FIGURE 5: STYLIZED FRAMEWORK OF GROSS RETURNS FOR INDIVIDUAL INVESTMENTS IN FCS27
Factors IMPROVING RETURNS in FCS:
ts • Low competition (first-mover
ts arke advantage and perception arbitrage)
ke dm
ar o pe
m vel • Potential access to concessional
ging De financing (lower cost of capital)
er
Em
GROSS RETURNS
• Low cost of land (though can be
difficult to secure)
ts • Low cost of labor
ke
ar
il em • Access to technical assistance to
ag lower operational and governance
Fr risk
Factors HURTING RETURN in FCS:
RISK • Cost of inputs (other than labor)
typically higher
• Limited infrastructure
Investing in FCS has UNIQUE RISKS:
• Limited management talent/human
• Higher political risk and security risk (elections, violence) capital
• Severe lack of institutional capacity and/or malignant institutions • Expensive debt
• Small/fragmented markets
• Along with heightened macro risks present in other markets such as
currency • Smaller transactions with risk of
‘crowding-out’ the entrepreneur
A net return environment is particularly difficult
Net return is reduced by management fees due to high costs of operation and small fund sizes. For funds that
have fully distributed, net IRR to LPs in Africa has been relatively high compared to other emerging markets.
However, active funds currently in Africa have not yet achieved net IRRs as high as in other emerging markets.
27
CrossBoundary analysis based on a literature review and field interviews with GPs and LPs investing in eight SSA fragile
states.
INVESTING IN PRIVATE EQUITY IN SUB-SAHARAN AFRICAN FRAGILE AND CONFLICT-AFFECTED SITUATIONS 13FIGURE 6: AFRICA VERSUS OTHER EMERGING MARKETS’ FUND LEVEL STATUS: LIQUIDATED VERSUS
ACTIVE FUNDS AS OF JUNE 30, 201728
20
18.5
15
11.9
I RR NET TO LPs (%)
10.8
10 9.2
7.1
5 4.3
3.2
2.3
0
Africa Emerging Asia Emerging Europe Latin America
Liquidated Active
In SSA fragile states particularly, the gap between the net and gross IRR is higher than in other emerging
markets. In the specific context of FCS, a ~5%-10% return net of management costs should be considered good
performance, expecting improvement from a first-time fund to subsequent funds raised. As funds mature
and raise additional capital in a given market, the increased knowledge of the market and stakeholders
should decrease the transaction costs (cost of origination, investment, and
management), as well as bring economies of scale. As a consequence, this
“Several single-country funds have
gap should shrink over time, but the gross-net gap may stay higher than in
failed because of a major crisis in
other emerging markets because of the additional idiosyncratic risks.
the region (Ebola, oil embargo,
commodity crisis, earthquake…)"
FCS development professional
28
“Cambridge Associates LLC Private Investments Database; AVCA Focus Series 2018 Private Benchmarks For Africa”. All
returns are net of fees, expenses, and carried interest. Number of liquidated funds: Africa (8), Emerging Asia (77), Emerging
Europe (23), and Latin America (17). Number of active funds: Africa (43), Emerging Asia (303), Emerging Europe (39), and
Latin America (49).
14 IFC SME VENTURESFIGURE 7: FROM GROSS RETURNS TO NET FUND PERFORMANCE
Developed markets TRANSACTION COSTS will be
higher in FCS than in developed
markets:
Fragile markets
• Higher search/origination
costs: informal, low quality,
RETURNS
smaller and immature
companies
• Higher due diligence costs
• Need for more active portfolio
management
• Higher costs to recover failing
/ liquidated investments
Individual gross returns Aggregate gross returns Net returns after
management costs
IDIOSYNCRATIC RISKS can affect the overall gross fund return as funds may have to unexpectedly write off
some of their investments due to:
• Natural disasters, health crises, or other events that are exacerbated by poor state capacity (Ebola)
• Terrorist attacks, civil wars, violent protests, expropriation by government or criminal actors
Impact metrics and incentive structure are
important to demonstrate investment
value beyond financial returns
While return on investment is an important metric to weight the success of a fund, LPs often invest in
frontier market SME funds to have a lasting impact on the economy. Private equity is an important asset
class to achieve economic growth and drive towards fulfilling the Sustainable Development Goals (SDGs).
A recent Emerging Markets Private Equity Association (EMPEA) report highlighted that, “The private sector
has a critical role to play in achieving the SDGs, and private equity investors are in a unique position to invest in and
influence businesses in a manner that creates positive change.”29 In a context of challenging net returns, the outsize
development impact of fragile state funds is important to measure and showcase — in both quantifiable and
qualitative ways.
Frameworks and indicators to measure impact are
becoming more standardized but are still diverse
Underlying financial performance is of course relevant to demonstrating that the investment is sustainable
and profitable. However, monitoring and evaluating funds’ social and environmental impact is critical to
ensure fund managers put in place a pro-active approach to achieving development results.
While SDG indicators are often linked to national-level statistics and therefore not suited to fund managers,
aligning with well-known and understood impact frameworks helps funds communicate more easily.
Currently, two tools are often used to measure the impact of an investment: IRIS and GIIRS. IRIS (Impact
Reporting and Investment Standards), housed at the GIIN (Global Impact Investing Network) is a “catalog
of generally accepted performance metrics that leading impact investors use to measure social, environmental, and
29
“Private Equity’s Role In Delivering the SDGs: Current Approaches and Good Practice”, EMPEA, 2018.
INVESTING IN PRIVATE EQUITY IN SUB-SAHARAN AFRICAN FRAGILE AND CONFLICT-AFFECTED SITUATIONS 15You can also read