Image Segmentation Methods for Flood Monitoring System - MDPI
←
→
Page content transcription
If your browser does not render page correctly, please read the page content below
water
Article
Image Segmentation Methods for Flood
Monitoring System
Nur Atirah Muhadi 1, *, Ahmad Fikri Abdullah 1,2 , Siti Khairunniza Bejo 1 ,
Muhammad Razif Mahadi 1 and Ana Mijic 3
 1   Department of Biological and Agricultural Engineering, Faculty of Engineering, Universiti Putra Malaysia,
     Serdang 43400, Malaysia; ahmadfikri@upm.edu.my (A.F.A.); skbejo@upm.edu.my (S.K.B.);
     razifman@upm.edu.my (M.R.M.)
 2   International Institute of Aquaculture and Aquatic Sciences, Si Rusa 71050, Malaysia
 3   Department of Civil and Environmental Engineering, Skempton Building, Imperial College London,
     South Kensington Campus, London SW7 2AZ, UK; ana.mijic@imperial.ac.uk
 *   Correspondence: gs53332@student.upm.edu.my; Tel.: +60-397694337

 Received: 16 April 2020; Accepted: 10 May 2020; Published: 26 June 2020

 Abstract: Flood disasters are considered annual disasters in Malaysia due to their consistent occurrence.
 They are among the most dangerous disasters in the country. Lack of data during flood events is the
 main constraint to improving flood monitoring systems. With the rapid development of information
 technology, flood monitoring systems using a computer vision approach have gained attention over
 the last decade. Computer vision requires an image segmentation technique to understand the content
 of the image and to facilitate analysis. Various segmentation algorithms have been developed to
 improve results. This paper presents a comparative study of image segmentation techniques used in
 extracting water information from digital images. The segmentation methods were evaluated visually
 and statistically. To evaluate the segmentation methods statistically, the dice similarity coefficient and
 the Jaccard index were calculated to measure the similarity between the segmentation results and the
 ground truth images. Based on the experimental results, the hybrid technique obtained the highest
 values among the three methods, yielding an average of 97.70% for the dice score and 95.51% for
 the Jaccard index. Therefore, we concluded that the hybrid technique is a promising segmentation
 method compared to the others in extracting water features from digital images.

 Keywords: computer vision; dice similarity coefficient; floods; hybrid technique; image segmentation;
 Jaccard index

1. Introduction
      Rapid urbanization, population growth, and extreme climate change have led to frequent flooding
events, posing challenges for many countries around the world. The impacts of floods include loss of
life, damage to property, and deterioration of health conditions. Several researchers studied the effects
of flooding on agricultural land [1–3], finding that such events may reduce agricultural production and
eventually influence the economic performance of a country [4]. For instance, changes in temperature
and rainfall during flood events may influence soybean growth and yield [5]. They can also destroy
agricultural infrastructure and increase the risk of diseases. In the aquaculture field, extreme floods
can damage farming infrastructure, such as sluices and shutters, as well as introduce diseases and
harmful algal blooms [6].
      Due to the impacts of flooding, researchers have intensified their efforts to improve and enhance
flood monitoring systems. Flood monitoring is the process of monitoring the conditions that lead
to flood events, such as the level of a river, so that authorities can take appropriate actions in

Water 2020, 12, 1825; doi:10.3390/w12061825                                        www.mdpi.com/journal/water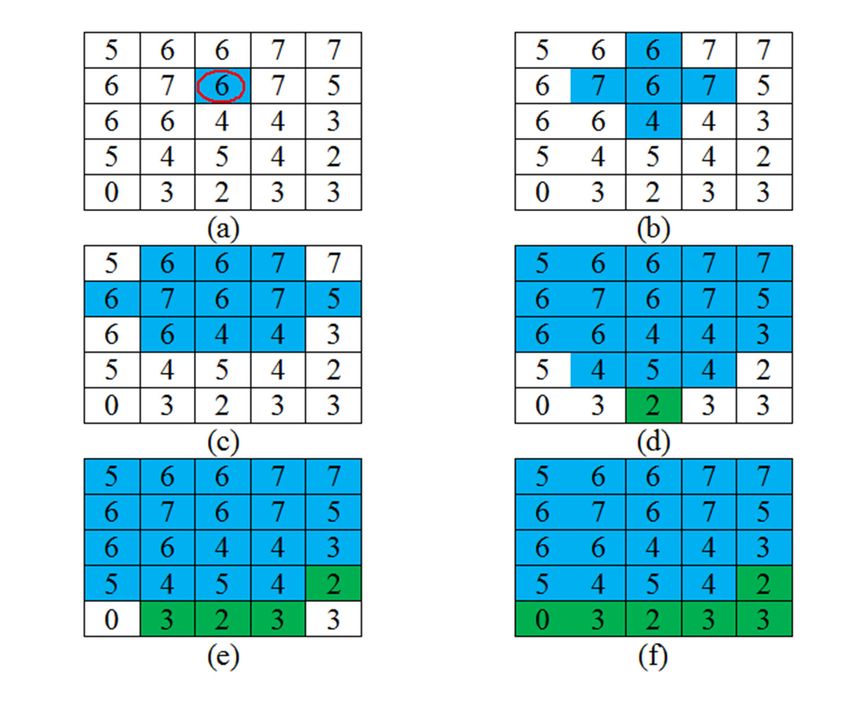
Water 2020, 12, 1825                                                                                 2 of 10

advance. Quickly predicting flood disasters is important to prevent severe damage to property and
life. The lack of data availability during flood events is the main constraint on developing a reliable
flood monitoring system.
      Several flood event monitoring methods are available, such as gauge sensors and remote sensing
technology [7–13]. However, gauge sensors can only provide one spatial dimension (water level),
whereas remote sensing technology experiences issues with satellite revisit time. The retrieval of
information may be delayed for hours depending on the method of data transmission [14]. Currently,
flood warning analysis relies on water level sensors and precipitation forecasts; therefore, it is not
capable of providing near-real-time and automated flood monitoring analysis [15]. As such, visual
sensing systems have been introduced that have the capability to collect a vast quantity of information
from a given area. Important information for many applications can be obtained from still images and
video streams. The interest in visual monitoring and surveillance systems, especially in natural disaster
applications, has increased with advancing surveillance technology. It is now possible to recognize
events in real time with the progress in information technology [16]. For instance, Mettes et al. [17]
worked on the motion of water properties using videos. Image-based approaches, combined with
the appropriate image analysis techniques, may offer efficient and cost-effective methods that may be
useful for managing flood events [18]. An early warning system for flood prevention and monitoring
is one of the applications of visual sensing technology.
      Image processing is the use of computer algorithms to extract useful information from digital
images, which is a vital procedure in visual sensing systems. To understand the content of an image,
image segmentation is commonly used to partition it into several regions, which are often based
on the attributes of its pixels. In particular, image segmentation has been applied in the fields of
medical imaging, automated driving, and water management. In flood disaster applications, it may
involve the separation of the foreground (in this case, the water features) from the background.
Several image segmentation techniques are currently used by researchers and industry, such as
thresholding, boundary-based, region-based, and hybrid techniques [19,20]. Some papers specifically
discussed image segmentation methods handcrafted for flood disaster applications.
      Generally, the choice of features is crucial in image segmentation algorithms. Nath and Deb [21]
stated that one of the most promising features of digital images is color information. The other
commonly used feature is texture or pattern information. Many researchers used these main features
to identify flood events. For the detection of a flooding event, Lai and Chen [22] employed threshold
values to determine the potential foreground regions. Borges et al. [23] introduced a probabilistic
model for flood detection in videos. They combined the statistical characteristics of floods, such as
color, texture, and saturation characteristics, using the Bayes classifier along with frame-to-frame
changes to determine the flood presence. They then proposed a probabilistic model of flood occurrence
to detect the position of flood regions, thereby significantly improving the classification performance.
      San Miguel and Ruiz Jr. [24] conducted a study similar to the work of Borges et al. [23] using the
thresholding method to segment the flood and non-flood regions depending on color, size, and patterns
of ripples. This approach offers good flood detection capabilities but is limited by the reflections on the
floodwater. Filonenko et al. [14] proposed the use of a color probability method from images obtained
from a video to detect floods in real time. Lo et al. [25] employed the region growing method for flood
region detection, finding it more suitable for situations in which the background and foreground shapes
change over time. Therefore, all shape and size variations across the flood regions can be detected.
The authors also proposed a region-based segmentation method of differentiating the foreground and
background. Jyh-Horng et al. [26] proposed mean-shift and region growing approaches to develop an
automated identification method for flood monitoring. The region growing algorithm is specifically
used to differentiate an object within a binary mask.
      Geetha et al. [27] used crowd-sourced images to detect the extent of flood areas using a color-based
segmentation threshold. Zhang et al. [28] evaluated the performance of three different image processing
techniques for flood monitoring systems. Their experimental results indicated that the canny edge
Water 2020, 12, 1825 3 of 10
Water 2020, 12, x FOR PEER REVIEW 3 of 10
detection method obtained a high level of accuracy in detecting the flooded area. Langhammer and
Langhammer and Vacková [29] used the seed region growing algorithm to perform object-based
Vacková [29] used the seed region growing algorithm to perform object-based image segmentation in
image segmentation in classifying the image into several categories.
classifying the image into several categories.
From the cited literature, various algorithms have been developed to improve segmentation
From the cited literature, various algorithms have been developed to improve segmentation
results. At present, there is no general solution to image segmentation problems that ensures reliable
results. At present, there is no general solution to image segmentation problems that ensures reliable
accuracy for flood disaster applications. Therefore, this paper presents a comparative study of image
accuracy for flood disaster applications. Therefore, this paper presents a comparative study of image
segmentation techniques—namely thresholding, region growing, and a hybrid technique—to extract
segmentation techniques—namely thresholding, region growing, and a hybrid technique—to extract
water information from digital images.
water information from digital images.
2. Methodology
2. Methodology
Based on
Based on previous
previous studies,
studies, thresholding,
thresholding, region
region growing,
growing, andand hybrid
hybrid techniques
techniques areare three
three
promising image
promising image processing
processing techniques
techniques with with potential
potential applications
applications in in flood monitoring systems.
flood monitoring systems.
Therefore, they were selected for use in this study. The study area is located in Batu 12,
Therefore, they were selected for use in this study. The study area is located in Batu 12, Sungai
Sungai Langat,
Langat,
Selangor, Malaysia.
Selangor, Malaysia. Images
Images captured
captured by by aa surveillance
surveillance camera
camera installed
installed near
near aa river
river were
were used
used as
as the
the
input. The
input. The outdoor
outdoor environment
environment was was used
used toto more
more realistically
realistically test
test the
the image
image segmentation
segmentation methods.
methods.
Two different images were used: one showing normal water
Two different images were used: one showing normal water level conditions andlevel conditions and the
the other
other showing
showing
overflowed water conditions. The ground truth data was manually
overflowed water conditions. The ground truth data was manually segmented and then used segmented and then used to
to
evaluate the
evaluate the accuracy
accuracy of of the
the tested
tested algorithms.
algorithms. TheThe images
images were segmented into
were segmented foreground (water)
into foreground (water)
and background using the thresholding, region growing, and hybrid techniques.
and background using the thresholding, region growing, and hybrid techniques. The experiments The experiments
were performed
were performed on on aa notebook
notebook that that was
was equipped
equipped withwith aa 2.60
2.60 GHz
GHz Intel
Intel® Core™ i7
® Core™ i7 CPU
CPU andand 16
16 GB
GB
RAM. This work was implemented using MATLAB 9.8.0 (R2020a). The
RAM. This work was implemented using MATLAB 9.8.0 (R2020a). The segmentation techniques aresegmentation techniques are
discussed in
discussed in detail
detail below.
below. An An illustration
illustration ofof the
the overall
overall procedure
procedureisisshown
shownin inFigure
Figure1.1.
Figure 1. The overall procedure of this study.
Figure 1. The overall procedure of this study.
2.1. Thresholding
2.1. Thresholding
Thresholding was used to segment the foreground from the background by selecting a threshold
Th. Any pixel
value,Thresholding waswith a value
used less than
to segment or equal to the
the foreground from threshold value was
the background selected as
by selecting a part of
a threshold
the foreground, whereas any value higher than the threshold value was included in the background.
value, Th. Any pixel with a value less than or equal to the threshold value was selected as a part of
The threshold value
the foreground, was any
whereas selected
valueby observing
higher thethreshold
than the histograms of the
value wasflooding
includedimages. The output
in the background.
image g(x,y) was obtained from the original image f (x,y) as:
The threshold value was selected by observing the histograms of the flooding images. The output
image g(x,y) was obtained from the original image
( f(x,y) as:
1, i f f (x, y) ≤ Th
g(x, y) = 1, i f f (x,, y) > Th (1)
, 0, (1)
0, ,
where Th a threshold is value and (x, y) is the coordinate of the threshold.
Where a threshold is value and , is the coordinate of the threshold.
2.2. Region Growing
2.2. Region Growing
Region growing, also known as region-based segmentation, groups pixels in the image into
Region growing, also known as region-based segmentation, groups pixels in the image into
regions with similar characteristics. First, an initial pixel is selected in the region of interest, which is
regions with similar characteristics. First, an initial pixel is selected in the region of interest, which is
also known as a seed point. The attributes of the seed point are compared with the neighboring pixels.
If the neighboring pixels have similar criteria to the seed point, the pixels are considered as belonging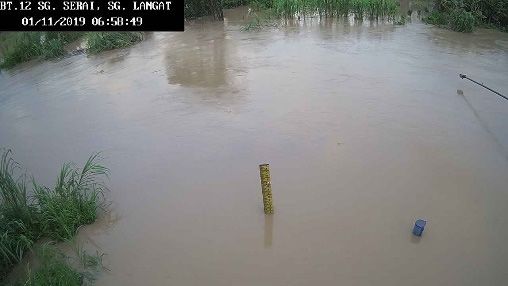
Water 2020, 12, 1825 4 of 10
Water
also2020,
known12, xas
FOR PEER point.
a seed REVIEWThe attributes of the seed point are compared with the neighboring4pixels.
of 10
If the neighboring pixels have similar criteria to the seed point, the pixels are considered as belonging
in the same region. The size of this region grows with the inclusion of the nearby pixels. Figure 2a–f
in the same region. The size of this region grows with the inclusion of the nearby pixels. Figure 2a–f
illustrate the process of region growing using a 4-connected neighborhood given a threshold value
illustrate the process of region growing using a 4-connected neighborhood given a threshold value
of three.
of three.
Figure 2. The region growing process using a 4-connected neighborhood. (a) The red circle indicates
the initial pixel in the region of interest. (b,c) The blue color represents the pixels that are considered to
Figure
belong2.in The
theregion growing
same region as process using
the initial a 4-connected
pixel. neighborhood.
(d–f) The green (a) The
color indicates redthat
pixels circle
areindicates
excluded
the initial pixel in the region of interest. (b,c) The blue color represents
from the region because the difference is larger than the threshold value. the pixels that are considered
to belong in the same region as the initial pixel. (d–f) The green color indicates pixels that are excluded
from the region
In this study, because the difference
this technique is larger
appointed than the
a seed threshold
point in the value.
flooding area from which the region
grew as pixels with similar features were grouped with it. The threshold value refers to the difference
In thisthe
between study, this value
intensity technique
of theappointed
pixel and atheseed point
mean in the
of the floodingregion,
segmented area from which
which wasthe region
used as the
grew as pixels
measure with similar
of similarity features
in this study. were
If thegrouped
differencewith it. Thethe
between threshold
new pixelvalue
andrefers to thewas
the region difference
smaller
between
than thethe intensity
threshold value
value, theofpixel
the pixel and the mean
was included in theof the segmented
region. In contrast,region, which waswas
if the difference used as
larger
the measure of similarity in this study. If the difference between the new pixel and
than the threshold value, the new pixel was not included in the region. The 4-connected neighborhood the region was
smaller
was usedthantothe
growthreshold value, thepixels
the neighboring pixel from
was included
the initialinseed
the region. In contrast,
point. The iterationifprocess
the difference
stopped
was larger than the threshold value, the
when all the pixels in the image were tested. new pixel was not included in the region. The 4-connected
neighborhood was used to grow the neighboring pixels from the initial seed point. The iteration
2.3. Hybrid
process Technique
stopped when all the pixels in the image were tested.
Different methods of image segmentation may perform better for different types of images.
2.3. Hybrid Technique
The hybrid technique, consisting of multiple methods of image segmentation, can thus improve
Different methods
segmentation of image
results [30]. We usedsegmentation
the hybrid may perform
technique better for
proposed by different
Lankton et types of images.
al. [31] to detectThe
the
hybrid technique, consisting of multiple methods of image segmentation, can thus
flooding area by combining geodesic active contours and region-based active contours. This method is improve
segmentation results [30].
capable of segmenting We used
images withthe hybrid
poor edgetechnique
definitionproposed by aLankton
or that lack et al. [31]
homogeneous to detect
intensity the
profile.
flooding areacontour
Active by combining
methodsgeodesic active
start with ancontours and and
initial curve region-based active
a definition contours.
of the energy This method
for that curve
isbased
capable
on of
itssegmenting
geometry and images
imagewith poorEnergy
data. edge definition
based on or that lackis aprovided
geometry homogeneous intensity
to maintain the
profile.
smoothness of the curve, whereas energy based on image data is aimed at attracting the contour to
Active
object contour The
boundaries. methods
curvestart with an to
is deformed initial curveand
increase anddecrease
a definition of the energy
the energy, thus movingfor that
thecurve
curve
based on its geometry and image data. Energy based on geometry is provided to maintain the
smoothness of the curve, whereas energy based on image data is aimed at attracting the contour to
object boundaries. The curve is deformed to increase and decrease the energy, thus moving the curve
toward the local maxima and minima. The hybrid technique begins with the initial curve, then moves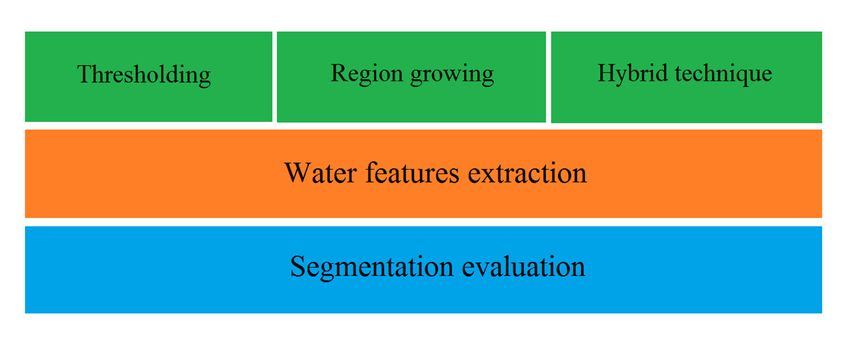
Water 2020, 12, 1825 5 of 10
Water
toward2020,
the12,local
x FORmaxima
PEER REVIEW
and minima. 5 of 10
The hybrid technique begins with the initial curve, then moves
each point on the curve based on the analysis of local interior and exterior regions. According to
each point
Lankton on[31],
et al. the curve
at eachbased
point on thetrue
of the analysis
edge of local
of an interior
object, and exterior
the nearby points regions. According
inside and outside theto
Lankton et al. [31], at each point of the true edge of an object, the nearby points inside and outside
object will be modeled by the mean intensities of the local regions. Figure 3 shows the initial curve in
the
the object
study will
area.be modeled by the mean intensities of the local regions. Figure 3 shows the initial curve
in the study area.
Figure 3. The
The initial curve in the study area.
2.4. Segmentation
2.4. Segmentation Evaluation
Evaluation
Image segmentation
Image segmentation algorithms
algorithms mustmust be be evaluated
evaluated to to assess
assess their
their efficiency
efficiency andand effectiveness.
effectiveness.
Generally, segmentation
Generally, segmentation evaluation
evaluation is is categorized
categorized into into two
two major
major classes:
classes: subjective
subjective andand objective
objective
methods. The most common method for evaluating the effectiveness of
methods. The most common method for evaluating the effectiveness of a segmentation method is a segmentation method is
subjective evaluation,
subjective evaluation, in
in which
which segmentation
segmentation resultsresults are
are judged
judged byby aa human
human evaluator
evaluator [32]. Objective
[32]. Objective
methods do not involve human assumptions and assessments. They are widely
methods do not involve human assumptions and assessments. They are widely used to quantitatively used to quantitatively
measure the
measure the performance
performance of of the
the segmented
segmented image. Quantitative evaluation
image. Quantitative evaluation methods
methods are are used
used to to
analyze the
analyze the similarity
similarity between
between the the results
results ofof segmentation
segmentation algorithms
algorithms andand ground
ground images
images generated
generated
by aa human
by human expert.
expert. The
The Jaccard
Jaccard index,
index, dice
dice similarity
similarity coefficient
coefficient (DSC),
(DSC), precision,
precision, and
and recall
recall are
are some
some
examples of metrics that are widely used and accepted by the scientific community to evaluate the
examples of metrics that are widely used and accepted by the scientific community to evaluate the
accuracy of
accuracy of segmentation
segmentation methods.
methods.
We used
We usedthetheDSC
DSC and Jaccard
and index
Jaccard to assess
index the performance
to assess of the three
the performance of thesegmentation methods.
three segmentation
DSC operates
methods. DSCon binary data
operates and is data
on binary frequently
and isused as a statistical
frequently used asvalidation metric
a statistical in segmentation
validation metric in
evaluation. Its evaluation.
segmentation value rangesIts from 0%,ranges
value which indicates
from 0%,there whichis no spatial overlap
indicates there isbetween
no spatialthe two sets
overlap
of binary segmentation results, to 100%, which indicates complete overlap. DSC
between the two sets of binary segmentation results, to 100%, which indicates complete overlap. DSC is a spatial overlap
index
is that can
a spatial be defined
overlap as: can be defined as:
index that
2|A ∩ B|
DSC = 2| ∩ | (2)
(|A| + |B|)
(2)
| | | |
where |A| and |B| are the cardinal of set A and set B, respectively.
Where |A| and
The Jaccard |B|also
index, areknown
the cardinal
as theof set A and set B, respectively.
intersection-over-union (IoU) metric, is another commonly
usedThe Jaccard
metric index, alsosemantic
for evaluating known as the intersection-over-union
segmentation (IoU)the
results. It expresses metric,
number is another
of objectscommonly
two sets
used
have metric for evaluating
in common semantic
as a percentage segmentation
of the results.they
number of objects It expresses
have in the number
total. In otherof words,
objects it
two sets
shows
have in common
the size as a percentage
of the intersection dividedofby thethe
number
size ofof theobjects
unionthey have
of the in total.
sample sets.InThe
other words,
metric it shows
ranges from
the size of the intersection divided by the size of the union of the sample sets. The metric ranges from
0% to 100%, with 0% indicating no overlap between the two segmented regions and 100% signifying
a perfectly overlapping segmentation. The mathematical representation of the Jaccard index is:
| ∩ |
(3)
| ∪ |Water 2020, 12, 1825 6 of 10
0% to 100%, with 0% indicating no overlap between the two segmented regions and 100% signifying a
perfectly overlapping segmentation. The mathematical representation of the Jaccard index is:
|A ∩ B|
Water 2020, 12, x FOR PEER REVIEW Jaccard = 6 of 10 (3)
|A ∪ B|
where |A| and
Where |B|and
|A| are |B| are the cardinal
the cardinal of set Aofand
set set
A and set B, respectively.
B, respectively.
3. Results
Results and
and Discussion
Discussion
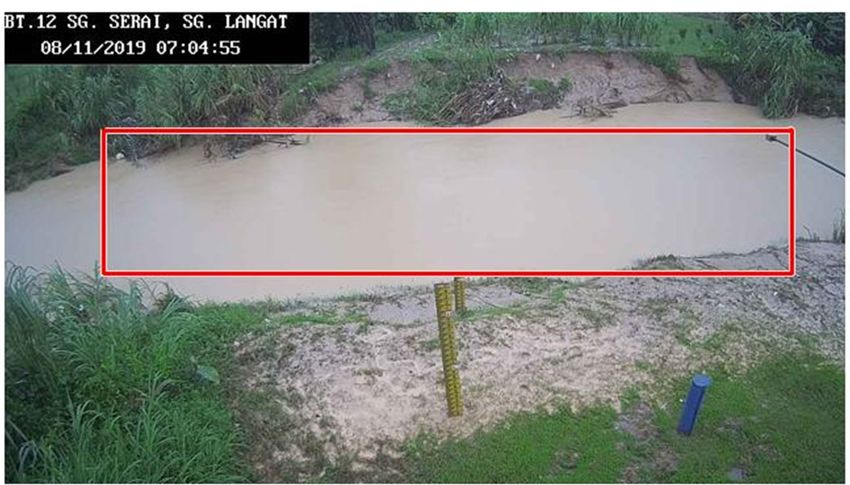
images captured
We used images captured by
by surveillance
surveillancecameras
camerasinstalled
installednear
neara ariver.
river.TheThestudy area
study areais is
located in Batu 12, Sungai Langat, Selangor, Malaysia. Two different images were used—one
Batu 12, Sungai Langat, Selangor, Malaysia. Two different images were used—one during during
normal conditions
conditions and
andthe
theother
otherduring
duringoverflowed
overflowedconditions—to
conditions—to examine
examine thethe
practicality of each
practicality of each
segmentation method.
segmentation method. The
Theimages
imageshadhadaaresolution
resolutionofof1280
1280× ×
720 and
720 andthethe
ground
ground truth images
truth were
images were
manually segmented. The original photographic images and the ground truth images
manually segmented. The original photographic images and the ground truth images are shown are shown in in
Figure 4.
Figure 4.
(a) Normal conditions
(b) Overflowed conditions
FigureFigure 4. Original
4. Original and ground
and ground truthtruth images
images during
during (a) normal
(a) normal conditions;
conditions; (b) overflowed
(b) overflowed conditions.
conditions.
3.1. Qualitative Evaluation
3.1. Qualitative
The results Evaluation
of the three segmentation methods were compared with the manually segmented
ground truth images. We did
The results of the three not requiremethods
segmentation very detailed segmentation,
were compared especially
with the manually inside the river
segmented
area;
ground thetruth
overall purpose
images. We didofnot
therequire
segmentation was to
very detailed precisely detect
segmentation, the borderline
especially of the
inside the river river.
area;
The comparisons
the overall between
purpose of thethe segmentation
segmentation results
was and the ground
to precisely truth
detect the images are
borderline ofshown in Figure
the river. The 5.
comparisons between the segmentation results and the ground truth images are shown in Figure 5.Water 2020, 12, 1825 7 of 10
Water 2020, 12, x FOR PEER REVIEW 7 of 10
Normal conditions Overflowed conditions
(a) Hybrid technique
(b) Region growing
(c) Thresholding
Figure 5.
5.The
Thecomparisons
comparisonsbetween
betweenthe segmentation
the segmentation results and
results thethe
and ground truth
ground images
truth when
images using
when using
(a) hybrid technique,
technique,(b)
(b)region
regiongrowing,
growing,and
and(c)(c)thresholding.
thresholding.
The green
green and
and magenta
magentaregions
regionsshow
showareas
areaswhere
where thethe
segmentation
segmentation results differed
results from
differed the the
from
expected ground
expected ground truth.
truth.Based
Basedon onFigure
Figure5a,
5a,the
thehybrid
hybridtechnique
technique provided
providedthethe
nearest segmentation
nearest segmentation
results to those
results those of
of the
the manually
manuallysegmented
segmentedgroundgroundtruth
truthimage. ItsIts
image. detection of the
detection water
of the edge
water waswas
edge
almost identical to that of the ground truth image. The region growing method was
almost identical to that of the ground truth image. The region growing method was able to segment able to segment
the images
the imagesintointoforeground
foreground andand background,
background, though
though therethere
werewere
some some
major major spots itwhere
spots where it
mistakenly
mistakenly classified the water as background and vice versa, as shown in Figure 5b.
classified the water as background and vice versa, as shown in Figure 5b. This was also the case with This was also
the thresholding
the case with the thresholding technique.
technique. Figure Figure
5c shows 5cthe
that shows that the thresholding
thresholding method
method labeled partlabeled
of the part
ground
of the ground as water due to the similarity in color between the river
as water due to the similarity in color between the river water and the bare soil. water and the bare soil.
3.2. Quantitative
3.2. QuantitativeEvaluation
Evaluation
AA quantitative
quantitative comparison
comparisonwaswasperformed
performedbetween
betweenthe
the ground
ground truth
truth andandthethe segmentation
segmentation results
results using the DSC and Jaccard index metrics. Both metric results ranged from
using the DSC and Jaccard index metrics. Both metric results ranged from 0% to 100%, 0% to 100%, with
with 0%
0% indicating
indicating thatthat there
there waswas no overlap
no overlap between
between the two
the two segmented
segmented regions
regions andand100%100% indicating
indicating a
a perfect
perfect match between the two segmentations. The evaluations of segmented images using DSC are
listed in Table 1.Water 2020, 12, 1825 8 of 10
match between the two segmentations. The evaluations of segmented images using DSC are listed in
Table 1.
Table 1. Dice score (DSC) for normal and overflowed conditions.
Segmentation Method Normal Conditions (%) Overflowed Conditions (%)
Hybrid 96.71 98.68
Region growing 94.90 98.22
Thresholding 77.99 97.77
The hybrid technique obtained the highest dice score, followed by region growing and thresholding
for both normal and overflowed conditions. The dice scores for the hybrid technique approached
100%, indicating that almost the entire segmented images overlapped with the ground truth images.
The average dice score of hybrid technique for both conditions was 97.70%.
The Jaccard index was also calculated to analyze the similarity between the segmentation algorithm
results and the ground truth data. The results of the Jaccard index are shown in Table 2.
Table 2. Jaccard index for normal and overflowed conditions.
Segmentation Method Normal Conditions (%) Overflowed Conditions (%)
Hybrid 93.63 97.39
Region growing 90.20 96.51
Thresholding 63.92 95.63
Based on the Jaccard index, the hybrid technique obtained the highest values for both water
conditions followed by region growing and thresholding. The average Jaccard index of the hybrid
technique for both conditions was 95.51%. The thresholding method performed the worst out of the
three techniques because the algorithm mistakenly classified the ground as water due to the similarity
of color between the river water and bare soil. This result implies that the thresholding method is
strongly dependent on image characteristics, such as lighting conditions [33].
Overall, the hybrid technique obtained higher values for both the Jaccard index and the dice score
compared to the region growing and thresholding methods, and obtained results higher than 95%
on average. The results demonstrated that the hybrid technique performed well among the three
techniques evaluated as it combined more than one technique. In this case, two techniques were used
to segment the image. Hence, it can offer better results compared to other segmentation methods [31].
4. Conclusions
Over the last decade, researchers have increasingly employed computer vision approaches
to improve flood detection and monitoring systems, and thus to reduce the severe impacts of
flood disasters. Computer vision captures and processes images using segmentation techniques
to understand their content. This paper presented a comparison of three segmentation methods
for extracting information from digital images for flood monitoring systems. Thresholding, region
growing, and hybrid techniques were compared on the basis of visual evaluation and statistical
accuracy. Based on the experimental results, these techniques were all capable of extracting water
information from the image. However, the hybrid technique was found to be the most promising image
processing technique for extracting water features from digital images, with segmentation evaluation
results higher than 95% on average. One problem identified with the use of these segmentation
techniques is the need to change the algorithms when using different images. Semantic segmentation
is another method to identify real-time events [34]. Future research may be planned to study deep
learning techniques in order to develop more advanced segmentation methods.Water 2020, 12, 1825 9 of 10
Author Contributions: N.A.M.: conceptualization, methodology, writing—original draft preparation, software.
A.F.A.: writing—review, editing, validation, project administration. S.K.B.: conceptualization, software,
visualization. M.R.M.: visualization, supervision. A.M.: supervision. All authors have read and agreed
to the published version of the manuscript.
Funding: This study was funded by Universiti Putra Malaysia under Geran Putra Berimpak (UPM/800-3/
3/1/GPB/2019/9678700).
Acknowledgments: The authors appreciate the support for this study from the Universiti Putra Malaysia and the
Institute of Aquaculture and Aquatic Sciences.
Conflicts of Interest: The authors declare no conflict of interest.
References
1. Goyari, P. Flood damages and sustainability of agriculture in Assam. Econ. Political Wkly. 2005, 40, 2723–2729.
2. Brémond, P.; Grelot, F. Review Article: Economic evaluation of flood damage to agriculture—Review and
analysis of existing methods. Nat. Hazards Earth Syst. Sci. 2013, 13, 2493–2512. [CrossRef]
3. Muhadi, N.A.; Abdullah, A.F.; Vojinovic, Z. Estimating Agricultural Losses using Flood Modeling for Rural
Area. MATEC Web Conf. 2017, 103, 4009. [CrossRef]
4. Muhadi, N.; Abdullah, A.F. Flood damage assessment in agricultural area in Selangor River Basin. J. Teknol.
2015, 76, 111–117. [CrossRef]
5. Ahmadzadeh Araji, H.; Wayayok, A.; Massah Bavani, A.; Amiri, E.; Abdullah, A.F.; Daneshian, J.; Teh, C.B.S.
Impacts of climate change on soybean production under different treatments of field experiments considering
the uncertainty of general circulation models. Agric. Water Manag. 2018, 205, 63–71. [CrossRef]
6. Abery, N.W.; Hai, N.; Hao, N.; Minh, T.; Phuong, N.; Sumnongsong, S.; Dulyapurk, V.; Kaewnern, M.;
Nagothu, U.; De Silva, S. Perception of Climate Change Impacts and Adaptation of Shrimp Farming in Ca
Mau and Bac Lieu, Vietnam: Farmer Focus Group Discussions and Stakeholder Workshop Report. 2009.
Available online: http://webcache.googleusercontent.com/search (accessed on 17 March 2020).
7. García-pintado, J.; Mason, D.C.; Dance, S.L.; Cloke, H.L.; Neal, J.C.; Freer, J.; Bates, P.D. Satellite-supported
flood forecasting in river networks: A real case study. J. Hydrol. 2015, 523, 706–724. [CrossRef]
8. Notti, D.; Giordan, D.; Cal, F.; Pepe, A.; Zucca, F.; Galve, J.P. Potential and Limitations of Open Satellite Data
for Flood Mapping. Remote Sens. 2018, 10, 1673. [CrossRef]
9. Pekel, J.F.; Vancutsem, C.; Bastin, L.; Clerici, M.; Vanbogaert, E.; Bartholomé, E.; Defourny, P. A near real-time
water surface detection method based on HSV transformation of MODIS multi-Spectral time series data.
Remote Sens. Environ. 2014, 140, 704–716. [CrossRef]
10. Pulvirenti, L.; Chini, M.; Pierdicca, N.; Guerriero, L.; Ferrazzoli, P. Flood monitoring using multi-temporal
COSMO-skymed data: Image segmentation and signature interpretation. Remote Sens. Environ. 2011, 115,
990–1002. [CrossRef]
11. Rokni, K.; Ahmad, A.; Selamat, A.; Hazini, S. Water feature extraction and change detection using
multitemporal landsat imagery. Remote Sens. 2014, 6, 4173–4189. [CrossRef]
12. Schumann, G.J.P.; Neal, J.C.; Mason, D.C.; Bates, P.D. The accuracy of sequential aerial photography and SAR
data for observing urban flood dynamics, a case study of the UK summer 2007 floods. Remote Sens. Environ.
2011, 115, 2536–2546. [CrossRef]
13. Skakun, S.; Kussul, N.; Shelestov, A.; Kussul, O. Flood Hazard and Flood Risk Assessment Using a Time
Series of Satellite Images: A Case Study in Namibia. Risk Anal. 2014, 34, 1521–1537. [CrossRef]
14. Filonenko, A.; Hernández, D.C.; Seo, D.; Jo, K.-H. Real-time flood detection for video surveillance.
In Proceedings of the IECON 2015—41st Annual Conference of the IEEE Industrial Electronics Society,
Yokohama, Japan, 9–12 November 2015; pp. 4082–4085.
15. Menon, K.P.; Kala, L. Detection and Mobile App for Flood Alert. In Proceedings of the IEEE 2017 International
Conference on Computing Methodologies and Communication, Erode, India, 18–19 July 2017; pp. 515–519.
16. Sanmiguel, J.C.; Martínez, J.M. A semantic-based probabilistic approach for real-time video event recognition.
Comput. Vis. Image Underst. 2012, 116, 937–952. [CrossRef]
17. Mettes, P.; Tan, R.T.; Veltkamp, R.C. Water detection through spatio-temporal invariant descriptors.
Comput. Vis. Image Underst. 2017, 154, 182–191. [CrossRef]Water 2020, 12, 1825 10 of 10
18. Creutin, J.D.; Muste, M.; Bradley, A.A.; Kim, S.C.; Kruger, A. River gauging using PIV techniques: A proof of
concept experiment on the Iowa River. J. Hydrol. 2003, 277, 182–194. [CrossRef]
19. Adams, R.; Bischof, L. Seeded region growing. IEEE Trans. Pattern Anal. Mach. Intell. 1994, 16, 641–647.
[CrossRef]
20. Shih, F.Y.; Cheng, S. Automatic seeded region growing for color image segmentation. Image Vis. Comput.
2005, 23, 877–886. [CrossRef]
21. Nath, R.K.; Deb, S.K. Water-Body Area Extraction from High Resolution Satellite Images-An Introduction,
Review, and Comparison. Int. J. Image Process. 2010, 3, 353–372.
22. Lai, C.L.; Yang, J.C.; Chen, Y.H. A real time video processing based surveillance system for early fire and
flood detection. In Proceedings of the 2007 IEEE Instrumentation & Measurement Technology Conference
IMTC 2007, Warsaw, Poland, 1–3 May 2007; pp. 1–6.
23. Borges, P.V.K.; Mayer, J.; Izquierdo, E. A probabilistic model for flood detection in video sequences.
In Proceedings of the 2008 15th IEEE International Conference on Image Processing, San Diego, CA, USA,
12–15 October 2008; pp. 13–16.
24. San Miguel, M.J.P.; Ruiz, C.R. A flood detection and warning system based on video content
analysis. In Proceedings of the International Symposium on Visual Computing, Las Vegas, NV, USA,
12–14 December 2006; Springer: Berlin/Heidelberg, Germany, 2016; Volume 8034, pp. 65–74.
25. Lo, S.-W.; Wu, J.-H.; Lin, F.-P.; Hsu, C.-H. Cyber surveillance for flood disasters. Sensors 2015, 15, 2369–2387.
[CrossRef]
26. Jyh-Horng, W.; Chien-Hao, T.; Lun-Chi, C.; Shi-Wei, L.; Fang-Pang, L. Automated Image Identification
Method for Flood Disaster Monitoring In Riverine Environments: A Case Study in Taiwan. In Proceedings
of the AASRI International Conference on Industrial Electronics and Applications (IEA 2015), London, UK,
27–28 June 2015; Atlantis Press: Paris, France, 2015.
27. Geetha, M.; Manoj, M.; Sarika, A.S.; Mohan, M.; Rao, S.N. Detection and estimation of the extent of flood
from crowd sourced images. In Proceedings of the 2017 IEEE International Conference on Communication
and Signal Processing (ICCSP), Melmaruvathur, India, 6–8 April 2017; pp. 603–608.
28. Zhang, Q.; Jindapetch, N.; Duangsoithong, R.; Buranapanichkit, D. Investigation of Image Processing
based Real-time Flood Monitoring. In Proceedings of the 2018 IEEE 5th International Conference on Smart
Instrumentation, Measurement and Application (ICSIMA), Songkhla, Thailand, 27–28 November 2018;
pp. 1–4.
29. Langhammer, J.; Vacková, T. Detection and Mapping of the Geomorphic Effects of Flooding Using UAV
Photogrammetry. Pure Appl. Geophys. 2018, 175, 3223–3245. [CrossRef]
30. Khan, M.W. A survey: Image segmentation techniques. Int. J. Future Comput. Commun. 2014, 3, 89–93.
[CrossRef]
31. Lankton, S.; Nain, D.; Yezzi, A.; Tannenbaum, A. Hybrid geodesic region-based curve evolutions for image
segmentation. In Medical Imaging 2007: Physics of Medical Imaging; International Society for Optics and
Photonics: San Diego, CA, USA, 2007; Volume 6510, p. 65104.
32. Zhang, H.; Fritts, J.E.; Goldman, S.A. Image segmentation evaluation: A survey of unsupervised methods.
Comput. Vis. Image Underst. 2008, 110, 260–280. [CrossRef]
33. Thenkabail, P.S. Remote Sensing of Water Resources, Disasters, and Urban Studies; CRC Press: Boca Raton, FL,
USA, 2015; ISBN 1482217929.
34. Leo, M.; Medioni, G.; Trivedi, M.; Kanade, T.; Farinella, G.M. Computer vision for assistive technologies.
Comput. Vis. Image Underst. 2017, 154, 1–15. [CrossRef]
© 2020 by the authors. Licensee MDPI, Basel, Switzerland. This article is an open access
article distributed under the terms and conditions of the Creative Commons Attribution
(CC BY) license (http://creativecommons.org/licenses/by/4.0/).You can also read