Imaging human blood cells in vivo with oblique back-illumination capillaroscopy
←
→
Page content transcription
If your browser does not render page correctly, please read the page content below
Imaging human blood cells in vivo with oblique
                                                  back-illumination capillaroscopy
                                                  G REGORY N. M C K AY, 1 N ELA M OHAN , 1                  AND    N ICHOLAS J. D URR 1,*
                                                  1 Departmentof Biomedical Engineering, Johns Hopkins University (JHU), 3400 N. Charles Street,
                                                  Baltimore, MD, 21218, USA
                                                  * ndurr@jhu.edu

                                                  http://durr.jhu.edu
arXiv:2001.06284v1 [physics.bio-ph] 14 Jan 2020

                                                  Abstract: We present a non-invasive, label-free method of imaging blood cells flowing
                                                  through human capillaries in vivo using oblique back-illumination capillaroscopy (OBC). Green
                                                  light illumination allows simultaneous phase and absorption contrast, enhancing the ability to
                                                  distinguish red and white blood cells. Single-sided illumination through the objective lens enables
                                                  200 Hz imaging with close illumination-detection separation and a simplified setup. Phase
                                                  contrast is optimized when the illumination axis is offset from the detection axis by approximately
                                                  225 µm when imaging ∼80 µm deep in phantoms and human ventral tongue. We demonstrate
                                                  high-speed imaging of individual red blood cells, white blood cells with sub-cellular detail,
                                                  and platelets flowing through capillaries and vessels in human tongue. A custom pneumatic
                                                  cap placed over the objective lens stabilizes the field of view, enabling longitudinal imaging of
                                                  a single capillary for up to seven minutes. We present high-quality images of blood cells in
                                                  individuals with Fitzpatrick skin phototypes II, IV, and VI, showing that the technique is robust
                                                  to high peripheral melanin concentration. The signal quality, speed, simplicity, and robustness of
                                                  this approach underscores its potential for non-invasive blood cell counting.

                                                  © 2020 Optical Society of America under the terms of the OSA Open Access Publishing Agreement

                                                  1.   Introduction
                                                  The complete blood count (CBC) is an invaluable diagnostic test that provides clinical insight in
                                                  nearly every disease state. The CBC is the most frequently ordered blood test, with approximately
                                                  34.5 million Medicare-reimbursed CBCs performed annually in the United States [1]. While
                                                  generally effective, the CBC requires invasive blood draw followed by laboratory analysis.
                                                  For some vulnerable patient populations, such as immunocompromised cancer patients at risk
                                                  for hospital-acquired infection and neonates at risk of phlebotomy-induced anemia, patient
                                                  management could be dramatically improved by a non-invasive CBC [2–4].
                                                     Non-invasive imaging of human vasculature continues to reveal interesting, clinically relevant
                                                  phenomena despite its long history [5–9]. Recently, the frequency of optical absorption
                                                  gaps between red blood cells imaged in nailfold capillaries has been inversely-correlated with
                                                  neutropenia in cancer patients [10]. However, due to the depth of these capillaries, individual
                                                  white blood cells (WBCs) have not been resolved. Further, absorption of visible light by melanin
                                                  in the epidermis results in a rapid degradation of image quality, making even optical absorption
                                                  gaps difficult to capture when imaging the nailfold of individuals with Fitzpatrick skin phototype
                                                  types V and VI.
                                                     Several modern microscopy techniques have been investigated in recent years for imaging
                                                  blood cells in vivo. Methods such as reflectance confocal, second-, and third-harmonic generation
                                                  microscopy have shown promise as research tools for in vivo blood cell imaging, though all of
                                                  these methods suffer from higher cost, increased complexity, and slower imaging speeds than
                                                  capillaroscopy [11–13]. Spectrally-encoded flow cytometry can distinguish between granulocyte
                                                  and mononuclear cell populations in the human lip, though this technique requires a complicated
                                                  spectral confocal microscope and the challenging alignment of intersecting an imaging line
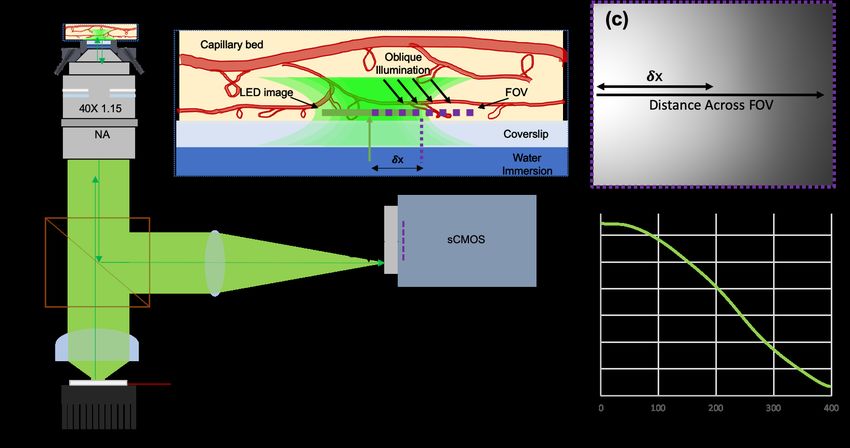
with a capillary in 3D space [14, 15]. Recently, epi-illumination gradient light interference
microscopy (epi-GLIM) demonstrated tomographic reconstructions of thick, scattering biological
specimens, though at an imaging speed of only 4 Hz [16]. In 2012 Ford et al. introduced
oblique back-illumination microscopy (OBM), a technique that enables phase contrast in thick,
turbid media with epi-illumination, which was further developed for video-rate acquisition and
quantitative reconstruction [17–19]. The offset of illumination and detection axes produces
an intensity gradient across the imaging field of view, and results in phase contrast due to the
net oblique orientation of light backscattered through the focal plane. The ability to deploy
absorption and phase contrast in an epi-illumination configuration has laid the foundation for
the high-speed imaging of blood cells in vivo with a simple optical setup, provided superficial
capillaries are present.
   The choice of anatomical location is paramount for successful implementation of OBM for
capillary imaging, with phase contrast extending only to a depth of approximately 100 µm in
highly-scattering media like skin [17]. Human capillaries in the nailfold, lying within dermal
papillae just beyond the dermal-epidermal junction, are often 150-400 µm beneath the tissue
surface [20, 21]. In contrast, the epithelial lining of the oral mucosa is without a stratified
squamous layer and can be less than 100 µm in thickness [22, 23]. Further, melanocytes within
the oral mucosa, and in particular the floor of the mouth and ventral tongue, tend to have fewer
connections to adjacent keratinocytes, leading to lower melanin distribution as compared to
peripheral skin [24, 25]. Together, the superficiality of capillaries and decreased absorption due
to reduced melanin distribution make the oral cavity an advantageous location for blood cell
imaging in humans.
   This paper demonstrates that phase contrast can be generated using oblique back-illumination
in a simple capillaroscope by critically imaging an LED at a lateral offset with respect to
the optical axis of the detector, rather than using an external fiber-based source [17–19]. In
addition to obviating the need for external fiber optics, this approach allows for small and tunable
illumination-detection offset. Using green light and a 225 µm illumination-detection offset,
simultaneous phase and hemoglobin absorption contrast is achieved, allowing clear imaging and
differentiation of white and red blood cell types from a single image. With this approach, we
demonstrate 200 Hz imaging of red blood cells, white blood cells, platelets, and sub-cellular
granules when imaging ventral tongue capillaries of human participants with a wide range of
Fitzpatrick skin types. The signal quality, speed, simplicity, and robustness of this approach may
make it a practical technique for measuring complete blood counts non-invasively.

2.     Methods
2.1.    Imaging System
Illumination is generated by a green LED (Superbright 1W XLamp LED, 88 lm, 527 nm)
critically imaged into a capillary bed by a 20 mm collimating lens (Thorlabs ACL2520U-A) and
40x microscope objective (Nikon 1.15 NA APO LWD WI λS). To produce phase contrast, the
detector is laterally translated off-axis (Figure 1(a)-(b)). The offset between the illumination and
detection axes results in a gradient of illumination intensity across the full field of view (FOV)
(Figure 1(c)-(d)), and consequently, a net obliquity of light passing through blood cells [17].
A 50:50 non-polarizing beamsplitter (CCM1-BS013) is used to redirect the light scattered by
the tissue through a 200 mm tube lens (Thorlabs AC254-200-A-ML) and onto an image sensor
(pco.edge sCMOS 5.5).
   A custom, pneumatic objective cap was designed in Solidworks and 3D printed in aluminum
(Figure 2). This cap contained eight suction ports, equally spaced every 45 degrees about a 21
mm diameter circle around a coverslip collar. The correction collar of the microscope objective
was set to 150 µm for use with 12 mm diameter #1 thickness coverslips. The imaging depth of
the microscope was tuned to match the depth of the superficial capillaries by manually threading
the coverslip collar up and down within the objective cap. A vacuum was connected to these
ports using 1/16" ID PVC tubing connected to two straightflow rectangular manifolds with barbed
tube adapters (McMaster-Carr 5233K51, 1023N13, and 4406T15, respectively). Pressure was
increased slowly to stabilize capillaries without causing pain or tissue damage.
   A flatfield correction algorithm was applied to the acquired images to correct for the intensity
gradient across the field of view (Figure 1(c)-(d)). This was accomplished by dividing each
image by a blurred version of itself [17]. The blurred image was obtained by convolving with
a Gaussian kernel with an 80-pixel standard deviation, which corresponds to 13 µm in object
space.

         Fig. 1. (a) Oblique back-illumination capillaroscope optical layout. An LED is placed
         at the focal plane of a collimating lens (CL), and imaged critically into a capillary
         bed by a 40x objective lens. Scattered light is reflected off a beamsplitter (BS) and
         focused onto a laterally-displaced sCMOS by a tube lens (TL). (b) Oblique illumination
         is produced by offsetting the field of view (FOV) from the image of the LED. The
         camera displacement (δx 0 ) causes a 1/40x displacement in object space (δx). (c)-(d)
         An intensity gradient is produced, making the illumination-detection offset vary with
         distance across the full FOV for a fixed δx = 208 µm.

         Fig. 2. (a) Image of pneumatic objective cap, and (b) mechanical drawing (mm units).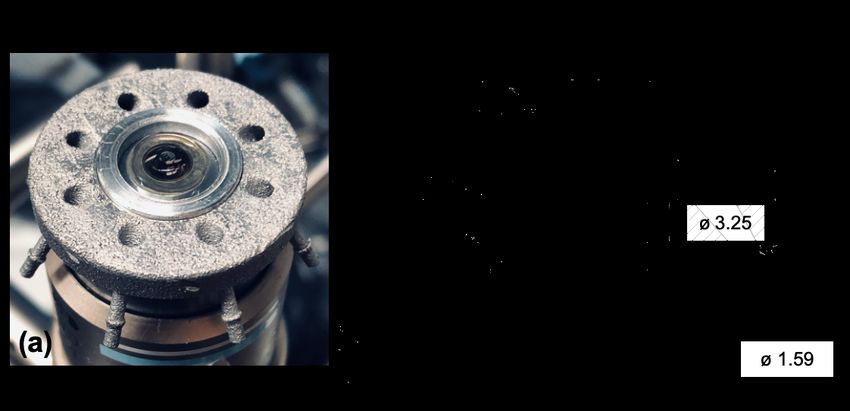
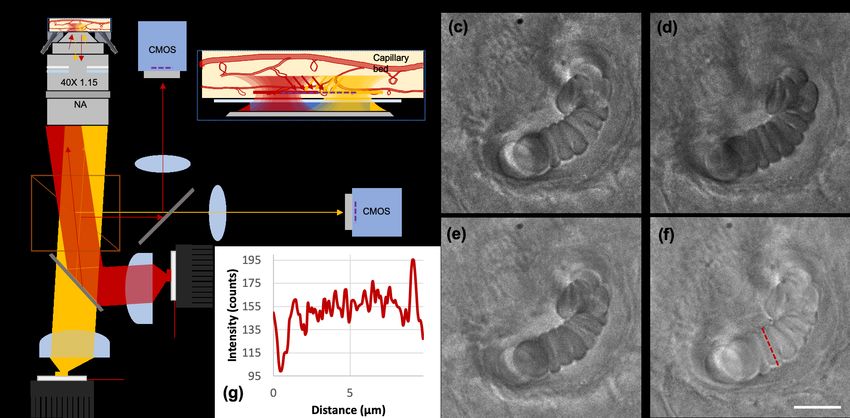
2.2.    In Vivo Phase Contrast Optimization
Phase contrast in OBM relies on the net obliquity of scattered photons through the imaging
plane, which increases with decreasing illumination-detection separation [17]. In addition to this
effect, we observe that, for very short separations, the backscatter of the illumination begins to
overwhelm the phase contrast. To manage this tradeoff and optimize phase contrast, we measured
phase contrast as a function of illumination-detection separation.
   To optimize contrast to blood cells in vivo, images of a single capillary were taken with the LED
imaged critically on-axis, and the detector offset 208 µm (half of the FOV of the detector in object
space) such that the peak intensity of the gradient field was conjugate to the edge of the sensor
(Figure 1(c)-(d)). A video was acquired at 50 Hz of the same capillary as it was laterally translated
from left to right across the field of view, while keeping the LED and sensor position fixed (Figure
3(a)-(d)). The phase contrast between adjacent, stacked red blood cells at different distances
across the FOV was measured using Weber contrast (CW = (Imax − Imin )/Imin ), calculated from
plot profiles taken across the cells in the direction of the illumination-detection offset. Though
phase contrast is most useful in imaging white blood cells, since these are rare, heterogenous,
and difficult to visualize in the absence of phase contrast, we measured the phase contrast of
the plasma membrane between adjacent, stacked red blood cells in order to characterize phase
contrast over a range of illumination-detection separations.

2.3.    In Vivo Capillary Imaging
The ventral tongue of human participants was imaged with approval by the Johns Hopkins
University Institutional Review Board (IRB00204985). Three individuals were enrolled for
imaging, with Fitzpatrick skin phototypes II, IV, and VI. Images of complete blood cell
components (Figure 4) were selected from videos acquired at 200 Hz and 500 µs exposure time.
Images of participants with different skin tone (Figure 5) were acquired at 50 Hz and 500 µs.

2.4.    Phase Contrast in Fixed Phantom
In order to: (1) quantify phase contrast of the exact same phase object for a range of illumination-
detection separations, and (2) verify the ability to reconstruct absorption-enhanced and phase-
enhanced representations acquired from conventional oblique back-illumination microscopy, we
imaged a phantom with fixed phase contrast. We constructed a back-scattering phase phantom
by mixing 10% coffee creamer (French Vanilla Delight) in 90% water in a 1% w/v agar gel.
The creamer creates lipid phase particles with low absorption within the sample. One such
particle, approximately 10 µm in diameter, was imaged while the LED was laterally translated
and the sensor was aligned on-axis. The Weber contrast was measured at each LED location
by measuring the lateral intensity profile across the phase particle along the direction of LED
motion. Additionally, images were taken at two diametrically opposed positions (δx = ±240 µm),
and either summed or subtracted, respectively, to create the characteristic absorption-enhanced
and phase-enhanced images of oblique back-illumination microscopy [17].

3.     Results and Discussion
3.1.    In Vivo Phase Contrast Optimization
With the pneumatic objective cap turned off, a video was acquired of a single capillary in the
ventral tongue of a human volunteer as it was swept laterally across the full FOV (Figure 3(a)-(d)).
The plasma membrane of red blood cells appeared visible only from absorption contrast when
the capillary was near the illumination axis (Figure 3(e)), and phase contrast was at a maximum
near the center of the FOV (Figure 3(f)). Plot profiles across adjacent, stacked red blood cells
show the improvement of phase contrast as the target is moved away from the peak illumination
(Figure 3(g)). The Weber contrast between overlapping red blood cells was measured at known
capillary distances across the FOV (Figure 3(h)). We found phase contrast was maximized at
approximately 200-250 µm, regardless of whether the contrast was calculated with raw or flat
field corrected data. Unless otherwise stated (as in the Appendix, section 5), all subsequent in
vivo data presented here was acquired with this geometry - the LED imaged on-axis, the sensor
displaced 208 µm in object space, and capillaries stabilized near the center of the FOV where
phase contrast was optimized.

         Fig. 3. Imaging a single capillary translated across the full FOV. (a) Full FOV with
         intensity gradient outlining where 90 x 90 µm regions of interest were acquired: cyan
         (b), magenta (c), and yellow (d). (b) Red blood cells close to the intensity peak (left
         edge of sensor) demonstrate only absorption contrast, (c) phase contrast is maximized
         near the center of the full FOV, and degrades due to low signal at large displacements,
         (d). (e) & (f) Enlarged regions of interest (15 x 15 µm) at locations of minimum and
         maximum phase contrast, respectively, with example normalized intensity plot profiles
         shown for each, (g). (h) Overall trend of distance across FOV vs. phase contrast
         demonstrates highest contrast at approximately 200-250 µm illumination-detection
         separation. Scale bars 10 µm (b)-(d) and 5 µm (e)-(f).

3.2.   In Vivo Capillary Imaging
Videos of capillaries and other larger blood vessels were acquired in the ventral tongue of a
human participant with the LED imaged on-axis and the sensor offset. Capillaries were stabilized
at the center of the field of view using suction from the pneumatic objective cap. Figure 4 shows
example frames from these videos. Videos of these data can be seen in Visualizations 1-5.
   Images in Figure 4(a)-(d) show a superficial capillary wide enough for only single red blood
cell (RBC) passage. RBCs appear characteristically dark due to absorption of green light by
hemoglobin. The outlines of RBC plasma membranes demonstrate the predicted phase contrast
due to the offset sensor, critically imaged LED, and net oblique illumination. In plasma gaps
between red blood cells, the phase contrast of the oblique back-illumination capillaroscope
outlines platelets and other small particles approximately 600 nm in diameter that could be
chylomicrons (Visualization 1 and Visualization 2).
   Images in Figure 4(e)-(h) highlight the presence of red and white blood cells passing through
a larger vessel approximately 25 µm in diameter. For every several hundred RBCs that pass
through a vessel, we observed a single or pair of WBCs with variable size and granularity. For
example, the WBC in Figure 4(e) appears small and non-granular, 9.75 µm across, which are
characteristics of a lymphocyte. The WBC in Figure 4(f) is 11 µm across and visibly granular,
Fig. 4. Oblique back-illumination capillaroscopy can resolve red blood cells (RBCs),
white blood cells (WBCs), platelets, and potentially chylomicrons or other lipid particles
within human ventral tongue capillaries. (a)-(d) A superficial capillary within a dermal
papilla surrounded by stratum spinosum shows red blood cells (a)-(b), platelets (b)-(c),
and lipid particles (d) (see Visualization 1 and Visualization 2). (e)-(h) Thousands of
red blood cells pass rapidly through larger vessels with intermittent white blood cells
of various size and granularity (see Visualization 3). (i)-(l) Granular and agranular
white blood cells of varying size are visible across multiple different capillaries (see
Visualization 4 and Visualization 5). Scale bars are 10 µm.
making it likely a granulocyte. Lastly, the WBC in Figure 4(h) is larger at 13.5 µm in length and
non-granular, predicted features of a monocyte. Further work must be done in vitro to isolate and
image known examples of each WBC type before these labels can be confirmed.
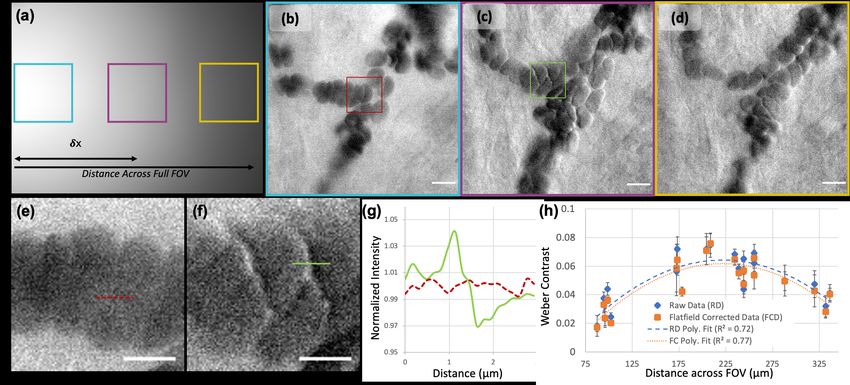
A device for non-invasive blood cell counting should work across individuals of different skin
type. In this portion of the study, we enrolled three different individuals with Fitzpatrick skin
phototype II, IV, and VI to test if contrast to the outline of red blood cells is similar despite
differences in peripheral skin pigmentation. Figure 5 shows the results of this experiment. As
shown in Figure 5(h), the plot profile across two adjacent, stacked red blood cells demonstrates
the predicted phase contrast pattern regardless of skin type. Weber contrast is 7.5%, 8.1%, and
7.9% for Fitzpatrick skin phototype II, IV, and VI, respectively.Fig. 5. (a)-(c) Imaging of three human subjects demonstrates robustness of ventral
tongue imaging to differences in Fitzpatrick skin phototype. Scale bar 20 µm. (e)-(g)
enlarged regions of interest with 5 µm scale bar. (d) Plot profiles across two adjacent
stacked red blood cells in each image. (h) Enlarged plot profiles across adjacent red
blood cell interface (dashed lines).
3.3. Phantom Phase Contrast Optimization
In an alternate geometry, illumination-detection separation can be created by keeping the sensor
on axis, but laterally displacing the LED instead. To test the dependence of phase contrast on
illumination-detection separation in this geometry, we utilized an agar phantom with creamer
phase particles. We found that contrast was optimized with a conjugate LED displacement of
approximately 240 µm in object space (Figure 6(a)), nearly consistent with the in vivo phase
contrast optimization results (Figure 3(h)). Images of the phase particle with on-axis and optimal
off-axis illumination are shown as inserts in Figure 6(b)-(c). Images were also taken by translating
the LED to two diametrically opposed positions (±240 µm) with respect to the phase particle
(Figure 6(d)-(e)). Addition and subtraction of these two images generates absorption-only and
phase-only images, respectively (Figure 6(f)-(g)). Together these images highlight the parallels
between phase contrast produced in this technique and Fort et al.’s oblique back-illumination
microscopy approach [17].Fig. 6. (a) Images of a stationary 10 µm phase particle in a back-scattering phantom
shows optimal phase contrast at 240 µm of LED displacement. Example images of this
particle are shown for (b) on-axis LED imaging and (c) 240 µm LED displacement.
(d), (e) When the illumination is diametrically opposed (Âś240 µm displacement),
traditionally OBM allows the calculation of (f) absorption-only (addition image), and
(g) phase-only (subtraction image) contrast. Scale bars 5 µm.
4. Conclusion
Oblique back-illumination capillaroscopy in the ventral tongue is a simple, robust microscopy
technique for imaging human blood cells regardless of skin tone. Combined with pneumatic
stabilization, this technique is able to longitudinally image thousands of blood cells passing
through individual human capillaries at high resolution and high speeds. We demonstrate that this
technique allows visualization of red blood cells, white blood cells, and platelets, and sub-cellular
granules are visible in white blood cells. This technique provides the basis for development of a
non-invasive, label-free complete blood cell counter. A device with this capability would benefit
a variety of patient populations including neonates, immunocompromised patients, and those
in remote settings without access to conventional laboratory equipment and medical personnel
required for a complete blood count. In its current form, ventral tongue oblique back-illumination
capillaroscopy can be used as a research tool to easily and safely study a variety of hematologic
and immunologic processes in humans, regardless of skin tone.
5. Appendix
Dual-source oblique back-illumination capillaroscopy is a natural extension of the proposed
technique given prior publication on video-rate OBM [18]. Figure 7(a)-(b) shows one possible
realization of this technique with two, diametrically offset red and amber LEDs (Luxeonstar
LXM5-PD01 and LXM5-PL01) combined and later separated using dichroic mirrors (DM)
(Thorlabs DMLP605R). Two on-axis sensors (Imaging Source DMK33UX252) are used to
simultaneously image the red and amber signal (Figure7(c)-(d), respectively). Using the OBM
technique of addition and subtraction, absorption-only and phase-only images can be generated
(Figure 7(e)-(f), respectively). A plot profile across a red blood cell of the phase-only image
demonstrates the characteristic contrast to the outline of the plasma membrane (Figure7(g)).
While an interesting extension, we did not find that the use of a dual-source oblique back-
illumination capillaroscopy technique offered a sufficient increase in blood cell visibility to be
worth the added complexity for this preliminary study. Further work could be done to optimize
wavelengths for blood cell characterization and detection, and a quantitative phase reconstruction
approach could be implemented as done with qOBM [19].Fig. 7. (a) Schematic of dual source oblique back-illumination capillaroscope using
diametrically opposed red and amber LEDs. The two sources are combined and later
separated by two identical dichroic mirrors (DM) and projected onto two identical
sensors. (b) Enlarged schematic of illumination technique in sample space where
critically imaged, offset LEDs produce net diametrically opposed oblique illumination.
(c) Red channel image, (d) amber channel image, (e) absorption-only (addition) image,
(f) phase-only (subtraction) image, and (g) plot profile through red blood cell in
phase-only image demonstrates characteristic phase contrast from oblique illumination.
Scale bar is 10 µm).
Funding
Johns Hopkins Medical Science Training Program Fellowship; NIH (R21 EB024700 and R43
EB024299).
Disclosures
The authors are co-inventors on a provisional patent application assigned to Johns Hopkins
University. They may be entitled to future royalties from intellectual property related to the
technologies described in this article.
References
1. D. Agrawal and R. Sarode, “Complete Blood Count or Complete Blood Count with Differential: What’s the
Difference?” The Am. J. Medicine 130, 915–916 (2014).
2. E. Tai, G. P. Guy Jr., A. Dunbar, and L. C. Richardson, “Cost of Cancer-Related Neutropenia or Fever Hospitalizations
, United,” J. Oncol. Pract. 13, e552–e561 (2017).
3. J. Crawford, D. C. Dale, and G. H. Lyman, “Chemotherapy-Induced Neutropenia. Risks, consequences, and new
directions for its management.” Cancer 100, 228–237 (2003).
4. J. A. Widness, “Pathophysiology of Anaemia during the Neonatal Period,Including Anaemia of Prematurity,”
Neoreviews 9, 9–11 (2008).
5. G. E. Brown, “The Skin Capillaries in Raynaud’s Disease,” JAMA Arch. Intern. Medicine 35, 56–73 (1925).
6. P. Jung and F. Trautinger, “Capillaroscopy,” J. Ger. Soc. Dermatol. pp. 731–736 (2013).
7. F. Lefford and E. J. C. W, “Nailfold capillary microscopy in connective tissue disease: a quantitative morphological
analysis,” Annals Rheum. Dis. 45, 741–749 (1986).
8. C.-h. Chang, R.-k. Tsai, W.-c. Wu, S.-l. Kuo, and H.-S. Yu, “Use of Dynamic Capillaroscopy for Studying Cutaneous
Microcirculation in Patients with Diabetes Mellitus,” Microvasc. Res. 53, 121–127 (1997).
9. C. E. Curtis, W. G. Iacono, and M. Beiser, “Relationship between Nailfold Plexus Visibility and Clinical, Neuropsy-
chological, and Brain Structural Measures in Schizoprenia,” Soc. Biol. Psychiatry 46, 102–109 (1999).
10. A. Bourquard, A. Pablo-trinidad, I. Butterworth, Á. Sánchez-ferro, C. Cerrato, K. Humala, M. F. Urdiola, C. D. Rio,
B. Valles, J. M. Tucker-schwartz, E. S. Lee, B. J. Vakoc, T. P. Padera, M. J. Ledesma-carbayo, Y.-b. Chen, E. P.Hochberg, M. L. Gray, and C. Castro-gonzález, “Non-invasive detection of severe neutropenia in chemotherapy
patients by optical imaging of nailfold microcirculation,” Sci. Reports 8:5301, 1–12 (2018).
11. P. Tsai, N. Nishimura, E. Yoder, E. Dolnick, G. Allen White, and D. Kleinfeld, Principles, Design,and Construction
of a Two-Photon Laser-Scanning Microscopefor In Vitro and In Vivo Brain Imaging, May 2014 (2002).
12. C.-k. Chen and T.-m. Liu, “Imaging morphodynamics of human blood cells in vivo with video-rate third harmonic
generation microscopy,” Biomed. Opt. Express 3, 2860–2865 (2012).
13. M. Rajadhyaksha, R. R. Anderson, and R. H. Webb, “Video-rate confocal scanning laser microscope for imaging
human tissues in vivo,” Appl. Opt. 38, 2105–2115 (1999).
14. L. Golan, D. Yeheskely-hayon, L. Minai, and E. J. Dann, “Noninvasive imaging of flowing blood cells using label-free
spectrally encoded flow cytometry,” Biomed. Opt. Express 3, 628–630 (2012).
15. M. M. Winer, A. Zeidan, D. Yeheskely-hayon, L. Golan, L. Minai, E. J. Dann, and D. Yelin, “In vivo noninvasive
microscopy of human leucocytes,” Sci. Reports 7, 1–8 (2017).
16. M. E. Kandel, C. Hu, G. Naseri Kouzehgarani, E. Min, K. M. Sullivan, H. Kong, J. M. Li, D. N. Robson, M. U.
Gillette, C. Best-Popescu, and G. Popescu, “Epi-illumination gradient light interference microscopy for imaging
opaque structures,” Nat. Commun. 10, 1–9 (2019).
17. T. N. Ford, K. K. Chu, and J. Mertz, “Phase-gradient microscopy in thick tissue with oblique back-illumination,” Nat.
Methods 9, 1195–1197 (2012).
18. T. N. Ford and J. B. U. Mertz, “Video-rate imaging of microcirculation with single-exposure oblique back-illumination
microscopy,” J. Biomed. Opt. 18, 066007 (2013).
19. F. R. E. R. Obles, “Epi-mode tomographic quantitative phase imaging in thick scattering samples,” Biomed. Opt.
Express 10, 3605–3621 (2019).
20. U. Baran, L. Shi, and R. K. Wang, “Capillary blood flow imaging within human finger cuticle using optical
microangiography,” J. Biophotonics 8, 46–51 (2015).
21. I. M. Braverman, “The cutaneous microcirculation: Ultrastructure and microanatomical organization,” Microcircula-
tion 4, 329–340 (1997).
22. R. B. Presland and B. A. Dale, “Epithelial Structural Proteins of the Skin and Oral Cavity: Function in Health and
Disease,” Critical Rev. Oral Biol. Medicine 11, 383–408 (2000).
23. S. Prestin, S. Rothschild, C. S. Betz, and M. Kraft, “Measurement of epithelial thickness within the oral cavity using
optical coherence tomography,” Head Neck 34, 1777–1781 (2012).
24. A. W. Barrett and C. Scully, “Human oral mucosal melanocytes: a review,” J. Oral Pathol. & Medicine 23, 97–103
(1994).
25. L. Feller, A. Masilana, R. A. G. Khammissa, M. Altini, Y. Jadwat, and J. Lemmer, “Melanin: the biophysiology of
oral melanocytes and physiological oral pigmentation,” Head & Face Medicine 10, 1–7 (2014).You can also read