Immigration and public opinion in Australia: how public concerns about high migration are suppressed - The Australian Population ...
←
→
Page content transcription
If your browser does not render page correctly, please read the page content below

The Australian Population Research Institute, Research
Report,
May 2018

Immigration and public opinion in Australia: how
public concerns about high migration are
suppressed
Katharine Betts

The Australian Population Research Institute
PO Box 12500
Middle Camberwell
Victoria 3124
Australia
ii

Report author
Katharine Betts (mobile 0412 214 820) is Adjunct Associate Professor, Sociology, Swinburne University
of Technology and vice-president of the Australian Population Research Institute.
Articles published by the Australian Population Research Institute may be republished provided the
Institute and its writers are appropriately credited, and a link is made to our website .
Any articles reproduced cannot be edited or any material sold separately
iii

  Immigration and public opinion in Australia: how public
      concerns about high migration are suppressed

                                                  Table of contents

Executive summary ........................................................................................................ v

Why growth persists ...................................................................................................... 1

   The growth lobby ....................................................................................................... 1

   The progressive class ................................................................................................. 2

Attitudes to immigration, the 2016 Australian Election Study (AES): graduates and

     non-graduates ........................................................................................................... 3

Attitudes to immigration, the 2016 AES: voters and candidates ................................... 4

Public debate, public opinion, and silence ..................................................................... 6

Attitudes to immigration and beliefs about racism ........................................................ 7

Finding a voice ............................................................................................................. 12

Appendix 1 Tables ....................................................................................................... 14

Appendix 2 ................................................................................................................... 24

   Tapri survey method ................................................................................................ 24

   A note on Internet panel surveys .............................................................................. 24

   Questions from the Tapri survey analysed in this paper ......................................... 25

Notes ............................................................................................................................ 26
iv
v

Executive summary

Australia’s remarkable population growth over the last decade is mainly being driven by
high levels of immigration. The survey taken by the Australian Population Research
Institute (Tapri) in August 2017 found that 54 per cent of voters wanted these levels
reduced. But there is some division here. Sixty-one per cent of voters who are not
university graduates wanted a reduction but only 41 per cent of graduates agreed.
Data from the 2016 Australian Election Study (AES) collected after the July 2016
federal election show that 72 per cent of people working in arts and media actually
wanted a further increase in immigration, as did 49 per cent of teachers and academics.
In contrast, those business managers who are not graduates were the keenest on a
reduction.
The AES data also reveals an even more striking finding. Sixty per cent of the
candidates standing for election in 2016 wanted an increase in migration and only four
per cent wanted a decrease.
This position was especially marked for Labor and Greens candidates.
At that time 67 per cent of Labor candidates wanted an increase compared to only 31 per
cent of Labor voters. Labor candidates were much closer to Greens candidates and to
Greens voters than they were to their own supporters.
On the immigration question politicians live in an attitudinal world remote from the
average voter.
Over a year later in 2017 Tapri found that 74 per cent of voters thought Australia did not
need more people and that 54 per cent wanted a reduction in immigration. But adverse
public opinion has had little impact on policy. There are two reasons for this: political
pressures on policy makers applied by the growth lobby, Treasury and the Reserve
Bank, and social pressures generated by cultural progressives (most of them university
graduates). It is they who promote, and monitor, the doctrine that opposition to high
migration is racist.
The Tapri survey documents this, finding that nearly two thirds of voters think that
people who question high migration are sometimes thought of as racists. Thirty-one per
cent of this group say that this is because such sceptics usually are racists (an opinion
endorsed by 41 per cent of graduates). Sixty-nine per cent of this sub-group say that the
accusation is unfair ‘because very few of them are racists’, a proportion rising to 75 per
cent among non-graduates.
These results are used to construct a free-speech-on-immigration variable. This consists
of four categories: the ‘guardians against racism’ (those who said sceptics usually were
racist); the ‘threatened’ (those who said the accusation was unfair); the ‘fearless’ (those
who said sceptics were not ‘sometimes thought of as racist’); and the ‘confused’ (those
who said ‘don’t know’).
Graduates predominate among the guardians. Twenty-six per cent of graduates took the
strong moral position that questioning high migration was usually a manifestation of
racism. Not surprisingly, graduates who are guardians against racism are much more
likely to want an increase in migration than are the threatened or indeed the sample as a
whole.
vi

A further question found that people who were threatened by possible accusations of
racism were less likely to speak out about immigration, especially if they were
graduates. As for the confused, 45 per cent said they didn’t know enough about
immigration to discuss it.
Many voters are either silenced by the threat posed by the guardians or too confused to
take an active part in public debate. If the two categories of threatened (45 per cent) and
confused (10 per cent) are added, 55 per cent of voters may be deterred from entering
into any debate on immigration.
The guardians are right to take a strong stand against racism but wrong to see it where
none exists. The problem lies in the moral reflex that equates discontent about high
migration with racism. The silence this promotes does more than inhibit democratic
reform, it gives comfort to the growth lobby. This profits from immigration while
leaving the silenced majority to pay the costs.
Immigration and public opinion in Australia: how voters’ concerns
about high migration are sidelined and suppressed

Over the past decade Australia’s population growth has been exceptionally high, largely
fuelled by immigration (see Figure 1).1 Cities are growing rapidly, especially Melbourne
and Sydney where a majority of migrants settle.2 Infrastructure Australia reports that
Sydney is now projected to grow from 4.7 million in 2016 to just over 7.3 million in
2046 and Melbourne from 4.5 million to just under 7.3 million.3 Unless immigration is
reduced 7.3 million in 2046 for each city will be merely a way station on a journey to
ever higher numbers.

Figure 1: Australia, annual population growth, June 1972 to June 2017, ’000s

Sources: 1972 to 1981, ABS 3105.0.65.001 Australian Historical Population Statistics, 2014, Table 1.3,
1981 to 2017, ABS 3101.0 Australian Demographic Statistics Table 1. Population Change, Summary —
Australia
Note: NOM stands for net overseas migration

Population growth has its champions but, until recently, very few public critics and no
effective political opposition. As the data presented below show, this is not for want of
adverse public opinion. So why the dearth of challengers?

Why growth persists
All questions about the costs and benefits of immigration-fuelled growth aside, there are
two immediate reasons for its size and persistence. The first is political.
The growth lobby
High migration has strong support from the business interests that profit from it4 and,
within government, from Treasury5 and now the Reserve Bank.6 This focused advocacy
enjoys bipartisan support from both the Liberal/National Coalition government and the
Labor opposition. Bipartisanship means that the costs of population growth are not
2

usually debated in Parliament and that neither government nor opposition has any
political motive to produce an explicit population policy. Such a policy could well form
the basis of a public debate which neither grouping would enjoy. Rather they maintain
their silence, and the mainstream media, seeing nothing to report, have helped them to
preserve it.7 Labor, and The Greens, also have a graduate constituency that is more pro-
high migration than not.8
Even though 74 per cent of voters say Australia does not need more people,9
bipartisanship and silence mean that there has been little political discussion about the
causes and effects of population growth. The political class advocates for it but is silent
on its costs. A few independent commentators have recently shown their awareness of
this. Indeed Judith Sloan, contributing economics editor at The Australian, describes
their one-sided advocacy as a conspiracy.10

The progressive class
And then there is the influence of the progressive class, the left-leaning well-educated
intellectuals whom Thomas Piketty refers to as Brahmins.11 As in the United States
progressives have been setting the cultural agenda on affirmative action, diversity, social
justice programs in schools, and a welcoming stance on immigration.12 They tend to be
cosmopolitans who have clear ideas on what may and may not be said on questions
concerning race which, for many of them, includes immigration. For example when
Peter Dutton drew attention to links between a handful of second-generation Lebanese
Muslim migrants and terrorism13 he was roundly condemned as a racist bigot.14 ‘The
progressive view is that such issues cannot be raised’.15
Previous research has shown that people who support silence on the costs of growth are
concentrated among cultural progressives. It is they who are most likely to see questions
about the value of immigration-fuelled growth as signs of xenophobia,16 to conflate
support for immigration with an open borders approach to asylum seekers,17 and to argue
that ‘because there are many desperate to hate – [the subject of immigration] must be
treated with extreme care by politicians and journalists’.18 Most tend to think that
criticism of immigration, including immigration-fuelled population growth, is racist.19
Many progressives can be found among the growing new class of university graduates,20
their attitudes formed within a campus ethos valuing cosmopolitanism, a delight in
diversity and a preference for half-open borders, wide-open to asylum seekers —the
latter a political value of high symbolic value to those who hold it.21
The old distinctions between left and right based on economic redistribution have been
smudged or erased. New ones based on social and cultural questions have eased into
their place. Now to be ‘left-wing’ is to take progressive positions on questions such as
indigenous rights, cultural diversity and asylum seekers.22 Many are active in the serious
media and in academia. From these positions they act as ‘thought leaders’23 in public
debate.
In contrast, people who are sceptical about immigration tend to value the protection
provided by national belonging.24 They are localist in outlook, less likely to be highly
educated, more likely to be instinctive patriots, and more likely to see undocumented
asylum seekers as invaders rather than as objects of compassion. These attributes are
handicaps. Lack of education plus unfashionable commitments to the nation mean that
immigration sceptics can find it hard to express themselves in words acceptable to
progressives.
3
Attitudes to immigration, the 2016 Australian Election Study (AES): graduates and
non-graduates
Data on voters’ attitudes to immigration in the 2016 Australian Election Study (AES)
show a marked gap between different occupational groups. This gap is especially strong
with occupations filled by graduates as compared to those filled by non-graduates..
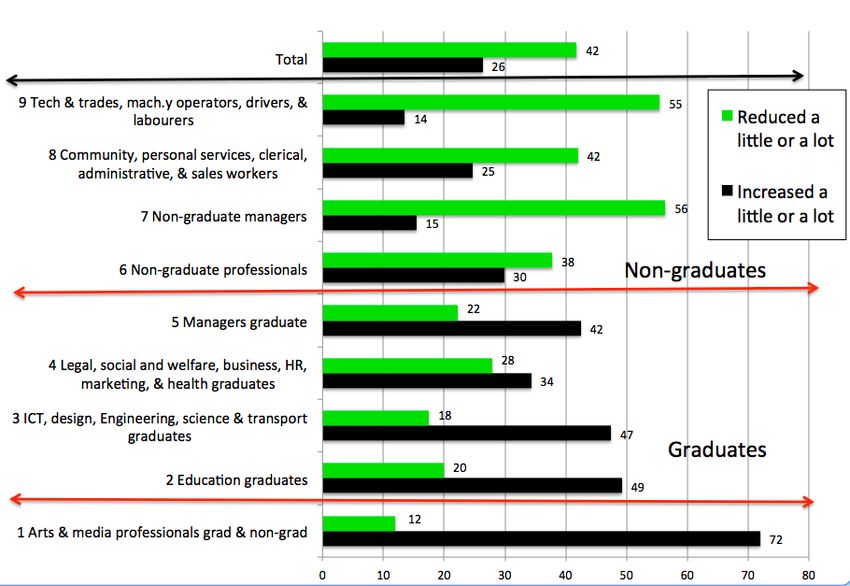
Figure 2: Immigration should be ‘reduced a little or a lot’ or ‘increased a little or a
lot’ by occupation and education, 2016 AES survey, voters %
Source: 2016 Australian Election Study (AES), voters, see Table A.1 in Appendix 1
Figure 2 shows attitudes to immigration in the 2016 AES voters’ file by occupation and
graduate status.25 All of the professionals and managers shown here have, with one
exception, been analysed according to their graduate status. (There are some graduates
in the other occupational categories but their numbers are small and, if shown, would
have made the graph too detailed to be useful.)
The exception concerns arts and media professionals. There are but 24 of them in the
sample: 12 graduates and 12 non-graduates. They are grouped together because of their
small numbers. Even though they comprise only 24 individuals the feelings of this group
are different enough from the rest, and strong enough, to be significant at the .01 level.
(This means that the probability of the difference between them and the sample as a
whole being due to chance alone is less than one in a hundred.) Their ranks include
journalists, media producers and presenters, film, television, radio and stage directors,
authors, and book and script editors.26 And despite Australia’s massive population
growth, nearly three quarters of them want the migrant intake to be set even higher.4 Arts and media professionals are in a strong position either to foster debate or to ignore it; they can be thought leaders for the nation or its de facto censors. The data shown in Figure 2 suggest that many would be tempted to use their media stewardship to sideline any criticism of immigration-fuelled growth. The occupational category next most favourable to increased immigration are graduate professionals working in education as teachers and academics. This is another group likely to contain many thought leaders. The category of graduate professionals least enthusiastic about immigration is the one including legal, welfare and health professionals. Members of this group may be more likely to come up against the problems exacerbated by growth than, for example, academics or arts and media professionals. Managers are split on the question. Managers who are graduates are much more in favour of an increase than are non-graduate managers. This is not surprising given that the former have been exposed to the progressive value set dominant in Australia’s universities. But the AES data also show that the two groups differ by income and employment sector. Non-graduate managers have a lower annual household income: 27 per cent are on more than $140,000 a year, as opposed to 48 per cent of graduate managers. And compared to graduate managers, the non-graduates are twice as likely to be self-employed, and only half as likely to work in the public sector. (See Tables A.8 and A.9 in Appendix 1.) The most striking overall finding in Figure 2 is that graduates are much more likely to want in increase in immigration than a reduction. In contrast, non-graduates are much more likely to want the reverse. Attitudes to immigration, the 2016 AES: voters and candidates Figure 3 is also drawn from the 2016 Australian Election Study (AES) but this time it includes candidates as well as voters.27 It contrasts voters’ attitudes to immigration with those of the men and women who hoped to represent them. (The candidates were drawn from the four main parties: Labor, Liberal, National and Greens. Liberals and Nationals have been grouped together here as the Coalition.)
5

Figure 3: ‘The number of migrants allowed into Australia at the present time has’—
          (%)
        60

        50

        40
                                                                           Candidates
        30
                                                                           All voters
        20                                                                 Graduates

        10                                                                 Non-graduates

         0
              Gone much too        About right      Not gone far
               far or too far                     enough or nearly
                                                     far enough

    Source: Australian Election Study (AES), candidates and voters, 2016. See Table A.2 in Appendix 1.

This shows that voters who are dissatisfied with the effect of population growth on their
quality of life are unlikely to find ready champions in parliament. The views of election
candidates are quite unlike those of all voters, and especially unlike those of non-
graduates. Sixty per cent of election candidates are not only happy with things as they
are, they want even more immigration, while only six per cent share the views of the
many non-graduates (49 per cent) who want less.
When the data are arranged by the party people voted for in the House of
Representatives, and the candidates standing for that party, it is clear that there is a wide
difference between the views of Labor voters and Labor candidates.
Figure 4 shows that more than twice as many Labor candidates wanted an increase in
immigration as did Labor voters. Thirty-three per cent of Labor voters wanted a decrease
compared with just two per cent of Labor candidates
As Figure 4 makes clear, with the exception of the Greens, voters for the two major
party groupings, and for the array of minor parties (grouped as ‘other parties’), are
disenchanted with high migration. The gap between most voters and almost all
candidates on this question is large.
Labor candidates hold views that were nearly identical to those of Greens candidates.
Their views were also much closer to Greens voters than to supporters of their own
party.
Figure 4 also shows that people who said that they had voted for one of the minor parties
(more than 18 per cent of the sample) were even more dissatisfied with high migration
than were supporters of the four main parties.
6
Figure 4: ‘The number of migrants allowed into Australia at the present time
has’— by party(%)
70
Labor voters
60
Labour candidates
50
Coalition voters
40
Coalition candidates
30
Greens voters
20
10 Greens candidates
0 Voters for other
Gone much too far and gone Not gone far enough or parties
too far nearly far enough
Source: Australian Election Study (AES), candidates and voters, 2016. Table A.3 in Appendix 1
Note: Voters are grouped by their first preference vote in the House of Representatives in 2016.
The Coalition consists of the Liberal and National parties, the grouping that has formed the government
since 2013.
Why should the candidates be so very different from the voters? The educational
background of parliamentarians suggests that they would be likely to support
immigration and this may help explain the results shown in Figures 3 and 4. In 2016, 87
per cent of Members of the House of Representatives were university graduates as were
76 per cent of Senators.28 This is a massive increase from a mere 15 per cent in 1901 and
a modest 40 per cent in 1980.29
This shift does not, however, prepare us for the overwhelming gulf between candidates
and voters shown in Figure 3. Selection effects, an in-group culture remote from the
average voter, well-heeled lobbyists and a co-dependent relationship with media elites
all contribute to creating an insider class of politicians and their close associates. On the
immigration question they live in a world remote from that of the average voter.
Public debate, public opinion, and silence
While the first reason for the persistence of high migration is political, the second is
social. Beyond the confines of the insider class lies the broader progressive graduate
class where strong norms support ongoing immigration. But norms do not stand alone;
they are buttressed by ignorance. In late 2015 a survey conducted by Sustainable
Population Australia found that most voters knew very little about the dynamics of
population growth, an ignorance shared by most graduates.307
The American scholar, Gary Freeman, argues that voters are ignorant about immigration
because public debate is constrained, reliable data are hard to find and, absent
explanation, hard to interpret.31
Freeman also asserts that scholars too, even if they tend towards mild scepticism, may
judge it prudent to steer clear of topics which could signal this tendency, topics such as
the nexus between demography and the environment. 32 Added to this there is
information stewardship in the media where ‘Journalists decide the acceptable limits of
public discourse and those who veer outside these bounds are ignored or attacked until
they are removed or resign’.33
The costs of discovering information about immigration and its demographic
consequences are high and those who search for it too industriously may court the
stigma of racism. Besides, rather than enabling the spread of information, the
government hides it. For example, as Judith Sloan points out, the planned immigration
numbers were not even mentioned in the 2017-18 budget papers.34
However, recently, as some of the effects of growth have become even more pressing, a
handful of independent commentators have spoken, not just of a conspiracy or a clash of
values, but of a general taboo on questioning high migration.35 Are they right? Does the
stigma attached to harbouring doubts amount to a taboo?
Anecdotal evidence suggests it may. For example, an environmentalist trying to
persuade an ABC team to mention the effects of population growth was told: ‘You’re
trying to get us to break a whole set of small-l liberal non-nos’.36 This was one of the
more polite shut-downs; other would-be censors don’t hesitate to label such questions as
racist.37 If the new commentators are right, an uneasy silence could mean that popular
discomfort with deteriorating quality of life may not translate readily into political
action.
Attitudes to immigration and beliefs about racism
The data collected by the Tapri survey shed light on the existence of a taboo. Question
20 asked ‘Do you think that people who raise questions about immigration being too
high are sometimes thought of as racist?’ Nearly two thirds of Australian voters said
‘yes’, people who question high migration are ‘sometimes thought of as racist’.
Table 1: (Q20) ‘Do think that people who raise questions about immigration being
too high are sometimes thought of as racist?’ by graduate/non-graduate
status %
Q20 Graduate Non-graduate Total
Yes 63 66 65
No 26 25 26
Don’t know 11 9 10
Total % 100 100 100
Total N 777 1290 2067
Note: The questions from the Tapri survey analysed in this paper are included in Appendix 2, as
is a note on the survey’s method.8
But do they think the assumption of racism is warranted? Question 20 was followed by
another (asked only of those who had said ‘yes’). Was the assumption made because
such people ‘usually are racist’, or was it ‘unfair because very few of them are racist’?
Table 2 shows that just under a third of those who had said ‘yes’ thought the assumption
warranted while over two third thought it unfair. However 41 per cent of graduates
thought it warranted: in this sub-group close to half of the graduates thought that people
who questioned high migration were racists. In contrast, 75 per cent of the non-
graduates thought the accusation of racism was unfair.
Table 2: Question 21, following from Q 20 (for those who said ‘yes’), perceptions of
why sceptics are ‘sometimes thought of as racist’, by graduate/non-
graduate status %
Q21 ‘This is—’ Graduate Non-graduate Total
‘Because they usually are racist’ *41 *25 31
‘Unfair because very few of them 59 *75 69
are racist’
Total % 100 100 100
Total N (of those who said ‘yes’) 488 846 1334
*The difference between the sub group and the total of those who said ‘yes’ to Question 20 is significant
at the .05 level.
These two questions were used to construct the ‘free speech variable’ set out in Table 3.
This measures effective free speech as far as immigration, and thus population growth,
are concerned.
Voters who said ‘yes’ to question 20 and who then went on to say that this is ‘because
they usually are racists’ are termed the ‘guardians against racism’. They are likely to feel
morally repelled by people who raise the subject, the people who they believe ‘usually
are racist’.
In turn, immigration sceptics who are aware of this may feel threatened by the prospect
of this repulsion. This is the group who found the assumption of racism unfair. Here
they are termed ‘threatened’. And what of those who said ‘no’, the voters who believe
that sceptics are not usually thought of as racist? Here they are termed the ‘fearless’
while those who simply said they didn’t know are the ‘confused’. How many
respondents are there in each of the categories used to construct the free-speech
variable?
Table 3 shows that overall one fifth can be counted as guardians against racism (and
more than a quarter of graduates). In contrast nearly half the sample may feel threatened
by this attitude (a proportion much higher among non-graduates, but still relatively high
among graduates). The other two categories, the ‘fearless’ and the ‘confused’, show
little difference by graduate status. Figure 5 illustrates the patterns shown in Table 3.9
Table 3: The free speech variable, by graduate/non-graduate status %
Graduate Non-graduate Total Comment
Guardians against *26 16 20 Yes to Q20 and ‘usually are
racism racist’ to Q21
Threatened **37 *49 45 Yes to Q20 and ‘unfair’ to Q21
Fearless 26 25 26 No to Q20
Confused 11 9 10 Don’t know to Q20
Total 100 100 100
Total N 778 1290 2067
*The difference between the sub group and the total is significant at the .05 level.
**The difference between the sub group and the total is significant at the .01 level.
Figure 5: The free speech variable, graduates and non-graduates%
50
Graduates
40 Non-graduates
All voters
30
20
10
0
Guardians Threatened Fearless Confused
against racism
Source: Table 3 above
In all 26 per cent of graduates took the strong moral position that questioning high
migration was usually a manifestations of racism, a position that fits well with the value
set of most progressives.
But does believing that people may be unfairly called racist for questioning high
migration mean that the threatened are themselves deterred from questioning it? All
respondents were asked the next question (question 22): ‘Have you yourself ever felt
uncomfortable about raising questions about immigration, for example with friends or
workmates?’ There were five response categories including: ‘Yes, people can get the
wrong idea about you if you do’.
Figure 6 shows that if voters believe the risk is there they are likely to be deterred by it.
Respondents in the threatened category are much more likely to say ‘Yes, people can get
the wrong idea about if you do’ than are the guardians against racism.10
Figure 6: Question 22: ‘Have you yourself ever felt uncomfortable raising questions
about immigration?’ —Response ‘Yes, people can get the wrong idea
about you if you do’ by the free-speech variable and graduate/non-
graduate status %
45
40
35
30
25
20
15
10
5
0
Source: Table A.4 in Appendix 1
Voters who are threatened by the risk of being accused of racism are much more likely
to say that people can get the wrong idea about you if you question high migration. This
is especially true if they are university graduates. Fewer graduates feel threatened
(Figure 5), but of those who do a higher proportion are reluctant to speak their minds.
Figures 7 shows that the threatened are less likely to want an increase in immigration
and that this is accentuated for non-graduates. It also shows that graduates who are
guardians against racism are much more likely to want an increase than are the
threatened, or indeed the sample as a whole. Figure 8 shows that guardians are also
much less likely to want a reduction. It also shows that, among non-graduates who feel
threatened by the accusation of racism, 75 per want a reduction in the intake. While
graduates who are threatened are more likely to be chary of speaking out, it is the non-
graduates who are threatened who most ardently desire a reduction in immigration.
A majority of voters who are threatened want a decrease in immigration, but they are
unlikely to talk about this. Fear of disapproval may even inhibit their answers to survey
researchers if the research method employed means talking to an actual person (rather
than filling in an anonymous questionnaire).11
Figure 7: Immigration should be ‘increased a little or a lot’, guardians against
racism and the threatened by graduate/non-graduate status %
70 Graduate guardian
60
Non-graduate guardian
50
40 Graduate threatened
30
Non-graduate threatened
20
10
Total sample
0
Increased a lot or a little
Sources: Tables A.5, A.6 and A.7 in Appendix 1
Figure 8: Immigration should be ‘reduced a little or a lot’, guardians against
racism and the threatened by graduate/non-graduate status %
70 Graduate guardian
60
Non-graduate guardian
50
40
Graduate threatened
30
20 Non-graduate threatened
10
Total sample
0
Reduced a litte or a lot
Sources: Tables A.5, A.6 and A.7 in Appendix 1
These findings confirm the supposition that progressive values are especially strong
among the graduate class. These values predispose many of the guardians to condemn
immigration sceptics and lead a relatively high proportion of them to support increases
in the migrant intake. In contrast few of the threatened want an increase, especially those
who are not graduates. But Figure 8 also shows that many graduates are among the large
group who both feel threatened and who want a reduction in the intake.12 Despite their communication skills, graduates who are sceptics may find it harder than non-graduates to raise questions about immigration because their ‘friends and workmates’ are likely to be progressives, some of them quick to condemn sceptics and exclude them.38 Graduates who are sceptics have more resources with which to make their case but can run higher personal risks in doing so. Some time ago Mark Lopez suggested that as well as talking of a ‘chattering class’ among the intelligentsia we should also talk of a ‘whispering class’,39 a sub-group who, though unhappy with continual growth, are wary of coming out. But if they should chance upon a kindred spirit they are relieved to be able to share their discontents in the safe space of the sotto voce. Taken together these findings mean that there is a large constituency for a reduction in the migrant intake. Indeed since the Tapri survey was run two more polls have confirmed this: in April 2018 a News Poll found that 56 per cent of voters thought immigration was too high40 and, in the same month, Essential Research found that 64 per cent of voters thought that ‘immigration over the last 10 years’ had been too high.41 Finding a voice Strong divisions exist within the Australian electorate on the question of immigration- fuelled population growth (and an even stronger division between that electorate and candidates for office). A large part of the difference between groups may be explained by differences in the degree to which voters are impacted by the pressures of growth, and also by differences in the cultural milieux which shape their ideas and support, or threaten, them. This paper documents these divisions and draws on survey data to help explain the continuing silence on the costs of growth. The Tapri survey shows that a substantial majority of voters are aware of the taboo on questioning high immigration. Some of them (the guardians against racism) endorse it, but many are threatened by it. Twenty-seven per cent say they would feel uncomfortable discussing immigration because ‘people can get the wrong idea about you if do’ while a further 17 per cent say they ‘don’t know enough about immigration to discuss it’. This means that 44 per cent of voters are unwilling or unable to participate in a debate either from fear or ignorance. Twenty seven per cent say either that they are ‘okay with things as they are’ or are ‘happy to speak in favour to it’, leaving only 29 per cent ‘happy to speak against it, even if others don’t agree’. Many voters feel intimidated by the taboo but, if all of the threatened are combined with all of the confused, 55 per cent of the electorate is at risk of being silenced or sidelined. While non-graduates predominate among this sidelined category, it also includes many graduates, people who would like to see the number of immigrants reduced but are fearful of speaking out. Bipartisanship and pro-immigration opinion leaders in the media provide few openings for dissent. Silence, fortified by rebuke, keeps the question of a national population policy off the agenda. Douglas Murray writes: In Europe the political class knows that it has done mass immigration against the will of its public. Partly as a result, politicians have done everything they can to disable the public's response mechanisms.42
13

The same may be true of Australia. The political forces smothering debate have been
strong. Dick Smith has made a serious effort to challenge them, as have the Sustainable
Australia Party and Sustainable Population Australia. But it is hard to make headway
against the political class with its blanket of silence. The power of this morally charged
silence is strong. For example, the premier of NSW (Gladys Berejiklian) fears to raise
the topic because doing so ‘may look like racism on her part’, 43 and members of the
public can say ‘you are likely to get hounded out of your job if you have temerity to
attempt to talk about population policy in Australia’.44
Yet the Tapri survey shows that there is substantial disquiet, and not only among the less
well-educated. Many graduates are unhappy. But why have they done so little about it?
The answer lies in the clear finding that asking questions and talking about population
policy court moral disapproval (especially within graduate circles).
Taking a strong stand against racism is a core principle in the progressive identity. And
rightly so. The problem lies in the ill-informed reflex that automatically equates
discontent with high migration with the racism that progressives deplore.
This reflex silences many potential critics and, as far as graduate sceptics are concerned,
carries with it not just the risk of public opprobrium but the risk of exclusion from social
groups that are dear to them. It also gives the growth lobby a licence to enjoy the
benefits its narrow constituency gains from population growth while at the same time
claiming to be on the side of virtue.
Murray says that we have ‘disabled our ability to have a sane public discussion’ and a
sane discussion free from slurs and derision is what we need. Voters need an explicit
population policy with accessible information. They also need responsive politicians.
For the time being the only vehicles for their discontent are the Sustainable Australia
Party, or One Nation, or possibly the Australian Conservatives. These parties are small
and, while they have an impact at the margins, especially One Nation, they are in no
position to win government in the near future. The situation is different for the major
parties which, if one of them chose to respond to the majority of voters, would be in a
winning position.
14

Immigration and public opinion

Appendix 1 Tables

Table A.1: ‘Do you think the number of immigrants allowed into Australia nowadays
           should be reduced or increased?’ by occupation and education, Australian
           Election Study 2016, voters %
                                         Increased     Remain      Reduced Total                             Total
 The number of immigrations should       a little or  about the     a little   %                              N
  be:—                                      a lot    same as it is or a lot

 1 Arts & media professionals, both                     **72               16          **12       100           24
   graduates and non-graduates

 Graduates
 2 Education graduates                                  **49               31          **20       100          130
 3 ICT, design, Engineering, science &                  **47               35          **18       100           97
   transport graduates
 4 Legal, social and welfare, business,                   *34              38          **28       100          265
   HR, marketing, & health graduates
 5 Managers who are graduates                           **42               35          **22       100          193

 Non-graduates
 6 Non-graduate professionals                             30               32            38       100          164
 7 Non-graduate managers                                **15               28          **56       100          227
 8 Community, personal services,                          25               33            42       100          721
   clerical, administrative, & Sales
   workers
 9 Technicians & trades workers,                        **14               31          **55       100          510
   machinery operators, drivers, &
   labourers

 Total sample                                              26              32             42      100         2683

*The difference between the sub group and the total is significant at the .05 level.
** The difference between the sub group and the total is significant at the .01 level.
Source: The 2016 Australian Election Study, voters, data file. Ian McAllister et al.
 The authors of this data file are not responsible for my interpretation
of it.
Note: 352 respondents who were coded ‘other - insufficiently detailed’, ‘Does not apply’ or ‘Item
skipped’ on the occupation variable are not shown here but are included in the total. However 23 who
were missing on either education or occupation are excluded from the total.
15
Table A.2: ‘The number of migrants allowed into Australia at the present time has: gone
much too far, too far, is about right, not gone far enough, not gone nearly far
enough’, candidates and voters, Australian Election Study, 2016 %
Candidates All voters Graduates Non-
graduates
Gone much too far 1 20 10 26
Gone too far 4 19 13 23
Gone much too far or too far 6 40 24 49
About right 34 38 44 34
Not gone far enough 43 16 25 11
Not gone nearly far enough 17 7 8 6
Not gone far enough or nearly far 60 23 33 17
enough
Total % 100 100 100 100
Total N 141 2640 960 1635
Sources: Australian Election Study, 2016, candidates and voters files, Ian McAllister et al.
The authors of these data files are not responsible for my
interpretation of them.16
Table A.3: ‘The number of migrants allowed into Australia at the present time has’—
(Australian Election Study 2016) %
Gone Gone Gone About Not Not Not Total Total
much too much right gone gone gone % N
too far too far nearly far
far far enough far enough
and enough or
gone nearly
too far
far enough
Labor voters 16 17 33 35 22 9 31 100 819
Labor 0 2 2 31 61 6 67 100 54
candidates
Coalition 23 25 47 42 9 2 11 100 1001
voters
Coalition 0 22 22 61 17 0 17 100 18
candidates
Greens 4 4 8 32 37 24 61 100 244
voters
Greens 3 1 4 29 36 30 66 100 69
candidates
Voters for 33 21 54 36 8 1 10 100 467
other parties
Total voters 21 20 40 38 16 6 22 100 2531
Total 1 4 5 34 43 17 60 100 141
candidates
Sources: Australian Election Study, 2016, candidates and voters files. See note of attribution and
disclaimer at Table A.2
Note: Thirty-seven candidates were missing on the immigration question.
Also the number of candidates for the Coalition parties (Liberal, n=13, and National, n=5) is small and,
despite the fact that they are closer to their voters than are Labor candidates to their voters, this finding
cannot be relied on.17
Table A.4: The free speech variable and graduate/non-graduate status by Q22 ‘Have
you yourself ever felt uncomfortable about raising questions about
immigration, for example with friends or workmates?’ %
Yes, I I'm I'm I don't Okay Total Total
people haven't happy happy know plus in % N
can get wanted to to enough favour
the to speak speak about
wrong question against in immigration
idea it; I'm it, even favour to discuss it
about okay if of it,
you if with others even if
you do things don't others
as they agree don't
are agree
Guardian 24 *22 **12 **32 *11 **54 100 199
(grad)
Guardian (non- 23 15 **12 **32 18 **47 100 211
grad)
Threatened **42 11 29 *9 **8 20 100 288
(grad)
Threatened **36 **6 33 **8 17 **15 100 635
(non-grad)
Fearless (grad) *19 **24 36 12 **9 *36 100 204
Fearless (non- **16 10 **47 *9 18 *18 100 325
grad)
Confused **8 19 *16 15 **41 34 100 85
(grad)
Confused **8 18 **15 12 **47 30 100 118
(non-grad)
Total 28 *18 25 16 *13 *35 100 776
Graduates
Total non- 26 *10 31 13 *20 *22 100 1289
graduates
Total sample 27 13 29 14 17 27 100 2066
** The difference between the sub group and the total is significant at the .01 level.
* The difference between the sub group and the total is significant at the .01 level.18
Table A.5: Attitudes to immigration by the free speech variable %
Q5 The number of Guardian Threatened Fearless Confused Total
immigrants should be... against
racism
Increased a lot **15 **3 *5 6 6
Increased a little **25 **6 8 13 11
Increased a lot or a little **40 **8 *14 19 17
Remain about the same as **40 **23 25 **50 29
it is
Reduced a little **10 **26 22 15 21
Reduced a lot **10 **43 *40 17 33
Reduced a little or a lot **20 **69 *62 31 54
Total 100 100 100 100 100
Total N 413 922 531 204 2070
*The difference between the sub group and the total is significant at the .05 level.
** The difference between the sub group and the total is significant at the .01 level.
Table A.6: Attitudes to immigration by the free speech variable, graduates only %
Q5 The number of Guardian Threatened Fearless Confused Total Total
immigrants should be... against graduates sample
racism
Increased a lot ** 3 6 8 8 6
Increased a little **27 9 13 16 15 11
Increased a lot or a **46 12 19 24 24 17
little
Remain about the same *38 30 31 **53 35 29
as it is
Reduced a little **10 25 20 15 19 21
Reduced a lot **5 33 30 **7 22 33
Reduced a little or a lot **16 58 50 **22 **41 54
Total 100 100 100 100 100 100
Total N 201 288 205 86 780 2067
*The difference between the sub group and the total is significant at the .05 level.
** The difference between the sub group and the total is significant at the .01 level.19
Table A.7: Attitudes to immigration by the free speech variable, non-graduates only %
Q5 The number of Guardian Threatened Fearless Confused Total Total
immigrants should be... against non- sample
racism graduates
Increased a lot *12 *3 5 4 5 6
Increased a little **23 **4 *6 10 8 11
Increased a lot or a **35 **7 *10 14 13 17
little
Remain about the same *42 **19 **21 **47 26 29
as it is
Reduced a little **9 *27 23 14 22 21
Reduced a lot **14 **47 **46 24 *39 33
Reduced a little or a **23 **74 **69 *38 **61 54
lot
Total 100 100 100 100 100 100
Total N 212 634 326 118 1290 2067
*The difference between the sub group and the total is significant at the .05 level.
** The difference between the sub group and the total is significant at the .01 level20
Table A.8: Household income by occupation and education, Australian Election Study
2016, voters %
Less $40,001 $80,001 More Total Total
than to to than % N
Occupation $40,001 $80,000 $140,000 $140,001
1 Arts & media 22 39 13 26 100 23
professionals grad & non-
grad
2 Education graduates 9 27 30 35 100 124
3 ICT, design, Engineering, 4 13 45 38 100 93
science & transport
graduates
4 Legal, social and welfare, 8 18 35 39 100 261
business, HR, marketing,
& health graduates
5 Managers who are 5 16 31 48 100 186
graduates
6 Non-graduate 20 34 26 20 100 160
professionals
7 Non-graduate managers 19 30 24 27 100 216
8 Community, personal 28 32 25 14 100 691
services, clerical,
administrative, & Sales
workers
9 Technicians & trades 36 30 23 11 100 486
workers, Machinery
operators, drivers, &
labourers
Total sample 26 27 26 21 100 2540
Source: Australian Election Study, voters, 2016, data file Ian McAllister et al. See note and disclaimer
at Table A.1.
Note: 161 respondents who were missing on income are excluded from the analysis; 109 respondents
missing on occupation, 105 ‘does not apply’ and 86 ‘insufficiently described’ are not analysed separately
but are included in the total.21
Table A.9: Employment sector by occupation and education, 2016 Australian Election
Study, voters %
Self- Employee Employee Employee Total Total
employed in private of Federal in family % N
company / State / business
or Local or farm
Occupation business Govt
1 Arts & media 50 50 0 0 100 24
professionals grad & non-
grad
2 Education graduates 5 43 52 0 100 124
3 ICT, design, Engineering, 7 78 14 0 100 97
science & transport
graduates
4 Legal, social and welfare, 14 48 38 0 100 262
business, HR, marketing,
& health graduates
5 Managers who are 16 53 30 2 100 192
graduates
6 Non-graduate 12 50 37 1 100 159
professionals
7 Non-graduate managers 34 49 14 3 100 225
8 Community, personal 7 68 20 5 100 708
services, clerical,
administrative, & Sales
workers
9 Technicians & trades 19 63 13 5 100 501
workers, Machinery
operators, drivers, &
labourers
Total sample 15 59 23 3 100 2415
Source: Australian Election Study, voters, 2016, data file, see note and disclaimer at Table A.1.
Note: 291 respondents missing on employment sector (ie ‘whom do (or did) you work for’) are excluded
from the analysis; 123 respondents insufficiently detailed or missing on occupation or education are not
analysed separately but are included in the total.22
Table A.10: ‘Do you think the number of immigrants allowed into Australia nowadays
should be reduced or increased?’ by vote in the House of Representatives
2016 and graduate/non-graduate status, Australian Election Study, 2016 %
Increased a Remain Reduced a Total Total N
little or a lot about the little or a lot %
same as it
is
Grad. Liberal 24 **43 *32 100 336
Grad. Labor **50 32 **18 100 302
Grad. Nationals 11 50 39 100 18
Grad. Greens **72 24 **4 100 137
Grad. Other parties 22 32 46 100 152
Total graduates **39 35 **26 100 945
Non-grad. Liberal **15 33 **52 100 571
Non-grad. Labor 23 28 *49 100 520
Non-grad Nationals **7 34 *59 100 68
Non-grad. Greens **56 25 **19 100 108
Non-grad. Other parties **8 28 **64 100 324
Total non-graduates **18 30 **52 100 1591
Total sample 26 32 42 100 2688
* The difference between the sub group and the total is significant at the .05 level.
** The difference between the sub group and the total is significant at the .01 level.
Source: Australian Election Study, 2016, voters, data file. See disclaimer at Table A.1.23
Table A.11: All boats carrying asylum seekers should be turned back, voters by party and
graduate/non-graduate status, and candidates by party %
Strongly Neither Disagree Total % Total
agree & agree nor & strongly N
agree disagree disagree
Labor (graduates) **17 20 **63 100 301
Labor (non-grads) 46 23 32 100 516
Coalition (graduates) *56 23 **21 100 352
Coalition (non-grads) **68 18 **14 100 634
Greens (graduates) **4 **7 **89 100 136
Greens (non-grads) **17 *11 **71 100 105
Voters for other parties (graduates) 47 15 38 100 150
Voters for other parties non-grads) **61 23 **16 100 323
Total graduate voters **35 18 **47 100 939
Total non-grad voters **56 20 **24 100 1578
All voters 48 20 33 100 2671
Labor candidates 17 21 62 100 53
Coalition candidates 88 12 0 100 17
Greens candidates 3 1 96 100 69
All candidates 19 10 71 100 139
*The difference between the sub group and the total is significant at the .05 level.
** The difference between the sub group and the total is significant at the .01 level.
Sources: AES 2016 voters and candidate’ files. See note and disclaimer at Table A.2.
Notes: Tests of significance are not appropriate for the candidates’ data as they are not based on
a random sample
Eighty-nine voters were missing, either on the party they voted for in 2016 or on their views on
asylum seekers by boat. Forty-three candidates are missing on asylum seekers arriving by boat24 Appendix 2 Tapri survey method The survey ran from Monday 31 July 2017 to 17 August 2017. Questions were chosen, and the analysis done, by Tapri: the field work was done online by The Online Research Unit. They collected data from a random national sample of 2067 drawn from an online panel of 300,000 people. The survey was restricted to voters. Quotas were set with a 10% leeway in line with the ABS distribution for age, gender and location, including a boost of a minimum n=100 in NT, ACT and TAS. The final data were then weighted to the actual age, gender, and location distribution according to the ABS Census. Participants were offered points as token rewards (these could be used to gain access to a cash raffle, or taken as a $1 payment, or donated to charity). The survey took approximately ten minutes for them to complete. A note on Internet panel surveys Internet panel surveys are used increasingly today, partly because the proportion of households with fixed-line phones has decreased. As of December 2014, 29 per cent of Australian adults had no fixed-line telephone at home, so only 71 per cent did have such a phone. There is the further problem that many of the 71 per cent are not prepared to respond to phone surveys. In contrast, as of 2014-15, 86 per cent of households had Internet access.45 By 2017 response rates to telephone polls in the United States had sunk to nine per cent.46 Industry sources say that in Australia phone surveys using Robo calls have response rates as low as two or three per cent. Today in Australia, among the major polling companies, only Ipsos and Morgan continue to rely on telephone surveys.47 The others have switched to internet panel polling often combined with Robo phone calls. This includes Newspoll which made the change with little fanfare in June 2015.48 Critics of Internet panel surveys say that, because they are only partly based on probability sampling, they lack theoretical credibility. Their supporters say that some of them have proved their reliability and validity in practice.49 For example YouGov in the UK is dependent on internet panel surveys. It is now well established and has had success in predicting election outcomes.50 Essential Research in Australia is fully reliant on random samples drawn from internet panels and has become an accepted part of the political landscape. One test of external validity is the degree to which an internet panel survey matches known characteristics of the population it claims to reflect. In the case of voter support for major parties, the Tapri findings on voting intentions (Coalition 32%, Labor 34%, Greens 9% and One Nation 10%) are not far off from those of current Newspolls. These of course are now also based on internet panels, though supplemented by Robo calls, but are generally regarded as the gold standard in Australian political polling.
25

Questions from the Tapri survey analysed in this paper

5 Do you think the number of immigrants allowed into Australia nowadays should be
  reduced or increased?

 (1) increased a   (2) increased a   (3) remain about    (4) reduced a       (5) reduced a lot
       lot               little      the same as it is        little
       []                  []               []                  []                 []

15 From December 2005 to December 2016 Australia’s population grew from 20.5
   million to 24.4 million; 62% of this growth was from net overseas migration.

  Do you think Australia needs more people?
   (1) Yes          [ ] [Go to question 16]
   (2) No           [ ] [Go to question 17]

20 Do think that people who raise questions about immigration being too high are
   sometimes thought of as racist?

    (1) Yes            [ ] [Go to question 21]
    (2) No             [ ] [Go to question 22]
    (3) Don’t know     [ ] [Go to question 22]

21 This is—

    (1) Because they usually are racist            []
    (2) Unfair because very few of them are racist [ ]

22 Have you yourself ever felt uncomfortable about raising questions about immigration,
   for example with friends or workmates?

    (1) Yes, people can get the wrong idea about you if you do.                         []
    (2) I haven’t wanted to question it; I’m okay with things as they are.              []
    (3) I’m happy to speak against it, even if others don’t agree                       []
    (4) I’m happy to speak in favour of it, even if others don’t agree.                 []
    (5) I don’t know enough about immigration to discuss it.                            []
26
Notes
1
The method for calculating NOM changed in 2006. This had the effect of increasing the numbers of net
overseas migrants recorded. However the change in method only accounts for annual increases of
19,000 to 25,000. B. Birrell and E. Healy, ‘Net overseas migration: why is it so high?’, People and
Place, 18, 2, pp. 56-65
From June 2007 to June 2017 the average recorded NOM was 222,400 p.a., compared to an average of
100,100 p. a. between June 1981 and June 2006. Thus the 2007 to 2017 figures show an average
increase of 122,300 p.a., far more than could be explained by the change in methodology.
2
In 2015-16 74 per cent of net overseas migrants settled in either New South Wales or Victoria, which in
effect means Sydney or Melbourne. Calculated from Australian Bureau of Statistics,
34120DO007_201516 Migration, Australia 2015-16 (11 October 2017). See also Ben Schneiders and
Royce Millar, ‘How a booming population is eroding Melburnians’ standard of living’, The Age, 1 July
2017, p. 1; Sean Nicholls, ‘We’re full, says Sydney’, The Sydney Morning Herald, 9 October 2017, p.
1; Judith Sloan, ‘We’re squeezing the life out of our cities’, The Australian, 8 August 8 2017, p. 12.
3
Future Cities: Planning for our growing population, Infrastructure Australia, 2018, p. 21
4
Katharine Betts and Michael Gilding, ‘The growth lobby and Australia’s immigration policy’, People
and Place, 2006, vol. 14, no. 4, pp. 40-52
5
See Judith Sloan, ‘A conspiracy exists to allow high immigration rates’, The Australian, 24 February
2018, p. 22; Tony Abbott, ‘How cheap shots become own goals’, The Australian, 23 February 2018, p.
4.
6
Judith Sloan, ‘Big-immigration fan club is devoted to growth myths’, The Australian, 21 November
2017, p. 12
7
‘[I]mmigration and population policy have been taboo topics for far too long’, Editorial, ‘Mr Abbott’s
agenda’, The Spectator Australia, 27 January 2018 p. i
8
See Table A.10, on attitudes to immigration by vote in the 2016 election, in Appendix 1.
9
Katharine Betts and Bob Birrell, ‘Australian voters’ views on immigration policy’, The Australian
Population Research Institute, Melbourne, 2017
10
See Judith Sloan, ‘A conspiracy exists to allow high immigration rates’, The Australian, 24 February
2018, p. 22.
11
Thomas Piketty, ‘Brahmin left vs merchant right: rising inequality & the changing structure of
political conflict (Evidence from France, Britain and the US, 1948-2017)’, World Inequality Database,
2018
12
See Paul Kelly, ‘Grievance culture invites a backlash’, The Australian, 28 January 2017, pp. 15, 17
13
Peter Dutton said ‘The advice I have is that out of the last 33 people who have been charged
with terrorist-related offences in this country, 22 of those people are from second and third
generation Lebanese-Muslim backgrounds’. accessed 28/4/2018
14
See Paul Bongiorno, ‘Peter Dutton’s racism to the bottom’, The Saturday Paper, 26 November-2
December 2016, accessed 28/4/2018; Omar Bensaidi, ‘Peter Dutton did not
appear out of thin air. He represents consistent Australian policy’, The Guardian, 30 November 2016
accessed 28/4/2018; Julia Calixto and Robert Burton-
Bradley, ‘“What Mr Dutton said was racist”: Lebanese Muslims outraged over Immigration Minister’s
comments’, SBSNews, 22 November 2016
15
Paul Kelly, ‘Grievance politics take root and are set to intensify’, The Australian, 15 November 2016,
pp. 15, 18
16
See Katharine Betts, The Great Divide: Immigration politics in Australia, Duffy and
Snellgrove, Sydney, 1999, pp. 256-266, 283, 290-299, 316-320.27
17
The Tapri survey found that 54 per cent of voters who wanted an increase in immigration
opposed the government’s policy on turning back the boats while 77 per cent of those who
wanted a decrease supported the policy. These differences were significant at the .01 level.
18
Greg Jericho, ‘It’s easier for Tony Abbott to attack migration than admit his own policies are to blame’,
The Guardian, 24 February 2018
19
See David Marr, ‘The White Queen: One Nation and the politics of race’, Quarterly Essay, 2017, 65,
pp. 7, 55, 88; Leith Van Onselen, ‘Greens shut down population debate’, MacroBusiness, 30 August
2016
20
See Alvin Gouldner, The Future of Intellectuals and the Rise of the New Class, Seabury Press, New
York, 1979, pp. 19-27; David Goodhart, The Road to Somewhere: The Populist Revolt and the Future
of Politics, London, 2017, pp.119, 121,150-159, 167, 177 and passim; David Goodhart, The British
Dream: Success and Failures of Post-War Immigration, Atlantic Books, London, 2013, pp. xxv, 10,
170,199-205, 250-257; J. C. Williams, White working class: overcoming class cluelessness in America,
Harvard Business Review Press (Kindle edition), Boston Massachusetts, 2017.
21
This applies especially to graduates who vote Labor or Greens and to the candidates who stand
for these parties. See Table A.11 in Appendix 1.
22
Katharine Betts, ‘People and parliamentarians: the great divide’, People and Place, 2004, vol. 12, no.
2, pp. 64-83; Katharine Betts, ‘Boatpeople and public opinion in Australia’, People and Place, 2001,
vol. 9, no. 4, pp. 34-48
23
The term ‘thought leaders’ is taken from Chris Mitchell, ‘Matters of national importance
deserve a better response’, The Australian, 22 January 2018, p. 22. His context was the
dismissive reaction of some progressives to Melbourne’s African crime gangs.
24
See Katharine Betts, ‘Cosmopolitans and patriots: Australia’s cultural divide and attitudes to
immigration’, People and Place, 2005, vol.13, no. 2, pp. 29-40 ; Betts, 2004, op. cit. The split between the highly educated
and others in Europe and the UK on questions such as immigration is described in detail in Mark
Bovens and Anchrit Wille, Diploma Democracy: The Rise of Political Meritocracy, Oxford University
Press, Oxford, 2017.
25
Tapri borrowed this question from the Australian Election Study (AES) which has used it in
its election studies for many years. The ‘immigration has gone too far ...’ question shown in
Figures 3 and 4 is used here because it was the only immigration question that the AES asked
of both voters and candidates in 2016.
26
The group consists of 3 actors, dancers and other entertainers, 2 music professionals, 3 visual
arts and crafts professionals, 3 artistic directors, and media producers and presenters, 4 authors,
and book and script editors, 5 film, television, radio and stage directors, and 5 journalists and
other writers.
27
Ian McCalister et al., Australian Election Study, candidates and voters files, 2016
The authors of these data files are not responsible for my
interpretation of them. The question illustrated in Figures 3 and 4 is different from the one in
Figure 2 because the former was only asked of voters and not of candidates.
28
Nick Eversed, Ri Lu and Anna Livsey, ‘Are you reflected in the new parliament?’, The
Guardian, Australia accessed 3 March 2018
29
See ‘The 43rd Parliament: traits and trends’ 2 October 2013
30
Katharine Betts, ‘Voters’ attitudes to population growth in Australia’, Results of a survey
conducted for Sustainable Population Australia, 2015 (December)
The survey
included four basic questions on Australian demography. Only two per cent of the sample of
1230 were able to answer all four correctly and 13 per cent were not able to answer any.
31
Gary Freeman, ‘Modes of immigration politics in liberal democratic states’, International MigrationYou can also read