Impact of climate model resolution on soil moisture projections in central-western Europe - HESS
←
→
Page content transcription
If your browser does not render page correctly, please read the page content below
Hydrol. Earth Syst. Sci., 23, 191–206, 2019
https://doi.org/10.5194/hess-23-191-2019
© Author(s) 2019. This work is distributed under
the Creative Commons Attribution 4.0 License.

Impact of climate model resolution on soil moisture
projections in central-western Europe
Eveline C. van der Linden, Reindert J. Haarsma, and Gerard van der Schrier
Royal Netherlands Meteorological Institute, De Bilt, Netherlands

Correspondence: Eveline C. van der Linden (linden@knmi.nl)

Received: 25 April 2018 – Discussion started: 23 May 2018
Revised: 20 December 2018 – Accepted: 23 December 2018 – Published: 15 January 2019

Abstract. Global climate models project widespread de-             1   Introduction
creases in soil moisture over large parts of Europe. This pa-
per investigates the impact of model resolution on the magni-      Global climate models project that global aridity over land
tude and seasonality of future soil drying in central-western      will increase in response to anthropogenic climate warm-
Europe. We use the general circulation model EC-Earth to           ing (Feng and Fu, 2013; Scheff and Frierson, 2015; Huang
study two 30-year periods representative of the start and end      et al., 2016). Nevertheless, there remains considerable un-
of the 21st century under low-to-moderate greenhouse gas           certainty concerning regional trends in soil moisture (Greve
forcing (RCP4.5). In our study area, central-western Europe,       and Seneviratne, 2015; Greve et al., 2017). Soil drying is a
at high spatial resolution ( ∼ 25 km) soil drying is more se-      result of complex interactions between the land surface and
vere and starts earlier in the season than at standard reso-       the atmosphere (Seneviratne et al., 2006; Hirschi et al., 2011;
lution (∼ 112 km). Here, changes in the large-scale atmo-          Seneviratne et al., 2010). Anthropogenic climate change ex-
spheric circulation and local soil moisture feedbacks lead         pectedly enhances global mean evaporation and precipitation
to enhanced evapotranspiration in spring and reduced pre-          due to the larger moisture demand of the atmosphere with
cipitation in summer. A more realistic position of the storm       higher air temperatures (Feng and Fu, 2013; Scheff and Frier-
track at high model resolution leads to reduced biases in          son, 2014). However, the net impact of these increases on
precipitation and temperature in the present-day climatol-         land aridity and droughts remains difficult to predict (Sher-
ogy, which act to amplify future changes in evapotranspi-          wood and Fu, 2014). Projections of soil moisture in Europe
ration in spring. Furthermore, in the high-resolution model        for the 21st century indicate pronounced soil drying and an
a stronger anticyclonic anomaly over the British Isles ex-         associated increase in drought area and intensity, but these
tends over central-western Europe and supports soil drying.        changes are strongly dependent on season and location (Ru-
The resulting drier future land induces stronger soil mois-        osteenoja et al., 2018; Samaniego et al., 2018). Regionally,
ture feedbacks that amplify drying conditions in summer. In        future changes in evaporation over land will depend on the
addition, soil-moisture-limited evapotranspiration in summer       local soil moisture content and surface characteristics, but
promotes sensible heating of the boundary layer, which leads       also on changes in available energy, wind speed, air temper-
to a lower relative humidity with less cloudy conditions, an       ature, and air humidity. At the same time, changes in pre-
increase in dry summer days, and more incoming solar radia-        cipitation are spatially variable between different future pro-
tion. As a result a series of consecutive hot and dry summers      jections, leading to enhanced uncertainty at regional spatial
appears in the future high-resolution climate. The enhanced        scales (Kumar et al., 2013). How these processes will change
drying at high spatial resolution suggests that future pro-        under climate warming in individual regions is highly un-
jections of central-western European soil drying by CMIP5          certain, whereas reliable regional information is essential for
models have been potentially underestimated. Whether these         adaptation planning.
results are robust has to be tested with other global climate         A frequently used approach to study land aridity or
models with similar high spatial resolutions.                      droughts is to use off-line computed indices, for example, the
                                                                   aridity index (the ratio of potential evaporation to precipita-

Published by Copernicus Publications on behalf of the European Geosciences Union.
192                            E. C. van der Linden et al.: Impact of resolution on projections of soil moisture projections

tion) or the prominently used Palmer drought severity index        Also, local-scale land-surface–atmosphere feedbacks related
(PDSI) (Palmer, 1965). However, recent studies show that           to soil moisture are arguably dependent on model resolu-
these metrics often overestimate future increases in drought       tion (Lorenz et al., 2016). Using high-resolution simulations
and decreases in water availability (Roderick et al., 2015;        could thus improve our physical understanding and provide
Milly and Dunne, 2016; Swann et al., 2016). Swann et al.           potentially better estimates of future changes in soil drying.
(2016) and Berg et al. (2017) argue that projections of fu-        This will lead to enhanced confidence in future soil moisture
ture aridity should therefore be based on direct output of the     projections at a regional level.
simulated land water balance (precipitation, evapotranspira-          Motivated by these studies, this paper investigates for
tion, runoff, and soil moisture) rather than on off-line aridity   central-western Europe the consequences of climate warm-
metrics.                                                           ing for the regional hydrology with a high-resolution global
   Various studies have used direct model output to assess         climate model. To investigate the role of resolution we have
future changes in aridity. Studying a wide range of climate        repeated the experiment and analyses at standard CMIP5
states, Greve et al. (2017) and Scheff et al. (2017) con-          resolution for the same climate model. The use of a single
clude that future projections depend largely on the physical       high-resolution model allows us to put emphasis on mecha-
quantity that is used as a measure of aridity. Climate model       nistic explanations for the differences in regional hydrolog-
simulations of the Coupled Model Intercomparison Project           ical changes between model resolutions. We assess the role
(CMIP5) (Taylor et al., 2012) project a decline in the up-         of local feedbacks and the large-scale circulation on the re-
per 10 cm soil moisture content over most of Europe (Zhao          sponse of regional soil moisture storage to climate warming.
and Dai, 2015). However, Berg et al. (2017) state that soil        The study area in central-western Europe comprises a rela-
moisture changes near the surface are more negative than           tively small region and is therefore riddled with large inter-
total column soil moisture changes and can even be of op-          model differences in future hydrological projections. While
posite sign in middle- and high-latitude regions. Using the        most studies focus on annual mean changes, our analysis fo-
same suite of models but including the entire soil moisture        cusses on warm-season months (April–September). Further-
profile in their analyses, Orlowsky and Seneviratne (2013)         more, we will analyse changes in the total soil moisture col-
indicate a large inter-model spread over central-western Eu-       umn, which are most relevant for water availability and have
rope, with drought projections ranging from pronounced dry-        been shown to exhibit large inter-model uncertainty in future
ing to wetting conditions. Therefore the vertical distribution     drying over central-western Europe in standard-resolution
of drying should be taken into account when studying future        GCMs (Orlowsky and Seneviratne, 2013; Berg et al., 2017).
soil drying and water availability. Focusing on seasonality of        The present paper is outlined as follows. Section 2 presents
soil drying, Ruosteenoja et al. (2018) show that summer and        the data, methods, and a validation of the present-day cli-
autumn exhibit strong drying trends in central and western         mate. Section 3 describes the simulated soil drying charac-
Europe, while all-season drying occurs in southern Europe.         teristics, including climate- and resolution-induced changes
This emphasises the necessity to study seasonal instead of         in its spatial distribution and seasonal cycle. The drivers of
annual mean values for future drying.                              central-western European soil drying and resolution-induced
   Orlowsky and Seneviratne (2013) indicate that by the end        differences are presented in Sect. 4. Here, the land surface
of the 21st century, model formulation of global climate           water balance components and their interaction with the sur-
models (GCMs) will become the dominant source of spread            face energy balance are examined in detail. Also, the ef-
in drought projections, especially for soil moisture drought       fect of changes in the large-scale atmospheric circulation is
and at the regional scale. This suggests that improvements in      studied. Thereafter, Sect. 5 briefly describes climatic impacts
GCMs could considerably reduce the inter-model spread in           that are closely related to soil drying, including soil moisture
future soil moisture projections. Several studies have shown       droughts, warm extremes, and dry days. Finally, Sect. 6 con-
that high-resolution (∼ 25 km horizontal resolution) GCMs          tains a summary and conclusions.
mimic the present-day climate state more realistically than
standard-resolution models, since they resolve physical pro-
cesses more explicitly (Delworth et al., 2012; Jung et al.,        2     Data and methods
2012). Therefore, high-resolution simulations are generally
expected to be more reliable in their representation of fu-        2.1    Model and experimental setup
ture climatic changes. For example, post-tropical cyclones
and mid-latitude storm tracks that bring precipitation towards     This study is based on high-resolution climate model simu-
Europe could change their path in a future climate and are de-     lations that were also used in previous studies to assess the
pendent on model resolution (Baatsen et al., 2015; Willison        impact of high resolution on several climatic processes (e.g.
et al., 2015). Furthermore, atmospheric blocking frequencies       Haarsma et al., 2013; Baatsen et al., 2015). The simulations
(Jung et al., 2012; Berckmans et al., 2013) and atmospheric        were carried out using the EC-Earth V2.3 model (Hazeleger
moisture transport from the ocean to the continents (Demory        et al., 2012) at a resolution of T799L91 (∼ 25 km horizontal
et al., 2014) are better represented at finer model resolution.    resolution, 91 vertical levels), which was the operational res-

Hydrol. Earth Syst. Sci., 23, 191–206, 2019                                       www.hydrol-earth-syst-sci.net/23/191/2019/
E. C. van der Linden et al.: Impact of resolution on projections of soil moisture projections                                    193

olution at the European Centre for Medium-Range Weather              ESSEL in the Transdanubian region in Hungary by Wipfler
Forecasts (ECMWF) from February 2006 until January 2010.             et al. (2011) reveals that HTESSEL slightly underpredicts the
Different model runs were performed for the present-day              seasonal evaporative fraction compared to satellite estimates.
(2002–2006, final years of historical CMIP5 run) and fu-             The underestimation is most prominent for low evaporative
ture (2094–2098) climate. Each of these datasets consists of         fractions with a maximum prediction error of 30 % for indi-
a 6-member ensemble spanning 5 years with perturbed ini-             vidual grid cells.
tial conditions, resulting in a 30-year dataset for each cli-
mate state. In the present-day simulations, observed green-          2.3   Observations and validation
house gas and aerosol concentrations were applied, while fu-
ture concentrations were derived from the RCP4.5 scenario            To gain some confidence in the model performance we have
(Van Vuuren et al., 2011). Sea surface temperatures were im-         validated the present-day climate over central-western Eu-
posed using daily data at 0.25◦ horizontal resolution from           rope. This is done for simulated present-day precipitation
NASA (Reynolds et al., 2007) for the 2002–2006 period.               and near-surface air temperature. The latter is used instead of
The sea surface temperatures for the future were calculated          evapotranspiration since observations of evapotranspiration
by adding the projected ensemble mean change using the               are scarce and air temperature mainly determines the evapo-
17 members of the coupled climate model ECHAM5/MPI-                  rative demand of the atmosphere. For the validation we have
OM in the ESSENCE project (Sterl et al., 2008) under the             used the observational E-OBS gridded dataset (0.5◦ horizon-
SRES A1B emission scenario (Nakicenovic, 2000). This sce-            tal resolution; version 11.0) for precipitation and 2 m temper-
nario is compatible with the RCP4.5 scenario but the me-             ature. The E-OBS data originated from the EU-FP6 project
dian global temperature increase by the end of the 21st cen-         ENSEMBLES (Haylock et al., 2008) and is now maintained
tury is about 1 ◦ C smaller (Rogelj et al., 2012). Further de-       and updated by the data providers in the ECA&D project.
tails on model setup and spin-up procedures can be found in          The dataset is based on meteorological station measurements
Haarsma et al. (2013) and Baatsen et al. (2015). The sim-            and is designed to provide the best estimate of grid box
ulations were repeated at the standard CMIP5 resolution of           averages to enable direct comparison with climate models.
T159L62 (∼ 112 km horizontal resolution, 62 vertical levels)         The period used to compare the observational E-OBS data
for the same climate model configuration. The generated data         against EC-Earth simulations is 1982–2011. This period cov-
have been stored on five pressure levels (850, 700, 500, 300,        ers 30 years to make a robust comparison of the climatology.
and 200 hPa) at 6-hourly intervals, while surface fields have           Figure 1a and b show the annual cycle of precipitation
been saved on a 3-hourly basis.                                      and near-surface air temperature over the analysis domain
                                                                     (the black box in Fig. 2) for E-OBS observations and the
2.2   Land surface scheme                                            EC-Earth model simulations at high and standard resolution.
                                                                     Precipitation biases of present-day climate simulations show
The land surface scheme plays a central role in simulating           that it is too wet over the study region (Fig. 1c). As discussed
soil moisture changes. The land surface scheme used in EC-           in Van Haren et al. (2015b) this is due to a too-zonal position
Earth is HTESSEL (Balsamo et al., 2009). Up to six tiles             of the storm track over the east Atlantic Ocean and western
are present over land (i.e. bare ground, low and high vege-          Europe. This is a common bias in CMIP3 and CMIP5 mod-
tation, intercepted water, and shaded and exposed snow) and          els (Haarsma et al., 2013; Van Ulden et al., 2007). The wet
two over water (i.e. open and frozen water), with separate           bias is reduced in the high-resolution version of EC-Earth
energy and water balances. Considering the water balance,            primarily due to a less zonal orientation of the storm track
precipitation is initially collected in the interception reservoir   (Van Haren et al., 2015b).
until it is saturated. Then, excess precipitation is partitioned        Surface air temperature biases show that the T159 ver-
between surface runoff and infiltration into the soil column.        sion is a bit too cold compared to observations (Fig. 1d),
The ratio of runoff to precipitation depends on the terrain          whereas T799 is somewhat warmer, especially in summer.
complexity represented in the grid cell as well as on the soil       The warmer temperature is associated with the less zonal ori-
texture and soil moisture content. The vertical discretization       entation of the storm track which makes the summer climate
of the land surface scheme considers a four-layer soil that          less maritime and more continental. The high-resolution sim-
can be covered by a single layer of snow. The depths of the          ulations thus perform better with respect to the E-OBS pre-
soil layers are in an approximate geometric relation (0.07 m         cipitation and temperature data than the standard-resolution
for the top layer and then 0.21, 0.72, and 1.89 m for the lay-       model. We shall see later that this contributes to enhanced
ers underneath). HTESSEL does not include river routing.             future drying at high resolution.
Instead, runoff is collected in pre-defined river basins and
distributed instantaneously into ocean points near the outlets       2.4   Definitions
of major rivers, without considering delayed river transport.
At both model resolutions all soil and vegetation character-         Throughout this paper we quantify the intensity of soil drying
istics of HTESSEL are kept constant. An evaluation of HT-            by the soil moisture anomaly (S 0 ). To compute this aridity

www.hydrol-earth-syst-sci.net/23/191/2019/                                           Hydrol. Earth Syst. Sci., 23, 191–206, 2019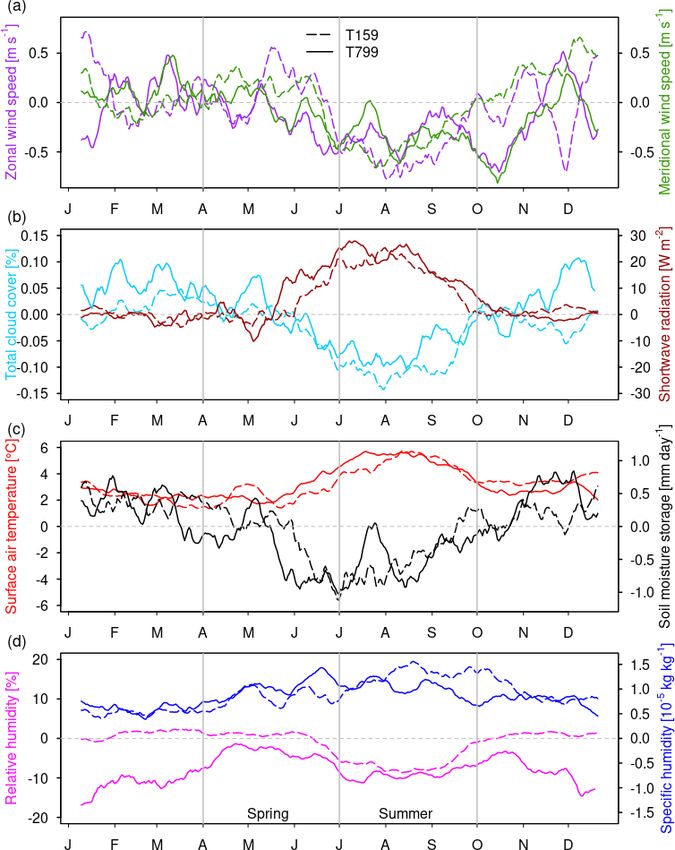
194                             E. C. van der Linden et al.: Impact of resolution on projections of soil moisture projections

Figure 1. Annual cycle of observed (grey) and simulated (blue) (a) precipitation and (b) daily mean near-surface air temperature at T159
(dashed) and T799 (solid) resolution for the present-day climate. Annual cycle of biases of (c) precipitation and (d) daily mean near-surface
air temperature with respect to observations. Values are smoothed with a 20-day running mean filter and averaged over central-western
Europe. The letters on the horizontal axis correspond with the first day of each month (based on a year with 365 days).

metric, first the soil moisture content (S) is computed from                Drought frequency (f ) is defined as the percentage of
integrating volumetric soil moisture content (θ ) over the total         months with soil moisture anomalies below the drought
soil profile in the land surface scheme:                                 threshold value. To measure the impact of resolution on the
     Z                                                                   frequency of future droughts we define the resolution factor
S = θ dz.                                                    (1)         (RF). RF is defined as the ratio of frequency of droughts in
                                                                         T799 (fT799 ) to T159 (fT159 ):
For comparison of soil moisture in the present and future cli-                   fT799
mates, the present climatology of soil moisture content av-              RF =          .                                                 (3)
                                                                                 fT159
eraged over all ensemble members (S0 ) is used to compute
soil moisture anomalies in both the current and future cli-              Also computed is the corrected resolution factor (CRF) to
mate. For each ensemble member and year, anomalies of soil               correct for differences in the present-day climate between
moisture content (S 0 ) are computed for each grid point by              T159 and T799. CRF is defined similarly to RF but uses the
subtracting S0 from the simulated soil moisture content:                 threshold values of the T159 present-day climate to compute
                                                                         the frequency of future droughts at T799 resolution. If CRF
S 0 = S − S0 .                                                  (2)      and RF are significantly different, this means that differences
Threshold values for soil moisture droughts are based on                 in the present-day soil moisture climatology could partly ex-
distributions of monthly-mean soil moisture anomalies for                plain differences in the frequency of projected droughts.
the present climate consisting of 30 years of data. They are
computed per month, considering each individual year as                  3     Soil moisture projections
independent. Seasonal threshold values are based on three-
monthly averages. For each grid cell, droughts are classified            3.1    Horizontal distribution and analysis domain
to be 6/30 year events, corresponding to the 20th percentile
of the S 0 distribution. As a result, by definition, for the cur-        Spring (April–June) and summertime (July–September)
rent climate each land surface grid cell is in drought for each          maps of future soil moisture anomalies for the high-
individual month for 20 % of the sampling years.                         resolution model are shown in Fig. 2a and b, respectively.

Hydrol. Earth Syst. Sci., 23, 191–206, 2019                                                www.hydrol-earth-syst-sci.net/23/191/2019/
E. C. van der Linden et al.: Impact of resolution on projections of soil moisture projections 195
Figure 2. Top: soil moisture content (m) climate change signal (future–present) in Europe for (a) spring and (b) summer in the high-resolution
model. Bottom: (c–d) same but for difference in climate change signal between the high- and standard-resolution model.
These seasonal definitions are slightly different from the Netherlands and Belgium, which are situated in the lower
common definition and chosen to focus on relevant physi- part of the Rhine–Meuse delta. Consumable water, shipping,
cal processes that will be discussed later in this paper. Dif- irrigation, and cooling of power plants all depend on suffi-
ferences in the climate change signal between the high- and cient water supply from the Rhine–Meuse basin and could
standard-resolution simulations are also depicted (Fig. 2c– be affected by water depletion.
d). Both model resolutions simulate strong increases in fu-
ture spring- and summertime drying over large parts of 3.2 Seasonal cycle and vertical distribution
the Mediterranean, especially in southeastern Europe. This
broad change pattern in EC-Earth is similar to other CMIP5 Soil moisture content over central-western Europe exhibits a
model simulations (Zhao and Dai, 2015). Furthermore, in large annual cycle and reaches its minimum value in Septem-
the high-resolution model a new drought-prone area emerges ber (Fig. 3a). Note that these values depend on the soil depth
that is located over central-western Europe, roughly coincid- of the land surface scheme, and therefore are model depen-
ing with the area stretching from southwestern Germany into dent. For the present-day (baseline) climates, there are no
Poland and the northern Balkans. This region experiences significant resolution-dependent differences in monthly soil
more severe drying in future in the high resolution than in moisture content values, except for March. The projected
the standard-resolution simulations. Model resolution seem- changes in soil moisture content are, however, strongly sea-
ingly plays an important role for projections of future soil son and resolution dependent. At both resolutions, the ampli-
drying over central-western Europe. tude of the annual cycle is larger in the future climate than in
This partly motivates our choice for the study region in the present-day climate due to drier soils around the annual
central-western Europe, defined as the area between 47 and soil moisture minimum.
52◦ N and between 5 and 10◦ E (black box in Fig. 2), which Figure 4 depicts monthly volumetric soil moisture anoma-
roughly encompasses the Rhine–Meuse drainage basin and lies over the four soil layers of HTESSEL under 2100 condi-
partly overlaps with the region studied by Van Haren et al. tions, with respect to the current climate. At standard resolu-
(2015a). The choice for this region is further motivated by tion, future soil moisture reduction is mainly confined to late
the importance of this area for the fresh water supply to the summer and autumn. An almost full recovery of soil moisture
occurs in late winter for top soil layers, and in late spring for
www.hydrol-earth-syst-sci.net/23/191/2019/ Hydrol. Earth Syst. Sci., 23, 191–206, 2019196 E. C. van der Linden et al.: Impact of resolution on projections of soil moisture projections
Figure 3. Annual cycle of (a) soil moisture content, (b) runoff, (c) precipitation, and (d) actual evapotranspiration. Values are smoothed with
a 20-day running mean filter and averaged over central-western Europe. The letters on the horizontal axis correspond with the first day of
each month (based on a year with 365 days).
deeper layers. On the other hand, high-resolution simulations the evaporative demand of the atmosphere. We study mean
exhibit year-round soil moisture depletions compared to the changes in the land surface water balance in Sect. 4.1, which
climate at the start of the 21st century. At high resolution, the includes precipitation and evapotranspiration as important
soil moisture content over the top three soil layers of HTES- factors. The water balance provides more information on the
SEL is restored to its former state in late winter, but the soil drivers of soil drying. In the last two subsections, the focus
in the fourth layer remains drier than current values, suggest- is on mechanistic explanations for mean changes in the land
ing a year-round reduction in ground water. The reduced soil surface water balance. These explanations are separately dis-
moisture is compatible with lower year-round runoff values cussed for spring in Sect. 4.2 and summer in Sect. 4.3. The
(Fig. 3b). discussion includes local feedback mechanisms as well as
As a result, in late spring (April–June), future soil moisture large-scale processes.
content (Fig. 3a) differs significantly from present-day val-
ues at high model resolution (S 0 = −45 mm) whereas there 4.1 Land surface water balance
is no significant change at standard model resolution (S 0 =
−6 mm). At the start of summer, the soil is thus precondi- The land surface water balance gives more information on
tioned towards drier conditions in T799 than in T159. Fur- the drivers of soil moisture changes:
thermore, future late summer (July–September) soil moisture
depletion is on average more severe in T799 (S 0 = −90 mm) dS/dt = P − E − Q. (4)
than in T159 (S 0 = −50 mm) (Welch t test: p = 0.01). The
Here, soil moisture storage (dS/ dt) is the change in soil
more severe soil dessication in late spring at high resolution
moisture content over time, P is precipitation, E is evapo-
is thus maintained throughout the late summer months. In the
transpiration, and Q is runoff. Since we focus on the warm
rest of the paper we therefore focus on the modelled differ-
season months and choose our study region outside moun-
ences in late spring (preconditioning phase) and late summer
tainous regions, ice and snow can be neglected in the land
(maintenance phase). For brevity, from now on we will refer
surface water balance. To study climate-induced changes in
to “spring” for the period April to June and “summer” for the
more detail, the land surface water balance can also be writ-
period July to September.
ten in terms of mean future changes, linking future changes
in storage (dS 0 / dt) to changes in water fluxes (P 0 , E 0 , Q0 ).
4 Drivers of soil moisture changes Figure 5 shows on the left the average future changes in soil
moisture storage compared to the current climate from April
Under similar soil and vegetation properties, changes in to September. On the right the contributions of P 0 , E 0 , and
soil moisture content depend largely on precipitation and Q0 to the changes in dS 0 / dt are depicted.
Hydrol. Earth Syst. Sci., 23, 191–206, 2019 www.hydrol-earth-syst-sci.net/23/191/2019/E. C. van der Linden et al.: Impact of resolution on projections of soil moisture projections 197 Figure 4. Profile of future volumetric soil moisture monthly changes (θ 0 ) under 2100 conditions with respect to the present-day climatology over central-western Europe for standard and high spatial resolution. Figure 5. (a) Monthly changes in soil moisture storage (future − present) under future global warming for (pink) T159 and (cyan) T799. Negative is drying, positive is moistening. (b) Contribution of water balance fluxes (P 0 , Q0 , and E 0 ) to changes of soil moisture storage in the future for T159 (left side of b) and T799 (right side of b). The changes in the water balance fluxes combine to dS 0 / dt. Negative values indicate contributions to drying, positive values indicate soil moistening. For both model resolutions, the changes in evapotranspi- 4.2 Spring evapotranspiration increase ration and precipitation clearly show that climate change induces enhanced evapotranspiration in spring and reduced The largest resolution-induced differences in soil drying oc- precipitation from June to September. Throughout the entire cur in spring (Fig. 5). Averaged over spring months, drying is warm season, this results in decreases in runoff, leading to larger in T799 (dS 0 / dt = −10.3 mm month−1 ) than in T159 reduced availability of water resources downstream. At the (dS 0 / dt = −3.7 mm month−1 ). Compared to the present, the same time, the decreases in runoff prevent the soil from fur- future shows an intensification of the hydrological cycle, ther desiccation (Fig. 5). with enhanced evapotranspiration from April to June and In the following subsections, we focus on spring and sum- enhanced precipitation in April and May (Fig. 5). At both mer averages for mechanistic explanations of the simulated model resolutions, evapotranspiration increase is the domi- changes in the surface water balance. Individual months are nant contributor to spring soil drying (Fig. 5). This increase discussed if it adds relevant information to the analyses. is stronger in T799 (E 0 = +18.5 mm month−1 ) than in T159 www.hydrol-earth-syst-sci.net/23/191/2019/ Hydrol. Earth Syst. Sci., 23, 191–206, 2019
198                             E. C. van der Linden et al.: Impact of resolution on projections of soil moisture projections

                                                                      which partly determines the infiltration of water into the soil
                                                                      and therefore the ratio of surface runoff to precipitation. Re-
                                                                      duced runoff thus acts as a negative feedback on soil drying
                                                                      in central-western Europe (Fig. 5), an effect which is stronger
                                                                      at high model resolution. This relatively local “moistening”
                                                                      effect (positive value of dS 0 / dt) of reduced runoff does not
                                                                      fully compensate for the strong drying effect of enhanced
                                                                      evapotranspiration in T799. The net result is stronger spring
                                                                      drying in central-western Europe at high model resolution. In
                                                                      the remainder of this subsection, we focus on the dominant
                                                                      contributor to future spring drying, which is evapotranspira-
                                                                      tion.
                                                                         Since local moisture recycling plays an important role
                                                                      in evapotranspiration over the continents, first we assess
                                                                      resolution differences in evapotranspiration in the present-
                                                                      day climate. The annual cycle of evapotranspiration over
                                                                      central-western Europe (Fig. 3d) indicates that T799 sim-
                                                                      ulates lower evapotranspiration in the present-day climate
                                                                      than T159. As already discussed in Sect. 2, the precipita-
                                                                      tion bias over central-western Europe is smaller in T799 than
                                                                      in T159 (Fig. 1b). In spring, the high-resolution model sim-
                                                                      ulates significantly less precipitation (2.9 mm day−1 ) than
                                                                      the standard-resolution model (3.4 mm day−1 ) (Welch t test:
                                                                      p < 0.01). This is induced by a shift in the precipitation dis-
                                                                      tribution towards more dry days (P ≤ 1 mm day−1 ) in the
                                                                      high-resolution model compared to the standard-resolution
                                                                      model (Kolmogorov–Smirnov test: p < 0.01). The reduced
                                                                      precipitation likely induces less evapotranspiration in T799
                                                                      (2.9 mm day−1 ) than in T159 (3.3 mm day−1 ) in the current
                                                                      climate (Welch t test: p < 0.01). In other words, suppressed
                                                                      precipitation in the present-day climate might lead to reduced
                                                                      recycling of moisture over land. This is because in HTESSEL
                                                                      rain is initially collected in the interception reservoir. Before
                                                                      saturation of the interception layer, less rainfall results in less
                                                                      evapotranspiration, which could explain the reduced evapo-
                                                                      transpiration in spring in the current climate.
                                                                         Second, we assess what mechanisms could explain the en-
                                                                      hanced increase in evapotranspiration over the 21st century.
                                                                      Assuming that the top soil layer is still saturated at the start
                                                                      of spring (Fig. 4), this implies that the enhanced evapotran-
Figure 6. Sea level pressure (Pa) climate change signal (future–      spiration in T799 is atmosphere-driven. We start with exam-
present) for spring in the (a) standard- and (b) high-resolution      ining future changes in the atmospheric circulation. In the
model. (c) Same but for difference in climate change signal between   high-resolution model an anomalous high-pressure area de-
the high- and standard-resolution model.                              velops near the British Isles that extends over central-western
                                                                      Europe (Fig. 6). The results show that the anomalous anticy-
                                                                      clonic circulation does not significantly affect the wind cli-
(E 0 = +7.2 mm month−1 ). Contributions of average spring-            mate over central-western Europe (Fig. 7a). However, high-
time precipitation to drying are negligible since rainfall in-        pressure anomalies promote subsidence, thereby supporting
creases in April and May are compensated by a rainfall re-            clear skies, with more solar radiation reaching the surface
duction in June. Furthermore, runoff plays an essential role in       (Fig. 7b). This effect is visible in the enhanced solar radiation
the soil moisture changes since there is close interaction be-        in June, but not in April and May. As a consequence, more
tween these two variables. Both model resolutions simulate            energy is available for future evapotranspiration and surface
reduced future runoff, indicating that less water flows away          warming (Fig. 7c) in June in T799.
from the study region (positive value of dS 0 / dt). In turn, the        Third, the impact of air temperature on atmospheric hu-
reduction in runoff is related to the soil moisture content,          midity is examined. Present-day daily mean springtime tem-

Hydrol. Earth Syst. Sci., 23, 191–206, 2019                                           www.hydrol-earth-syst-sci.net/23/191/2019/
E. C. van der Linden et al.: Impact of resolution on projections of soil moisture projections 199 Figure 7. Climate change signal (future − present) of (a) zonal and meridional wind speed at 10 m height, (b) total cloud cover and surface solar radiation, (c) daily mean surface air temperature and soil moisture storage, and (d) relative humidity and 850 hPa specific humidity for T159 (dashed lines) and T799 (solid lines). Values are smoothed with a 20-day running mean filter and averaged over central-western Europe. The letters on the horizontal axis correspond with the first day of each month (based on a year with 365 days). peratures are higher in T799 (12.3 ◦ C) than in T159 (11.8 ◦ C) a warmer climate due to the nonlinearity of the Clausius– (Welch t test: p < 0.01) (not shown). These warmer spring- Clapeyron relation. The warmer baseline surface air tem- time temperatures in T799 are associated with 10 % lower perature in T799 leads to a stronger increase in saturation cloudiness and 12 W m−2 more surface solar radiation in vapour pressure for a similar daily mean temperature change the baseline climate than in T159. The reduced cloudiness (+2.7 ◦ C in T799 compared to +2.3 ◦ C in T159) and thus a is consistent with the smaller amount of precipitation in larger increase in the atmospheric demand for moisture. This the T799 model. In the future climate, these resolution- is clearly visible in the lower relative humidity of the atmo- dependent differences are roughly maintained (9 % reduced sphere at high model resolution (Fig. 7d). Higher baseline cloud cover and 15 W m−2 more surface solar radiation than surface air temperatures thus contribute to enhanced spring- in T159). The specific humidity of the atmosphere increases time evapotranspiration in T799 compared to T159 under fu- with climate warming (Fig. 7d). However, as temperature in- ture climate warming. creases, the increase in saturation vapour pressure is larger in www.hydrol-earth-syst-sci.net/23/191/2019/ Hydrol. Earth Syst. Sci., 23, 191–206, 2019
200 E. C. van der Linden et al.: Impact of resolution on projections of soil moisture projections
In summary, spring drying is larger in the high-resolution
model version. This is due to a more continental climate
in the high-resolution model, with less precipitation and
warmer near-surface air temperatures, which promote en-
hanced evapotranspiration under climate warming. The main
cause of the more continental climate is the less zonal posi-
tion of the storm track in T799 as explained in Van Haren
et al. (2015b).
4.3 Summer precipitation decline
Changes in summertime soil moisture storage are larger
than springtime changes, but the summer differences be-
tween the model versions are relatively small. Compared
to the present, the future increase in average summer
drying at T799 resolution (dS 0 / dt = −16.0 mm month−1 )
is only slightly larger than the increase at T159 res-
olution (dS 0 / dt = −14.7 mm month−1 ). Consequently, the
resolution-induced differences in soil moisture content de-
veloped in spring are more or less maintained during sum-
mer. The dominant contributor to future soil drying in sum-
mer is a decline in rainfall (Fig. 5). Consistent with en-
hanced drying, the decline in average summer precipita-
tion is larger in T799 (P 0 = −24.1 mm month−1 ) than in
T159 (P 0 = −19.9 mm month−1 ). Similar to spring months,
runoff acts as a negative feedback on soil drying. Reduced
runoff counteracts local soil drying in both T799 (Q0 =
−7.2 mm month−1 ) and T159 (Q0 = −4.1 mm month−1 ).
However, runoff is rather a result of the reduced water avail-
ability than an active contributor to the drying. Therefore we Figure 8. Anomalies of surface fluxes under future climate change
focus on the causes of the precipitation decline. for (a) T159 and (b) T799. Positive indicates enhanced fluxes and
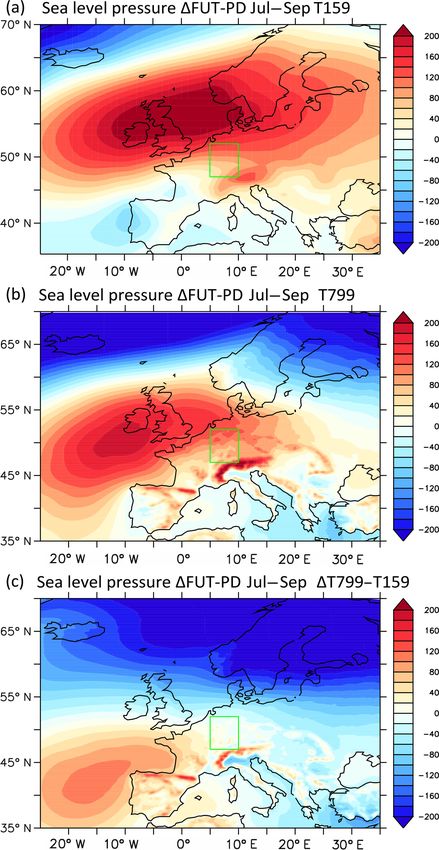
We first study the large-scale changes in the atmospheric negative reduced fluxes. Turbulent sensible heat (S 0 ) and latent heat
circulation. During summer, an anomalous high-pressure (λE 0 ) fluxes are defined positive upward and net surface radiation
0 ) is defined positive downward. Values are smoothed with a 20-
(Rnet
area over the British Isles extends over central-western Eu-
rope in both model versions (Fig. 8). The anticyclonic cir- day running mean filter and averaged over central-western Europe.
The letters on the horizontal axis correspond with the first day of
culation anomaly promotes subsidence and decreases con-
each month (based on a year with 365 days).
vection. This leads to less cloud cover and reduced sum-
mer precipitation (Figs. 7b and 5). In addition, changes
in the atmospheric circulation potentially affect horizon-
tal moisture transport through changes in the wind climate Furthermore, future soil drying and precipitation decline
over central-western Europe (Fig. 7a). Over this region, are not uniformly spread over individual summer months. In
eastward winds (U ) typically bring oceanic moisture over August and September, changes in soil moisture storage are
land, which increases the likelihood of continental precip- larger in T799 than in T159 (Fig. 5). Consistently, in Au-
itation. Due to the anticyclonic circulation anomaly, east- gust and September rainfall decline is larger in T799 than
ward winds are projected to decrease significantly in the in T159 (Fig. 5). Remarkably, in July the climate change-
future at both T159 (U 0 = −0.50 m s−1 ) and T799 resolu- induced soil moisture drying and precipitation decreases are
tion (U 0 = −0.30 m s−1 ) (Fig. 7a), reducing advection of at- larger in T159 than in T799 (Fig. 5). The simulations in-
mospheric moisture from ocean sources. Zonal wind speed dicate that these monthly precipitation changes are largely
changes thus act to enhance summer soil drying over central- determined by the magnitude and location of the anoma-
western Europe. However, zonal wind speed changes do not lous high-pressure pattern over the British Isles. In August
induce the resolution-dependent differences in future sum- and September, the anomalous high pressure is stronger over
mer drying, since wind speed reductions in T799 are smaller central-western Europe in T799 (Fig. 9b, c), whereas in July,
than in T159 and thus have a counteractive effect on the dif- the high-pressure anomaly is larger in T159. It thus appears
ferences in drying. that the atmospheric circulation plays an important role in
monthly precipitation changes, but is not the main cause
Hydrol. Earth Syst. Sci., 23, 191–206, 2019 www.hydrol-earth-syst-sci.net/23/191/2019/E. C. van der Linden et al.: Impact of resolution on projections of soil moisture projections 201
0 ). In future, maximum evapotranspiration is
radiation (Rnet
achieved in June for both T159 and T799 (Fig. 3). There-
after evapotranspiration decreases rapidly, coinciding with a
significant decrease in soil moisture in the top layer (Fig. 4).
This decrease is stronger in T799 than in T159 (Fig. 6) and
shows that from June onward evapotranspiration is limited
by soil moisture. In the present-day climate, maximum evap-
otranspiration occurs 1 month later (July), for both T159 and
T799, closer to the maxima in solar radiation and surface
temperature (Fig. 7b, c), indicating that for the present cli-
mate evapotranspiration is not restricted by soil moisture but
by available surface energy. As a result, there is no marked
change in total summer evapotranspiration towards the future
in T799 (E 0 = +3.9 mm) and T159 (E 0 = +4.1 mm). In turn,
the minor increase in evapotranspiration limits the increase
in specific humidity of the atmosphere (Fig. 7d) and thereby
the local recycling of moisture. In addition, the limited atmo-
spheric moisture content in combination with warmer tem-
peratures leads to reduced relative humidity and less cloudi-
ness, with more surface solar radiation (Fig. 7b, d). The re-
sulting warmer and drier boundary layer (Fig. 7c, d) further
diminishes rainfall. This effect is stronger at T799 resolu-
tion, presumably caused by the drier soils at the start of sum-
mer that alter the partitioning of the turbulent fluxes. Local
feedbacks of soil moisture with temperature and precipitation
thus seem to dominate the resolution-dependent differences
in summer drying.
5 Impact on droughts and other extremes
5.1 Soil moisture droughts
The changes in the seasonal cycle of soil moisture content af-
fect the severity and frequency of future droughts under cli-
mate warming. Consider Fig. 10, which depicts the S 0 distri-
butions of spring and summer at T799 and T159 resolution,
for the present and future climates. The drought threshold
values (6/30 year events) as defined in Sect. 2.4, which are
based on these distributions, are also indicated. The associ-
Figure 9. Sea level pressure (Pa) climate change signal (future– ated frequency of droughts by the end of the 21st century,
present) for summer in the (a) standard and (b) high-resolution averaged over central-western Europe, can be seen in the bar
model. (c) Same but for difference in climate change signal between chart of Fig. 11a.
the high- and standard-resolution model. In spring, model resolution has a high impact on the fre-
quency of future droughts. In the T159 simulations, there
is no significant future change in the frequency of spring-
of resolution-induced differences averaged over the summer time droughts. This is clearly visible in the large overlap of
months. the present-day and future climates in the distributions of
Next to large-scale circulation changes, local feedbacks spring soil moisture anomalies for T159 (Fig. 10a). In con-
play a role in the reduced precipitation in summer. The sur- trast, in T799, the springtime soil moisture anomaly distri-
face water balance is closely connected to the surface en- butions indicate that the frequency of droughts increases due
ergy balance through latent cooling by evapotranspiration. to a shift towards drier conditions in the future climate. Fu-
Figure 12 depicts average future changes of the main com- ture springtime droughts are almost 3 times more frequent
ponents of the surface energy balance, including the sensi- in T799 than in T159 (RF ' 2.7), occurring every 1 to 2
ble heat flux (S 0 ), latent heat flux (λE 0 ), and the net surface years (fT799 ' 71 %) (Fig. 11). The increase in the num-
www.hydrol-earth-syst-sci.net/23/191/2019/ Hydrol. Earth Syst. Sci., 23, 191–206, 2019202 E. C. van der Linden et al.: Impact of resolution on projections of soil moisture projections
Figure 10. Kernel density distribution of soil moisture anomalies over central-western Europe in (a) April–June at T159 resolution, (b) April–
June at T799 resolution, (c) July–September at T159 resolution, and (d) July–September at T799 resolution for the present (blue) and future
(pink) climates. Vertical black lines indicate the drought thresholds based on 6/30 year events (20th percentile) of the present-day soil
moisture anomaly distributions.
ber of springtime drought months is partly due to a shift warmer air temperatures, this decreases the relative humidity
in the threshold value of S 0 : in T159 droughts are defined of the atmosphere (Fig. 7d). The warmer and drier boundary
as S 0 ≤ −29 mm compared to S 0 ≤ −17 mm in T799. This layer inhibits cloud formation and further enhances surface
is due to a relatively narrow distribution of soil moisture solar radiation (Fig. 7b). The resulting rise in daily maxi-
anomalies in the high-resolution baseline climate (Fig. 10d). mum surface air temperature in T799 (+5.1 ◦ C) and T159
Applying the threshold of T159 to T799 results in a slightly (+4.8 ◦ C) is about 2 times larger than in spring.
smaller percentage of the months being under drought con- This local soil-moisture–temperature feedback starts a few
ditions (CRF < RF) (Fig. 11b). weeks earlier for the high-resolution model (Fig. 7b) due to
During the summer months, future droughts become more the enhanced soil drying in spring. The strengthening of the
frequent at both resolutions (fT799 ' 89 % and fT159 ' soil-moisture–temperature coupling is also visible in Fig. 12,
61 %). Nevertheless, model resolution is still an impor- which shows a steeper regression line between soil moisture
tant factor in drought frequency, with about 50 % more content and daily maximum temperature for the future cli-
drought months in T799 than in T159 (RF ' 1.5). The high- mate than for the present climate. The stronger feedback in
resolution simulations indicate that droughts in the present- T799 leads to a clustering of exceptionally dry and hot sum-
day climate will become the normal climatological state in mers in T799 compared to T159 (clustered in the top left
the future. However, it should be noted that the sample size corner in Fig. 12b). The strong link between soil moisture
is only 30 years of a single climate model. To obtain more and maximum temperatures is created by reduced soil mois-
robust answers a larger ensemble of different models is re- ture which strongly restrains latent cooling in summer in both
quired. T159 (r = 0.78, p < 0.01) and T799 (r = 0.90, p < 0.01). In
the future, drier future spring soil conditions could therefore
5.2 Warm extremes potentially act as a precursor for hot summers.
The drier soil at the start of summer limits the evaporative
fraction, leading to enhanced sensible heat fluxes that am-
plify near-surface warming (Figs. 7c and 8). Combined with
Hydrol. Earth Syst. Sci., 23, 191–206, 2019 www.hydrol-earth-syst-sci.net/23/191/2019/E. C. van der Linden et al.: Impact of resolution on projections of soil moisture projections 203
can recharge with water vapour. The drier soil conditions in
T799 thus likely increase the number of dry days between
heavy rain events.
6 Summary and conclusions
Using two model resolutions of the global climate model
EC-Earth, we have investigated the impact of model resolu-
tion on the occurrence and causes of projected soil drying in
the Rhine–Meuse drainage area in central-western Europe.
Consistent with previous studies (Berg et al., 2017; Ruos-
teenoja et al., 2018; Samaniego et al., 2018), both model res-
olutions project soil drying in the warm season months over
central-western Europe. For the present-day climate the high-
resolution (T799, ∼ 25 km) and standard-resolution (T159,
∼ 112 km) versions have similar soil moisture climatologies.
However, for the future large differences occur. In spring,
enhanced evapotranspiration with respect to the correspond-
ing baseline climatology induces much stronger drying in the
high-resolution model. The enhanced spring drying precon-
ditions the soil to a drier state at the start of summer. Both
resolutions simulate a significant increase in summer dry-
ing of similar magnitude. Due to the pre-drying in spring,
Figure 11. (a) Frequency of future droughts, expressed as the per- this leads to more frequent droughts at high resolution than
centage of months in drought for T159 and T799 over central- at standard resolution. Consequently, in the high-resolution
western Europe. (b) Resolution factor (RF) and corrected resolution
model, summer droughts in the present-day climate become
factor (CRF). The resolution factor indicates the impact of resolu-
tion and is defined as the ratio of the frequency of droughts in T799
the normal climatological state in the future.
to the frequency of droughts in T159. The corrected resolution fac- The analyses revealed that both anomalous circulation pat-
tor corrects for shifts in the baseline climate due to higher spatial terns and local feedbacks are responsible for the decrease
resolution. CRF is computed similar to RF, but uses the thresholds in soil moisture in a future climate. A less zonal position
of soil moisture anomalies based on the climatology of T159 for of the storm tracks leads to a more continental climate over
drought thresholds in T799. central-western Europe and a reduction in present-day biases
in precipitation and surface air temperature (Van Haren et al.,
2015b). The resulting warmer and drier spring promotes en-
5.3 Heavy precipitation and dry days hanced evapotranspiration in the high-resolution model. Fur-
thermore, an anticyclonic pressure anomaly over the British
In the current climate, T799 simulates a larger fraction of dry Isles extends over central-western Europe. Although no sig-
days and a larger fraction of precipitation falling as intense nificant changes in wind occur during the preconditioning
rain compared to T159 (Fig. 13), which is presumably caused phase in spring, the high-pressure anomaly supports clear
by the higher surface air temperature. In the future climate, skies with enhanced surface solar radiation reaching the sur-
both resolutions simulate an increase in the number of dry face. This provides additional surface energy for turbulent
days in summer and in the contribution of heavy precipita- fluxes in June.
tion to the total precipitation amount. This effect is larger in Simulated summer drying is mainly caused by a reduc-
T799. Unless there is moisture supply from the ocean, after tion in rainfall. The drying of the land surface results in a
a day with heavy precipitation the air needs to be recharged reduced evaporative fraction combined with enhanced so-
before a new downpour can start. In between heavy precipi- lar radiation in higher surface temperatures. This feedback
tation days, it is therefore relatively dry with little rain. Dur- is slightly stronger at high model resolution due to the pre-
ing these dry days there will be less cloud cover, with more drying in spring. The drier soil in the high-resolution model
incoming solar radiation, higher temperatures, and less rela- at the start of summer induces stronger local feedbacks with
tive humidity, inducing a higher evaporative demand. So for precipitation and evapotranspiration, which leads to a clus-
the same amount of rain, a shift to more dry days and heavy tering of droughts and warm extremes. The impact of soil
precipitation potentially increases the evaporative demand of moisture on observed European warm extremes has also been
the atmosphere. Dry soils, however, limit the rate of evapo- demonstrated by Whan et al. (2015) using a simple water bal-
transpiration and slow down the rate at which the atmosphere ance model. Another consequence of warm season drying is
www.hydrol-earth-syst-sci.net/23/191/2019/ Hydrol. Earth Syst. Sci., 23, 191–206, 2019204 E. C. van der Linden et al.: Impact of resolution on projections of soil moisture projections
Figure 12. Linear regression between summer (July–September) soil moisture content and daily maximum surface air temperature for
(a) T159 and (b) T799, for the present (blue) and future (red) climate.
Figure 13. (a) Monthly fraction of precipitation falling as heavy rain (≥ 30 mm day−1 ) in central-western Europe, computed as the contri-
bution of heavy precipitation falling somewhere in the area to the total amount of precipitation. (b) Monthly fraction of dry days averaged
over central-western Europe (≤ 1 mm day−1 ). Before the analysis we regridded precipitation values to the T159 model grid and computed
the daily sum of precipitation per grid cell.
the absence of recovery of the ground water storage in the ated in a larger ensemble of different models. Initiatives such
following winter, with consequences for year-round runoff. as the Horizon 2020 project PRIMAVERA and the CMIP6-
The stronger local feedbacks open, on the other hand, pos- endorsed HighResMIP (Haarsma et al., 2016) will contribute
sibilities for predictability of summer droughts, heat waves, to the hypothesis put forward in this study that the simulated
precipitation, and river runoff. central-western European soil drying by CMIP5 is underesti-
We argue that both dynamical and local feedback pro- mated due to dynamical causes and local feedbacks that can
cesses are better represented at higher resolution. The cause only reliably be simulated at high resolution.
of the anomalous anticyclonic circulation over the British
Isles could be a weakening of the Atlantic meridional over-
turning circulation (AMOC) under future climate warming, Data availability. E-OBS precipitation and temperature gridded
as discussed in Haarsma et al. (2015). The stronger response data are freely available from the European Climate Assessment
at the high T799 resolution is probably due to enhanced and Dataset (Haylock et al., 2008). The EC-Earth model output is
ocean–atmosphere coupling. Because CMIP5 models under- available upon request to the author.
estimate the natural interannual variability of this AMOC-
induced UK high (Haarsma et al., 2015), we argue that the
Author contributions. ECvdL designed the study and wrote the pa-
stronger response in T799 is more realistic. Furthermore, the
per. ECvdL and RJH conducted analysis of the data. All authors
additional increase in spring drying in the high-resolution contributed to interpreting results.
simulations is partly due to a better representation of the At-
lantic storm track at high model resolution as described in
Van Haren et al. (2015b). Whether the simulated soil dry-
ing and the impact of resolution is robust has to be evalu-
Hydrol. Earth Syst. Sci., 23, 191–206, 2019 www.hydrol-earth-syst-sci.net/23/191/2019/E. C. van der Linden et al.: Impact of resolution on projections of soil moisture projections 205
Competing interests. The authors declare that they have no conflict Haarsma, R. J., Selten, F. M., and Drijfhout, S. S.: Decelerating
of interest. Atlantic meridional overturning circulation main cause of fu-
ture west European summer atmospheric circulation changes,
Environ. Res. Lett., 10, 094007, https://doi.org/10.1088/1748-
Acknowledgements. We thank Luis Samaniego and an anonymous 9326/10/9/094007, 2015.
referee for their valuable comments which helped to considerably Haarsma, R. J., Roberts, M. J., Vidale, P. L., Senior, C. A., Bellucci,
improve the quality of the paper. A., Bao, Q., Chang, P., Corti, S., Fuckar, N. S., Guemas, V., von
Hardenberg, J., Hazeleger, W., Kodama, C., Koenigk, T., Leung,
Edited by: Kerstin Stahl L. R., Lu, J., Luo, J.-J., Mao, J., Mizielinski, M. S., Mizuta, R.,
Reviewed by: Luis Samaniego and one anonymous referee Nobre, P., Satoh, M., Scoccimarro, E., Semmler, T., Small, J.,
and von Storch, J.-S.: High Resolution Model Intercomparison
Project (HighResMIP v1.0) for CMIP6, Geosci. Model Dev., 9,
4185–4208, https://doi.org/10.5194/gmd-9-4185-2016, 2016.
References Haylock, M. R., Hofstra, N., Klein Tank, A. M., Klok,
E. J., Jones, P. D., and New, M.: A European daily high-
Baatsen, M., Haarsma, R. J., Van Delden, A. J., and de Vries, resolution gridded data set of surface temperature and precipi-
H.: Severe autumn storms in future Western Europe with tation for 1950–2006, J. Geophys. Res.-Atmos., 113, D20119,
a warmer Atlantic Ocean, Clim. Dynam., 45, 949–964, https://doi.org/10.1029/2008JD010201, 2008.
https://doi.org/10.1007/s00382-014-2329-8, 2015. Hazeleger, W., Wang, X., Severijns, C., Stefanescu, S., Bintanja,
Balsamo, G., Beljaars, A., Scipal, K., Viterbo, P., van den R., Sterl, A., Wyser, K., Semmler, T., Yang, S., van den Hurk,
Hurk, B., Hirschi, M., and Betts, A. K.: A Revised Hy- B., van Noije, T., van der Linden, E., and van der Wiel, K.:
drology for the ECMWF Model: Verification from Field EC-Earth V2.2: Description and validation of a new seamless
Site to Terrestrial Water Storage and Impact in the In- earth system prediction model, Clim. Dynam., 39, 2611–2629,
tegrated Forecast System, J. Hydrometeorol., 10, 623–643, https://doi.org/10.1007/s00382-011-1228-5, 2012.
https://doi.org/10.1175/2008JHM1068.1, 2009. Hirschi, M., Seneviratne, S. I., Alexandrov, V., Boberg, F.,
Berckmans, J., Woollings, T., Demory, M. E., Vidale, P. L., and Boroneant, C., Christensen, O. B., Formayer, H., Orlowsky, B.,
Roberts, M.: Atmospheric blocking in a high resolution climate and Stepanek, P.: Observational evidence for soil-moisture im-
model: Influences of mean state, orography and eddy forcing, pact on hot extremes in southeastern Europe, Nat. Geosci., 4,
Atmos. Sci. Lett., 14, 34–40, https://doi.org/10.1002/asl2.412, 17–21, https://doi.org/10.1038/ngeo1032, 2011.
2013. Huang, J., Yu, H., Guan, X., Wang, G., and Guo, R.: Accelerated
Berg, A., Sheffield, J., and Milly, P. C.: Divergent surface and to- dryland expansion under climate change, Nat. Clim. Change, 6,
tal soil moisture projections under global warming, Geophys. 166–171, https://doi.org/10.1038/nclimate2837, 2016.
Res. Lett., 44, 236–244, https://doi.org/10.1002/2016GL071921, Jung, T., Miller, M. J., Palmer, T. N., Towers, P., Wedi, N.,
2017. Achuthavarier, D., Adams, J. M., Altshuler, E. L., Cash,
Delworth, T. L., Rosati, A., Anderson, W., Adcroft, A. J., Balaji, V., B. A., Kinter, J. L., Marx, L., Stan, C., and Hodges, K. I.:
Benson, R., Dixon, K., Griffies, S. M., Lee, H. C., Pacanowski, High-resolution global climate simulations with the ECMWF
R. C., Vecchi, G. A., Wittenberg, A. T., Zeng, F., and Zhang, R.: model in project athena: Experimental design, model cli-
Simulated climate and climate change in the GFDL CM2.5 high- mate, and seasonal forecast skill, J. Climate, 25, 3155–3172,
resolution coupled climate model, J. Climate, 25, 2755–2781, https://doi.org/10.1175/JCLI-D-11-00265.1, 2012.
https://doi.org/10.1175/JCLI-D-11-00316.1, 2012. Kumar, S., Merwade, V., Kinter, J. L., and Niyogi, D.: Evaluation
Demory, M. E., Vidale, P. L., Roberts, M. J., Berrisford, P., of temperature and precipitation trends and long-term persistence
Strachan, J., Schiemann, R., and Mizielinski, M. S.: The in CMIP5 twentieth-century climate simulations, J. Climate, 26,
role of horizontal resolution in simulating drivers of the 4168–4185, https://doi.org/10.1175/JCLI-D-12-00259.1, 2013.
global hydrological cycle, Clim. Dynam., 42, 2201–2225, Lorenz, R., Argüeso, D., Donat, M. G., Pitman, A. J., Hurk, B. V. D.,
https://doi.org/10.1007/s00382-013-1924-4, 2014. Berg, A., Lawrence, D. M., Chéruy, F., Ducharne, A., Hagemann,
Feng, S. and Fu, Q.: Expansion of global drylands under a S., Meier, A., Milly, P. C., and Seneviratne, S. I.: Influence of
warming climate, Atmos. Chem. Phys., 13, 10081–10094, land-atmosphere feedbacks on temperature and precipitation ex-
https://doi.org/10.5194/acp-13-10081-2013, 2013. tremes in the GLACE-CMIP5 ensemble, J. Geophys. Res., 121,
Greve, P. and Seneviratne, S. I.: Assessment of future changes in 607–623, https://doi.org/10.1002/2015JD024053, 2016.
water availability and aridity, Geophys. Res. Lett., 42, 5493– Milly, P. C. and Dunne, K. A.: Potential evapotranspiration
5499, https://doi.org/10.1002/2015GL064127, 2015. and continental drying, Nat. Clim. Change, 6, 946–949,
Greve, P., Roderick, M. L., and Seneviratne, S. I.: Simulated https://doi.org/10.1038/nclimate3046, 2016.
changes in aridity from the last glacial maximum to 4xCO2, Orlowsky, B. and Seneviratne, S. I.: Elusive drought: un-
Environ. Res. Lett., 12, 114021, https://doi.org/10.1088/1748- certainty in observed trends and short- and long-term
9326/aa89a3, 2017. CMIP5 projections, Hydrol. Earth Syst. Sci., 17, 1765–1781,
Haarsma, R. J., Hazeleger, W., Severijns, C., De Vries, H., https://doi.org/10.5194/hess-17-1765-2013, 2013.
Sterl, A., Bintanja, R., Van Oldenborgh, G. J., and Van Palmer, W. C.: Meteorological Drought, vol. 45, U.S. Department
Den Brink, H. W.: More hurricanes to hit western Europe of Commerce, Weather Bureau, Washington, DC, 1965.
due to global warming, Geophys. Res. Lett., 40, 1783–1788,
https://doi.org/10.1002/grl.50360, 2013.
www.hydrol-earth-syst-sci.net/23/191/2019/ Hydrol. Earth Syst. Sci., 23, 191–206, 2019You can also read