IMPACT OF COVID-19 FOOD SECURITY IN IRAQ - Impact of COVID-19, April-June 2020
←
→
Page content transcription
If your browser does not render page correctly, please read the page content below
FOOD SECURITY IN IRAQ
IMPACT OF COVID-19
APRIL - JUNE 2020
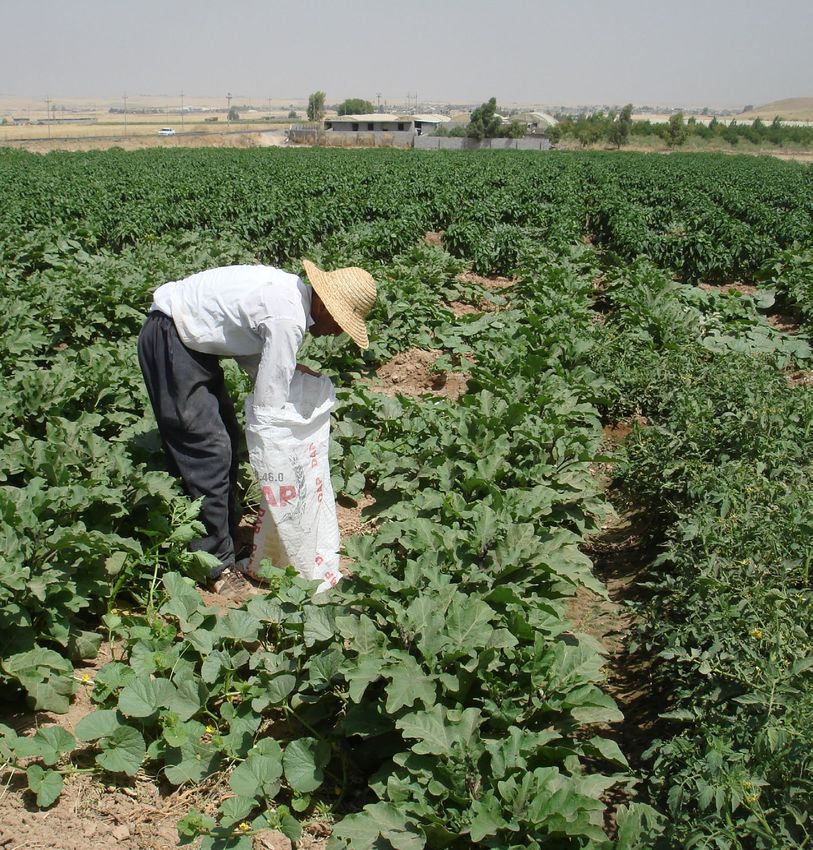
Photo/ Emilienne Malfatto
1
EXECUTIVE SUMMARY

    The COVID-19 pandemic continues across the world, and in Iraq the number of cases is
    rising. As of 30 June 2020, the World Health Organization reported 49,109 cases in Iraq, with
    1,943 fatalities. Since March, the government has been enforcing movement restrictions
    and curfews to help slow transmission of the virus. As the livelihoods of many people have
    been affected as they are unable to work, humanitarian, social protection and development
    responses have also stepped up, both from the government and supporting partners.

    Since April, the Food and Agriculture Organization (FAO), World Food Programme (WFP) and
    World Bank have published new weekly reports on the impact of COVID-19 on food security
    in Iraq. Together with the International Fund for Agricultural Development (IFAD), and with
    further assistance from Food Security Cluster partners such as the Cash Consortium of Iraq
    (CCI), the organizations are collaborating to build on the work so far with new research and
    analysis, in this new monthly assessment.

    The global economic slowdown and reduced demand have led to a sharp decline in
    commodity prices, particularly oil. In Iraq’s oil-based economy, the decline in global oil prices
    has put pressure on national finances. This drop, plus the government stimulus package
    introduced in October 2019 are expected to increase the need for deficit financing.

    Global food markets remain well supplied and international prices relatively stable. Some
    health checks and quarantines have resulted in delays on the borders, increased transit
    times and transportation costs. On the other hand, in the current agricultural year, conditions
    for crop development in Iraq have been generally favorable with timely and well distributed
    rains. With above average domestic production, depending on the quality of the wheat
    purchased, it is estimated that Iraq has sufficient wheat stocks to cover its food needs until
    at least autumn 2020. The third Public Distribution System (PDS) cycle for wheat flour,
    although delayed, was completed in May. Distributions of the remaining sugar and oil stocks
    will continue, to families registered as vulnerable under the Ministry of Labor and Social
    Affairs (MoLSA) programme for social protection.

    In response to the increased needs of many households without income during the lockdown,
    the government established a new cash disbursement program, “Minha” (“Grant”). The
    Central Bank of Iraq (CBI) has also introduced measures to mitigate the impact of the crisis
    on households and businesses, but a larger stimulus package is still needed to re-start the
    economy.

    With strict price control measures in place after initial spikes, food prices generally started
    stabilizing from April. The latest mobile Vulnerability Analysis and Mapping (mVAM) data
    indicates that price stability is still a challenge where most retailers remain uncertain of
    future prices. However, the overall functionality of markets is improving. The Market
    Functionality Index score rose from 6.5 to 7.2 by the third round of data collection. Meanwhile,
    mVAM household data revealed that people’s food consumption patterns improved during
    the month of Ramadan - largely because of religious charities (known as zakat). Around 4.8
    million people (12% of the total population) are using negative coping strategies to meet
    their food needs.

                                                                                                        Photo/ Emilienne Malfatto

2                                                                                                                                   3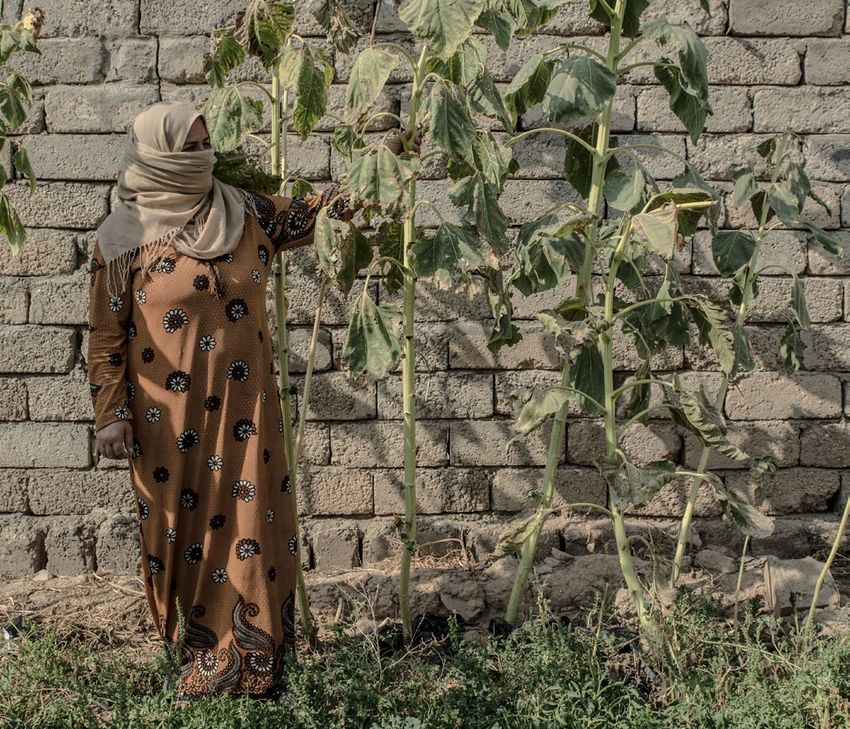
I. POLICY
   RECOMMENDATIONS
1. MACROECONOMIC SITUATION.
The difference between the planned and actual oil price, which decreased as a result of the global slowdown, is
putting a dent in the budget balance, endangering the government’s ability to maintain its commitments to deliver
PDS rations as well as basic services and salaries. The government needs to consider preparing for various scenarios
of its budget depending on the speed of the global recovery post-COVID–19, and to consider alternative funding
sources and eventual adjustments to spending.

2. RETHINKING INTRA-REGIONAL TRADE
Turkey and Iran remain important trading partners, among others - Iraq officially imports around USD 2.8 and USD
2.2 billion worth of food and agriculture products from the two countries respectively. For certain commodities
(i.e. wheat and barley), Iraq has an incentive to review its agriculture export and import policies. However, these
protectionist policies should not be at the expense of larger food and agriculture trade and regional integration.        6. INVESTING IN PRODUCTIVE INFRASTRUCTURE
A broader trade regional integration framework and dialogue needs to be prioritized, and could be a starting point
for mutual cooperation and broader strategy on regional food security. Thus, an in-depth value and supply chain           Rehabilitating agriculture infrastructure, particularly structures damaged by the Islamic State of Iraq and the Levant
analysis is required to re-assess Iraq’s comparative advantage with respect to specific commodities, and how it           (ISIL), has remained a national priority. In light of high unemployment rates due to COVID-19 containment measures,
integrates into the broader regional food system.                                                                         which constrained livelihood opportunities for many casual workers, these types of programmes should continue
                                                                                                                          to be prioritized as they have the distinct advantage of employing large numbers of individuals, while also improving
                                                                                                                          agricultural productivity and natural resource use efficiency. For example, revamping Iraq’s canals and irrigation
                                                                                                                          system and building local reservoirs (i.e. hafirs) will improve water use efficiency, a critical topic as water availability
                                                                                                                          is anticipated to decrease due to upstream riverbank development, dwindling non-renewable sources and potential
3. INCREASING FOOD AVAILABILITY
                                                                                                                          climate change effects.
The government procures locally and internationally major staples such as wheat and rice as part of its price support
subsidy program for producers, while other food products on the market are imported by local traders in the
private sector. The CBI has removed restrictions on foreign transfers; however, traders are reporting that they are       7. SUPPORTING SECTORS NON-INTEGRATED IN THE FORMAL ECONOMY
still encountering procedural delays and difficulties to obtain letters of credit for merchandise imports. The
                                                                                                                          While CBI has introduced multiple measures to mitigate the impact of the crisis on households and businesses, a
government and CBI are encouraged to set aside funds from the remaining foreign reserves for food imports that
                                                                                                                          larger stimulus package is needed to re-start the economy. A moratorium on loan payments and interest, plus the
could be tapped by private banks and traders to ensure stable supplies on the domestic markets.
                                                                                                                          suspension of vendor commissions on electronic payment tools for a period of six months, will have a positive
                                                                                                                          effect on medium-size food and agriculture enterprises already integrated within the banking economy and that
                                                                                                                          have digitized their payments. Nevertheless, the majority of the food and agriculture sector remains cash-based
                                                                                                                          and not engaged with the private banking sector. The government and the central bank need to stimulate the
4. CREATING AN ENABLING ENVIRONMENT FOR INCREASING DOMESTIC PRODUCTION                                                    engagement of the food and agriculture sector with an improved private banking sector, in addition to providing
In order to improve food self-reliance of Iraq, the government supports local farmers to boost domestic production.       the stimulus for digitization across the food value chain.
The Ministry of Agriculture (MoA) imposed import bans and tariffs on 25 vegetable and fruit products; however,
agriculture products from neighboring countries (Turkey, Iran, and Syria) continue to seep into the country. As their
                                                                                                                          8. STRENGTHENING SOCIAL SAFETY NETS
currencies continue to depreciate while Iraq maintains its peg of the Iraqi Dinar constant to the US Dollar, the prices
of these foreign products on Iraqi market remain depressed, benefitting the Iraqi consumer and harming Iraqi              Although MoLSA has launched the Minha program to support affected families, implementation remains problematic
producers. Foreign competition results in reduced returns for farmers and the continued depletion of the daily            due to depleted government financial resources as a result of global oil prices. With the delayed PDS distribution
foreign currency reserve. Until border control measures are fully enforced, the government has an incentive to            (up to three months), more households will be affected, as the proportion of the population living under the national
revise its monetary policy as part of a larger economic strategy, depreciating the currency as a tool to protect local    poverty line has likely increased as lockdown and curfews constrained opportunities of casual labor. The government
industry and stimulate local growth, as well as protect the remaining foreign currency reserves.                          needs to urgently prioritize funding for existing programs such as the PDS, in addition to programmes that target
                                                                                                                          those most in need. For example, MoLSA, the Ministry of Trade (MoT) and Ministry of Migration and Displacement
                                                                                                                          (MoMD) should explore data integration, leveraging the ongoing PDS digitalization process, to improve targeting
                                                                                                                          for all existing social assistance programs and more efficient use of available resources.
5. COVID-19 AND AGRIFOOD SECTOR:
Despite the rising number of COVID-19 cases, farmers and workers in agricultural and food sectors should be               9. IMPROVE FOOD SECURITY MONITORING AND SURVEILLANCE CAPACITY
granted continued exceptions from lockdowns and curfews for an uninterrupted supply of local markets. Sufficient
amounts of personal protection material including masks, sanitizer, etc. at reasonable prices should be provided          Strengthen information systems on production, livestock, water, trade, prices, market functionality and health/
to those working in the sector. As transportation bottlenecks have become an issue in other countries, resulting          nutrition, and support networking between relevant Ministries under a National Early Warning System in Iraq that
in excess production on the farm gate but shortages in urban centers, governments have opened markets and                 brings together key data sets on Iraq’s overall food supply and demand, to allow for in-depth analysis, regular
facilitated transportation from rural to urban areas to ensure an outlet for local farm products and supply for urban     reporting and policy recommendations. Specific attention needs to be given to the impact of the COVID-19 pandemic
centers. Similar arrangements can be explored in Iraq.                                                                    on critical infrastructure, services and support functions and actors.

4                                                                                                                                                                                                                                                   5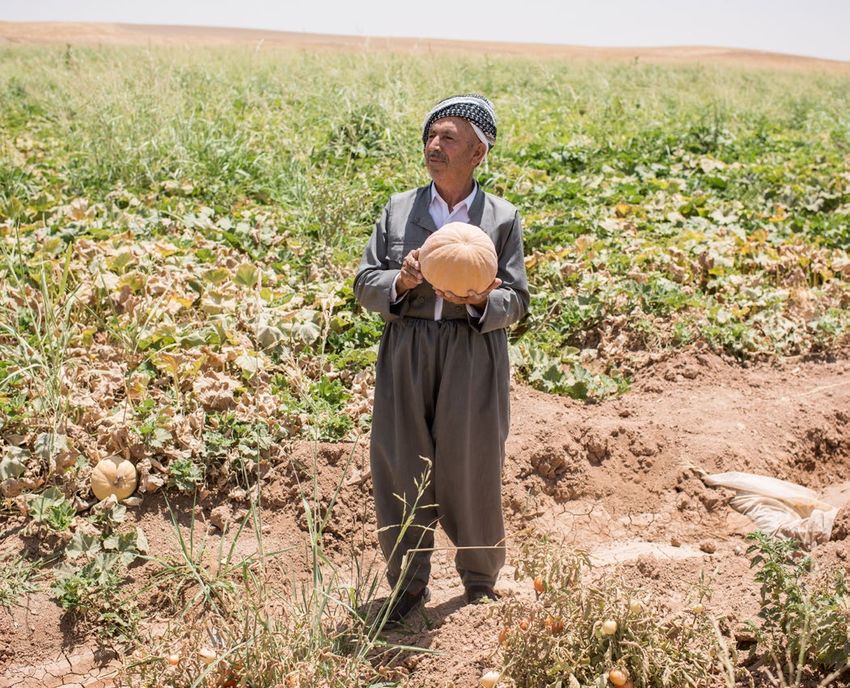
TABLE OF CONTENTS
    EXECUTIVE SUMMARY                         2
    I. POLICY RECOMMENDATIONS                4
    II. SOCIOECONOMIC CONTEXT                8
    Global Developments
    Global Commodity Prices
    Global Trade
    Bilateral Food Trade

    National Developments
    Fiscal and Monetary Pressures
    Subsidies and Social Protection

    III. FOOD AVAILABILITY                   14
    Food Production
    Food Imports and Reserves

    IV. FOOD ACCESS AND STABILITY            17
    Food Price Trends
    Local Market Trends
    Household Food Consumption
    Household Income and Coping Strategies

6                                                 7
The FAO Cereal Price Index averaged 162.2 points in May, down 1.6 points (1.0%) from April and very close to its
II. SOCIOECONOMIC
level of the corresponding month last year. Among major cereals, only rice prices rose in May, mainly on rising
Japonica and Basmati quotations. By contrast, international maize prices registered a fourth consecutive month
of decline as newly harvested crops in South America expanded already large export availability despite weaker
CONTEXT demand for animal feed and fuel ethanol.
Despite relatively contained adjustments in the price index, in anticipation of the export limits by major producing
countries, wheat prices in the global market changed considerably in a short time period. On international markets,
wheat in early March was traded at as low as USD 170 per tonne, while the price rose to USD 217 in April. This may
GLOBAL DEVELOPMENTS be related to the Russian Federation’s export quota of 7 million tonnes introduced in March being exhausted by
GLOBAL COMMODITY PRICES Figure 1: FAO Food Price Index (FPI) where a) is the overall Food Price 26 April. Prices decreased again in May as a slowdown in trade activities and harvesting in the northern hemisphere
Index by month from 2016 to 2020 and b) is the FPI by staple commodity got underway, increasing expectations of ample global supplies in the new season. The week of 2 June, one tonne
Responding to a global economic slowdown driven from June 2019 to May 2020. of HRW wheat was quoted on average at USD 221, slightly below USD 226 per tonne quoted one year ago.
by measures introduced by governments in an Source: http://www.fao.org/worldfoodsituation/foodpricesindex/en/
effort to contain the spread of COVID-19, As of May 2020, presuming favorable conditions for the rest of the season, FAO forecasts the 2020 world cereal
commodities – oil in particular – faced a sudden production at a record level of 2,780 million tons, driven by promising maize and rice production prospects. Wheat
collapse in demand and a massive decline in prices production is forecast at 758 million tons, a decline of about 4 million from the previous year’s good level. Decreased
210
globally. Although energy prices increased by 32% production is anticipated in the European Union, Ukraine and the US, but expected production increases in the
in May compared to April as crude oil prices Russian Federation and Austria will largely offset that decrease. Global wheat utilization in the 2020/21 marketing
200
recovered, the index is just half its end-2019 level. season will likely stagnate at around 754 million tons as demand for animal feed and biofuel feedstock decreases.
The average crude oil price decreased from USD As the current 2019/20 (July/June) season for wheat is drawing to a close, the preliminary forecast for wheat trade
190
53.3 per barrel (bbl) in February to USD 21 in April, in 2020/21 stands at 177.5 million tons, representing 1.4% over the 2019/20 estimated volume. While early indications
but recovered to USD 30.4 in May. In 2019, the for most countries suggest that in 2020/21 imports will remain close to the 2019/20 levels, several countries,
Food Price Index
180
crude price averaged USD 61.34 per bbl.1 Low oil including those in the Middle East and North Africa, are likely to increase their wheat purchases amidst below-
prices present a particular challenge for economies average domestic harvests and stockpiling.
170
reliant on hydrocarbons for income, including Iraq.
Global food markets have remained well supplied 160
GLOBAL TRADE
and aggregate international prices have been
stable or easing as of May. The FAO Food Price 150 Overall trade has declined substantially because of the global economic slowdown. The World Trade Organization
Index (FPI, Figure 1) averaged 162.5 points in May, estimates that world trade will fall by 13 to 32% in 2020, depending on the speed of the economic recovery.2 Overall
down 3.1 points (1.9%) from April and reaching the 140 available shipping capacity was reported to be down 50%, but trade in essential goods, including food, has continued
lowest monthly average since December 2018. The at all ports without any major interruptions, despite reduced availability of port workers because of sickness or
May decline marked the fourth consecutive 130 fear of being infected. Physical distancing measures and health checks have caused delays, but ports and sea
monthly decrease in the value of the index. With freight remain operational. Shipments of refrigerated containers with agricultural produce and food have always
the exception of sugar which rose for the first time 120 carried a premium (sometimes up to 3 to 4 times over bulk shipments), which translates into higher food prices,
in three months, all the other sub-indices of the 1 2 3 4 5 6 7 8 9 10 11 12 of particular importance for food import dependent countries such as Iraq.
overall index registered month-on-month declines Month Global airfreight capacity remained constrained in some destinations, including to and from the Middle East. In
in May. general, some trade in high value agricultural products was affected in countries experiencing labor shortages to
2016 2017 2018 2019 2020
harvest horticultural crops (e.g., Europe), despite high demand and prices for some of these products.
Trade finance is expected to be disrupted, requiring greater US dollar liquidity to keep critical supply chains working.
Commodity traders are leaning towards direct cash transfers as trade finance conditions worsen and credit facilities
210 dry up, even though global interest rates have decreased and central banks are pumping liquidity in efforts to
revive economies.
200
190
BILATERAL FOOD TRADE
Food Price Index
180
170 Although international markets remained well supplied and food commodity prices stable, export-restricting policies
160 introduced by several major exporters of staple commodities have raised concerns among the importers. That
being said, Iraq’s major risks do not stem from exogenous shocks as much as from indigenous factors arising from
150
lack of liquidity and localized supply chain disruptions caused by ongoing domestic challenges. Turkey and Iran
140 remain the most important bilateral food trade partners, although part of the trade flows are informal (including
130 cross-border smuggling). In an effort to protect domestic producers, MoA imposed an import ban on 25 agricultural
and animal products. However, agricultural products particularly from Iran and Syria continue to be sold to Iraq
120
due to macroeconomic problems in the countries of origin. In Syria, in September 2019, USD 1 was traded for SYP
6/2019
7/2019
8/2019
9/2019
10/2019
11/2019
12/2019
1/2020
2/2020
3/2019
4/2019
5/2019
600, while in May 2020 it was exchanged for SYP 1 550. Iraq continues to peg its Iraqi Dinar to the US Dollar. While
smuggled products put a downward pressure on prices, thus benefiting the Iraqi consumers, Iraqi producers
complain of unfair competition and lower returns for farmers. Payments for smuggled goods also contribute to
Month/Year the depletion of foreign currency reserves.
Iraq is heavily dependent on imports (estimated at around 50% of food needs). With the exception of rice imports
Meat Price Index Dairy Price Index
from Vietnam, Iraq was not directly affected by export restrictions introduced by some exporting countries to
Cereals Price Index Oils Price Index
ensure stable supplies for their domestic markets. Even the effect of Vietnam’s initial rice export ban in March was
Sugar Price Index Photo/ Emilienne Malfatto
short lived; Vietnam replaced its export ban with an export quota in April and rice exports fully resumed from May.
1
http://pubdocs.worldbank.org/en/959181588615089571/CMO-Pink-Sheet-May-2020.pdf 2
https://www.wto.org/english/news_e/pres20_e/pr855_e.htm
8 9
Export restrictions in one country are likely to increase                               NATIONAL DEVELOPMENTS
competition for other origins. Although the Russian
Federation’s wheat export quota for the 2019/20                                         As of 30 June, the World Health Organization reported 49,109 cases in Iraq, with 1,943 fatalities. The number of
marketing year introduced in March 2020 contributed                                     COVID-19 cases in Iraq surged in late May, increasing by 171% while the global caseload increased 6%. From March,
to a temporary increase of global wheat prices in April,                                the government has enforced movement restrictions and curfews in an attempt to slow transmission of the virus.
Iraq does not import from the Russian Federation. In
                                                                                        Responding to the pandemic declaration by the WHO, the Government established a Crisis Cell Committee chaired
2019, wheat origins approved to participate in tenders
                                                                                        by the Ministry of Health and under the authority of Cabinet Order Decision No. 55 at the end of March. Each
issued by Iraq were the US, Canada, and Australia.
                                                                                        Ministry also formed their own Crisis Cell. The Prime Minister issued Order 151, which outlined committee
Before 2015, Kazakhstan, Russia and Romania were
                                                                                        membership. The Council of Ministers also formed the Supreme Committee for Health and National Safety. In April
also approved. Russia has been trying to regain entry
                                                                                        and May, Parliament and the established government committees and councils issued the following decisions:
into the Iraq market, but the prevalence of wheat smut
remains an obstacle. For the PDS program, long grain
rice is imported from approved origins such as the US,                                  Date                  Government Decision
Vietnam, Argentina and Uruguay. In addition, the
private sector also imports rice from India, Turkey, and                                                      The government of Iraq established the “Minha” grant programme for families impacted by
                                                                                        7 April 2020
Thailand.                                                                                                     COVID-19 restrictions. Cash disbursements under this programme began on 8 May 2020.

In addition to the main cereal exporters, other countries                                                     The Supreme Committee for Health and National Safety (SCHNS) excluded officials and
                                                                                        15 April 2020
put in place measures aimed at ensuring supplies for                                                          employees of the Ministries of Agriculture and Trade from curfew.
their domestic markets. For example, Syria put export
restrictions on eggs, cheese, yoghurt, processed cereal                                 15 April 2020         The Council of Ministers allowed agriculture tenants to delay the payment of land rental fees.
and beans, while Egypt banned pulse exports until 28
June. Turkey restricted the export of lemons until 31
August.                                                                                                       The Ministry of Planning (MoP) launched a National Food Security Project (2020—2022) in
                                                                                        22 April 2020
                                                                                                              Iraq to increase food self-sufficiency.
Despite a relatively small number of export restrictions
in place, policies requiring health checks and                                                                Parliament announced it would start implementing an emergency agriculture plan in light
                                                                                        3 May 2020
quarantines to prevent the spread of COVID-19 have                                                            of the COVID-19 pandemic.
resulted in delays at borders, increased transit times
and higher transportation costs.                                                                              SCHNS established a Food and Social Security team under the Ministry of Planning, with
                                                                                        20 May 2020           membership from other ministries and stakeholders, in addition to banning the import of
                                                                                                              watermelon, melon and green broad beans as local production could meet local demand.
                                                                                                              SCHNS announced that wheat and barley collection points would remain open to farmers,
                                                                                        31 May 2020
                                                                                                              despite planned curfews and movement restrictions.

                                                            Photo/ Emilienne Malfatto

10                                                                                                                                                                                                        11
FISCAL AND MONETARY PRESSURES
The country’s economy is affected by the decline in global oil prices, which is putting pressure on the national
budget. Oil revenues account for approximately 90% of the state’s total revenue. The 2020 budget was prepared
with the assumption of USD 56 per bbl of crude oil. The Iraqi economy is projected to contract by 9.7% in 2020,
down from a real GDP growth of 4.4% in 2019, with both oil and non-oil sectors contracting by 13% and 4.4%
respectively. Iraq did agree to an OPEC+ agreement to reduce oil production quotas in an attempt to stabilize
prices. Economic contraction is driven by low oil prices; and reduced local economic activity due to private sector
and government closures.
The unsustainable stimulus package introduced following the demonstrations in October 2019 — including
increasing public sector employment, lowering the retirement age, and providing various cash transfers —coupled
with weaker oil revenues are expected to have detrimental fiscal effects. Government transfers, particularly pensions
and PDS food rations, increased by 127% and 18% year-on-year respectively. Increased fiscal outlays have eroded
the buffers available to respond to the unexpected economic downturn in light of the COVID-19 pandemic. At the
current rate of spending, Iraq requires an oil price of USD 76 per bbl to finance its recurrent 2020 expenses.
If oil prices stabilize at USD 30 – 35 per bbl for the rest of 2020 and no reform measures are taken, the budget
deficit would exceed 29% of GDP in 2020 and gross financing needs would reach USD 67 billion, around 39% of
GDP. Under this scenario, Iraq will have to resort to a mixture of domestic and foreign sources to finance the deficit.
Heavy reliance on local banks will crowd out the available liquidity for private sector credit facilities, while borrowing
from international markets may prove to be difficult given global market conditions and a weak macroeconomic
framework in Iraq.
Financing the budget deficit and the current account deficit, estimated at 18.8% of GDP in 2020, while maintaining
the pegged exchange rate with the US dollar (unchanged since 2009) will put pressure on Iraq’s foreign currency
reserves. As for May 2020, foreign currency reserves can only cover up to 6 months of imports, exacerbating the
vulnerability of the country to external shocks and undermining the country’s ability to finance food imports and
local subsidy programs.
The upside of the current fiscal and monetary stress is that inflationary pressures remain largely muted due to
cheaper consumer goods. Additionally, Turkish and Iranian currencies continue to depreciate, affecting the two
main official trading partners of Iraq. Headline inflation, which is a measure of the total inflation within an economy         Photo/ Emilienne Malfatto

and includes commodities such as food and energy prices, remains under control and below 1%.
To mitigate the impact of the crisis on households and businesses, the CBI has introduced multiple measures, but
a larger stimulus package is still needed to re-start the economy. The CBI issued new operational modalities for             SUBSIDIES AND SOCIAL PROTECTION
banks to serve clients under the COVID 19-imposed curfew, and resumed its services for all payment systems and
the investment window on a daily basis. To boost liquidity in the market and support households and small and                Despite prioritizing salaries and pension payments for Iraqi government civil servant retirees, these payments were
medium enterprises (SMEs), the CBI applied a three-month moratorium on interest and principal repayments for                 slightly delayed in May due to fiscal pressure. The public sector remains the largest employer in Iraq – any delays
both consumer and SME loans, suspended all fines imposed on commercial banks, and enhanced banks’ cash                       or suspension of salaries and pensions, in addition to reduced incomes of employees in the private and informal
liquidity by IQD 1 trillion (approximately USD 840 million). It also suspended vendors’ commissions on electronic            sector, will impact household food expenditures, food markets and the food security of the country.
payment tools and reduced bank reserve requirements to 13% over the same period. While these steps will help                 Since the beginning of the year, the PDS cycles have been delayed by two months. The third PDS cycle for wheat
medium enterprises that have already digitized their payments and integrated with the banking economy, a large               flour was completed in May. The General Company for Grain Trade announced that in preparation for the fourth
majority of food businesses, especially those outside Baghdad and Erbil, remain cash-based and informal.                     cycle, mills are being supplied with 1.2 million metric tons of wheat (from local production) to produce 40 million
                                                                                                                             bags of flour. The lack of financial allocations is challenging the ability of the PDS to procure goods consistently,
                                                                                                                             including the four basic PDS items (rice, wheat, sugar, and vegetable oil) approved in the General Budget Law
                                                                                                                             passed in 2019. Nevertheless, MoT is continuing to distribute imported and locally produced flour and rice from
                                                                                                                             the reserves. Both oil and sugar will also continue to be distributed in the coming month, but only to families
                                                                                                                             registered as vulnerable under the MoLSA programme for social protection.
                                                                                                                             MoP and MoLSA continued their new COVID-19 response. MoLSA continued to distribute one-time cash assistance
                                                                                                                             under the “Minha” (“Grant”) program. MoLSA approved grants for 11.6 million people, the majority of the 12.3
                                                                                                                             million individuals who applied nationwide. The MoP Minha team simplified the mechanism to transfer IQD 30,000
                                                                                                                             cash per person to selected households, leveraging cash-out points that are located throughout the governorates
                                                                                                                             and approved by the Central Bank. Targeted households receive a text message (SMS) on their mobile phones,
                                                                                                                             informing them of their grant amount and the nearest cash-out point.
                                                                                                                             MoLSA announced that it allocated around USD 328 million to this year’s third round of regular social protection
                                                                                                                             assistance. This ongoing assistance will be distributed to roughly 1.3 million pre-registered households, reaching
                                                                                                                             about 6.5 million people.
                                                                                                                             In the Kurdistan Region, MoLSA of the Kurdish Regional Government distributed 178,000 food baskets to vulnerable
                                                                                                                             households against the planned 200,000 baskets in Erbil (70,000), Sulaymaniyah (58,000) and Duhok (50,000) over
                                                                                                                             the past weeks during the pandemic. A remaining 22,000 food baskets are yet to be distributed. Approximately
                                                                                                                             88,000 households who received a food basket were already registered recipients of the government’s social safety
                                                                                                                             net programmes. In addition, in April and for the very first time, MoMD distributed food baskets to refugee camps
                                                                                                                             throughout the Kurdistan Region, complementing its ongoing food distributions to families of internally displaced
                                                                                                                             people (IDPs).

12                                                                                                                                                                                                                                             13
III. FOOD
AVAILABILITY
FOOD PRODUCTION
Across Iraq, both wheat (mostly common bread) and barley are grown as winter cereal and are planted between
the end of October and early December to take advantage of seasonal winter rains. The winter cereal harvest starts
in the southern part of the country in April, and moves north as crops gradually mature (Figure 2). The bulk of the
cereal production – both in terms of area harvested and production volume – is collected in May and early June as
most fertile lands are located in the north and northeast parts of the country.
In the current agricultural year, no shortages of inputs were reported. Conditions for crop development have been
generally favourable across the country with timely and well distributed rains. The northern cereal producing belt
of Kirkuk, Ninewa and Sulaymaniyah governorates experienced an early autumn dryness until late November 2019,
but abundant precipitation starting in December significantly improved soil moisture content. In Ninewa, almost
all wheat and barley areas are rainfed. In Kirkuk, about one third of wheat and two thirds of barley areas are rainfed.
Elsewhere in the country, only a small share of cereals is cultivated as rainfed, and supplementary irrigation is
required.
A number of localised pest outbreaks were recorded in April and May, but the estimated damages do not exceed
average levels. For example, Desert Locusts were reported in eight governorates in the center and south, but
government control operations limited their spread. Fires in cereal crop fields also proved a challenge; however,
these incidences are not uncommon in the country and most are accidental. From 21 April to 29 May, the Civil
Defense Directorate reported 207 fires, with 2,140 ha of cropland burned and 34,579 ha rescued. In comparison
to the same period last year, the number of fires has decreased by approximately 17% and the hectares burned
decreased by around 73%.
As of 19 May, Iraq’s grain board has procured about 1.36 million tons of local wheat since the start of purchasing
on 16 April, an increase from the 542,000 tons purchased by 9 May. This indicates that harvesting shifted towards
more productive, northern areas. In the first half of April, winter cereal crops in the most southern governorates
of Basra, Thi-Qar, Muthanna, Qadissiya, Karbala and parts of Maysan and Babil were harvested. In the second half
of April, harvesting activities moved towards the central region, including Salah-al-Din and Diyala. In Ninewa
governorate, which produces more than a third of total wheat and barley output combined, harvesting started in
the second dekade of May. Figure 3A illustrates decreasing NDVI in Ninewa as the crops matured, reaching
postharvest levels later than the south. For example, harvesting activities were already completed in Wassit in the
first dekade of May (Figure 3B).
Iraq - Wassit - Crop Area Iraq - Wassit - Crop Area
2019 2020 Avg (84-15) 2019 2020 Avg (84-15)
METOP: Normalized Difference Vegetation Index
METOP: Normalized Difference Vegetation Index
0.9 0.9
0.8 0.8
0.7 0.7
0.6 0.6
0.5 0.5
0.4 0.4
0.3 0.3
0.2 0.2
0.1 0.1
0 0
J1 F1 M1 A1 M1 J1 J1 A1 S1 O1 N1 D1 J1 F1 M1 A1 M1 J1 J1 A1 S1 O1 N1 D1
Month and Dekad Month and Dekad
Figure 2: Average progress of the growing season with a comparison of i) the second dekade of April to ii) the second dekade of May,
where each pixel represents the long-term average of vegetation phenology. The vegetation progression is represented by a value between 0 Figure 3: Normalized Difference Vegetation Index for 2020, 2019 and the long-term average (1984-2015) in a) Ninewa Governorate and
and 100% (i.e. 50%is the midpoint of the growing season). b) Wassit Governorate.
Source: http://www.fao.org/giews/earthobservation/country/index.jsp?lang=en&code=IRQ# Source: http://www.fao.org/giews/earthobservation/country/index.jsp?lang=en&code=IRQ
14 15
FOOD IMPORTS AND RESERVES
At the end of March, MoT advised the Cabinet that it needed to import one million tons of wheat and 250,000 tons
of rice for the Public Distribution System and to boost strategic stocks ahead of the new harvest. As of December
IV. FOOD ACCESS
AND STABILITY
2019, the country planned to import 750,000 tons of wheat. Tenders might have been suspended due to budget
approval delays.
MoT reported that it currently has two months of supplies for the PDS. Currently, MoT is processing five million
bags of wheat and other food items per month, prioritizing people whose livelihoods were impacted by lockdowns.
MoT staff and flour processing companies have been granted special waivers to move during curfews in order to
continue operations. FOOD PRICE TRENDS
With above average domestic production, depending on the quality of the wheat purchased, it is estimated that Temporary price surges during the last two weeks of March in certain parts of the country were primarily attributed
Iraq has sufficient wheat stocks to cover its food needs at least until autumn 2020. The 2020 domestic wheat to panic-purchase around the COVID-19 mitigation measures such as curfew and stay-at-home instructions. With
production is estimated at 4.5 million tons. For the 2020–21 marketing year (July–June), the wheat import requirement strict price control measures taken by the government including increased spot visits, prices started stabilizing in
is estimated at 2.7 million tons, which will mostly be imported as flour (finished product). April and continued in May. However, some predictable spikes associated with seasonality of production were
Current in-country rice stocks are around 190,000 tons, corresponding to two months of PDS distributions. Iraq observed in April; however, those prices eventually started normalizing during May. For example, the 23% increase
produces on average around 270,000 tons of rice, and is estimated to need around 1.3 million tons of rice imports, in tomato prices in April had dropped by 28% in May.
worth around USD 674 million, based 2019 trends. 62% of the rice imports derive from India. Irrigated rice is
produced in Iraq and the harvest takes place at the end of October. Local and imported rice are not direct substitutes Figure 4: Food Price Trends from February to May
as they are utilized for different types of dishes.
Import dependency ratio captures in a simplified manner the share of total commodity supply in a country which
1,800
has been imported in a marketing year.3 For wheat, between 2000/01 and 2009/10, the import dependency ratio
averaged at 58%. In the last decade, it ranged from 34-65%, depending on the size of the domestic harvest. For the 1,600
2020/21 marketing year (July/June), it is estimated at 38%, slightly above 34% in the 2019/20 marketing year. Import
dependency for rice in 2020/21 is estimated at 77%. 1,400
1,200
Price (IQD/KG)
1,000
800
600
400
200
Feb Mar Apr May
Tomatoes Potatoes Onions
Figure 5: Price trends for the Cash-Based Transfer Food Basket and
Survival Minimum Expenditure Basket
Further to the developments on the global cereal
markets discussed earlier, the average retail price of 120,000
wheat flour when compared year on year (y/y) was also
21% higher in April in Iraq. During April, three out of 100,000
23 different food commodities recorded more than a
10% month on month (m/m) increase. Five commodities 80,000
increased between 5-10% (m/m). The highest m/m
increase was observed in the prices of tomatoes (24%)
60,000
and beans (15%). The highest y/y increase is recorded
in the price of eggs (28%).
40,000
While comparing May prices to April, WFP’s Cash-Based
Transfer Food Basket (2,100kcal per person per month)
20,000
witnessed an average 2% (m/m) decrease. The highest
m/m decreases in Food Basket prices were observed
in Diyala (-14%) and Anbar (-12%) while the highest
Jan 20 Feb 20 Mar 20 Apr 20 May 20
Photo/ Emilienne Malfatto m/m increase was observed in Ninewa (6%). The
highest (y/y) increase was observed in Qadissiya. CBT Food Basket SMEB
3
Import dependency ratio (IDR) is defined as: IDR = imports x 100/(production + imports - exports). The complement of this ratio to 100 would represent that part of the domestic food
supply that has been produced in the country itself. However, there is a caveat to be kept in mind: these ratios hold only if imports are mainly used for domestic utilization and are
16 not re-exported.(http://www.fao.org/3/i2493e/i2493e06.pdf) 17
LOCAL MARKET TRENDS

WFP’s mVAM system in Iraq monitors various aspects of market functionality every two weeks by calling around 225
retailers from all over the country (at least 12 retailers from every governorate capital are interviewed). It uses a
reduced version of WFP’s Market Functionality Index (MFI), specifically designed for telephonic interviews. On a scale
of 0-10, with 10 being the highest, the MFI reports on multi-sectoral assortment, availability, prices and resilience
aspects of a market. The mVAM tracks commodities in three main categories including cereals, other foods, and
non-food items. Data collection started on 18 April and by 30 May had completed three rounds. During the third
round (23-30 May), MFI data was collected from 222 retailers across all 18 governorates. Most retailers (66%) were
general stores (selling food and non-food items); however, around 34% of shops were specialized. The analysis of
round 3 data revealed that the overall market functionality is improving in Iraq. The overall MFI score improved from
6.5 during round 2, to 7.2 during round 3. The Kirkuk market had the lowest overall MFI score of 5.
On the scale of 0-10, both availability and market resilience scored 9.7, which showed very good availability of food
and non-food items, with markets being resilient enough to replenish their stocks within a week, when needed. The
overall multisectoral assortment and prices scored 8.8 and 5.9 respectively, which are a reflection of markets now
opening for Non-Food Items as well, and price levels also improving. Price stability is still a challenge where most
retailers are uncertain of future prices.

        Kirkuk       5.1
  Salah al-Din             5.5
       Thi-Qar                   5.8
     Muthanna                    5.8
Sulaymaniyah                           5.9
       Missan                          5.9
     Qadissiya                         5.9
      Baghdad                                6.1
        Anbar                                6.1
        Wasslt                                               7.0
       Basrah                                                7.0
         Babil                                                                 7.6
       Kerbala                                                                                             8.7
        Diyala                                                                                             8.7
         Najaf                                                                                             8.7
       Ninewa                                                                                                        9.4
        Dahuk                                                                                                              10        Resilience: The supply chain resilience dimension of MFI
         Erbil                                                                                                             10        evaluates both responsiveness and vulnerability of the
                                                                                                                                     supply chain however, the mobile VAM reports only the
                 5                            6                     7                       8                    9              10
                                                                                                                                     responsiveness. Resilient supply chains underpin the

                                                                                                                                                                                                                   47%
                                                                                                                                     regular supply of a market, which receives and stocks
                                                                   Market Functionality Index
                                                                                                                                     goods despite potential disruptions - essential for good
                                                                                                                                     and consistent functioning. During May, all the
                                                                                                                                     marketplaces across Iraq reported perfect resilience
                                                                                                                                                                                                                   35%
Figure 6: Market functionality index by governorate, where 10 is strong, 0 is poor market functionality.
Source: WFP                                                                                                                          scores (10 out of 10), except Kirkuk – which stands at 5.
                                                                                                                                     The retailers interviewed reported enough stocks for at
Multi-sectoral Assortments: The above multi-sectoral assortment or “assortment of essential goods” dimension
indicates which classes of goods, to meet essential needs, can be purchased in a marketplace and how much choice
                                                                                                                                     least one week, and they were also confident of
                                                                                                                                     replenishing their stocks within one-week’s time when                         18%
                                                                                                                                     needed.
is offered. The classes of essential goods include food, shelter, basic household items, safe drinking water, sanitation
and hygiene (WASH) and healthcare. The assortment score in Iraq was recorded at 8.8 during round 3.                                  COVID-19 Mitigations/Challenges: Providing hand sanitizer
                                                                                                                                     to the customers and the use of masks are reportedly the
Availability: The availability pillar refers to the physical presence of goods in the market in sufficient quantities. It
                                                                                                                                     most common precautionary measures. Some retailers
assesses whether certain products are scarce, or likely to get scarcer in the short run. Although the availability
                                                                                                                                     also reported reducing working hours to mitigate the
score at the national level was 9.7 reflecting very good availability of food and non-food items in markets across
                                                                                                                                     spread of COVID-19. Movement restrictions and                Figure 7: Retail sales over a two-week period.
the country, the lowest availability score reported was in Salah al-Din (6.7).
                                                                                                                                     checkpoints were reported as the biggest challenges while
Prices: The price dimension of the MFI measures two basic features of the price pillar, i.e. price trend/level, and                  some also reported reduced demand and liquidity
price volatility/stability. The first is associated with price change (how the prices changed as compared to the                     challenges. Some retailers, mainly from Kirkuk, Qadissiya,     Retailers whose sales increased
previous month) and the second with predictability (if the retailers can predict prices of the items they sell, for the              Maysan and Sulaymaniyah reported a decrease in their
next week). The MFI analysis of round 3 data shows that markets in Anbar, Muthanna, Qadissiya, Kirkuk, Baghdad,                      sales over the previous two weeks while retailers from         Retailers whose sales decreased
Thi-Qar, Maysan, Salah al-Din and Sulaymaniyah scored the lowest under the price pillar of the MFI. The main driver                  Anbar and Wassit reported an increase. Most retailers          Retailers whose sales remained unchanged
was price volatility, and that retailers were unable to predict the prices of the items they were selling the following              from Najaf, Karbala and Diyala reported no change in their     over the previous two weeks
week.                                                                                                                                sales.

18                                                                                                                                                                                                                                                 19
HOUSEHOLD FOOD CONSUMPTION
To monitor the impacts of COVID-19 on food security, WFP’s mVAM system started collecting household level data
on 18 April, through telephonic interviews. Statistically significant data is collected daily, to monitor various food
security indicators including Food Consumption Score (FCS), Food Based Coping Strategies (rCSI) and other aspects
including health and access to health services. The mVAM data enables food security monitoring in the context of
COVID-19 at the governorate level. During the May round of interviews, around 1,625 responses were collected
from all 18 governorates including 30% female respondents. Around 77% of respondents were from urban settings,
which is in line with the national rural-urban divide.
DOHUK
ERBIL
NAINAWA
SULAIMANIYAH
KIRKUK
SALAH AL-DEEN
Figure 8: Prevalence of insufficient food consumption
< 5%
5%-10%
DIYALA
ANBAR
BAGHDAD
>10%
WASIT
KERBELA BABYLON
QADISIYA MAYSAN
THI-QAR
NAJAF
BASRAH
MUTHANNA
Photo/ Emilienne Malfatto
Around 4.6% of the surveyed households were found to have insufficient food consumption levels, with the highest HOUSEHOLD INCOME AND COPING STRATEGIES
prevalence in Babil (15.5%), Kirkuk (10.3%) and Qadissiya (8.5%). In comparison, during April the percentage of
households with insufficient consumption was 7%. The consumption patterns improved during the month of Around 4.8 million people (12% of the total population) are using negative coping strategies to meet their food
Ramadan because religious charities provided assistance (known as zakat). Insufficient food consumption refers needs. This is where negative coping refers to the Integrated Food Security Phase Classification threshold (rCSI>=19).
to poor and borderline consumption levels, according to FCS based on seven days recall. Around 19% of the The graph below shows the use of various food-based coping strategies employed during April. Higher proportions
respondents indicated that the primary source of their cereals is the PDS, humanitarian assistance or other social of people adopting negative coping strategies were found in Babil (39%) and Diyala (31%).
safety nets. The prevalence of insufficient food consumption among IDP populations was recorded at around 20%
during April. 100%
Access Challenges: Around 29% of respondents reported that they are facing challenges to access market/grocery
80%
stores, primarily because of movement restrictions and shop closures because of COVID-19 mitigation measures.
Meanwhile, 11% of respondent households reported challenges accessing health services, mainly because of travel 60%
restrictions. 61% did not have any need to access the health services.
40%
CCI designed and introduced a Beneficiary Market Perspectives Survey to understand changes in the markets
experienced by vulnerable households in conflict-affected areas. Every week, CCI assesses 160 households, targeting 20%
10 households per district across five governorates (Anbar, Diyala, Kirkuk, Ninewa, and Salah al-Din). CCI makes
sure to assess new households each week, to avoid assessment fatigue, mitigate attrition rates and determine if 0%
households are similarly affected by COVID-19. Rely on less Borrow food Limit portion size Reduce number Restrict adults
Data collected on essential items between 6 April and 11 May showed that the most common items purchased by
households at this time were detergent, soap, vegetable oil, disinfectant solution and rice. 70% of households Figure 9: Prevalence of food-based coping strategies nationwide. Coping strategy used Not used
reported an increase in the price of one item or more compared to normal prices. More than half the households
Source: WFP mVAM
surveyed reported that the price of rice, lentils, wheat flour and vegetable oil had increased. On average, 48% of
households interviewed reported shortages in one item or more. The items where shortages were most frequently
seen were disinfectant, lentils, detergent, rice and vegetable oil. Over this period, an average of 9% of households As the COVID-19 pandemic continues to evolve, FAO, IFAD, WFP and the World Bank will continue to monitor the
reported that their local shop was closed. Of those whose local shop was closed, 12% reported they had no other impact of the crisis on food security in Iraq and provide policy recommendations to safeguard the agriculture and
accessible shop open, which was of concern. food sector.
20 21ACRONYMS
CBI Central Bank of Iraq
CBT Cash-based transfers
CCI Cash Consortium of Iraq
FAO Food and Agriculture Organization of the United Nations
FCS Food Consumption Score
FPI Food Price Index
GDP Gross Domestic Product
HRW Hard red winter, a type of wheat
IDP Internally Displaced People
IDR Import Dependency Ratio
IFAD International Fund for Agricultural Development
IQD Iraqi Dinar
ISIL Islamic State of Iraq and the Levant
MFI Market Functionality Index
MoA Ministry of Agriculture
MoLSA Ministry of Labor and Social Affairs
MoMD Ministry of Migration and Displacement
MoP Ministry of Planning
MoT Ministry of Trade
m/m month on month
mVAM mobile Vulnerability Analysis and Mapping
NDVI Normalized Difference Vegetation Index
OPEC Organization of the Petroleum Exporting Countries
PDS Public Distribution System of food rations
rCSI reduced Coping Strategy Index (food based coping strategies)
SCHNS Supreme Committee for Health and National Safety
SMEs Small and Medium Enterprises
SMEB Survival Minimum Expenditure Basket
SYP Syrian Pound
USD United States dollar
VAM Vulnerability Analysis and Mapping
WASH Water, Sanitation and Hygiene
WFP United Nations World Food Programme
WHO World Health Organization
y/y year on year
Photo/ Emilienne Malfatto
22Contacts:
Dr Salah ElHajjhassan, FAO Representative to Iraq
salah.elhajjhassan@fao.org
Tarek Ahmed, IFAD Iraq Representative
t.ahmed@ifad.org
Abdirahman Meygag, WFP Iraq Representative
abdirahman.meygag@wfp.org
Timothy D. Robertson, World Bank Agriculture and Food Global Practice
trobertson@worldbank.org
24You can also read