Impact of electricity market feedback on investments in solar photovoltaic and battery systems in Swedish single-family dwellings - Chalmers Research
←
→
Page content transcription
If your browser does not render page correctly, please read the page content below
Impact of electricity market feedback on investments in solar
photovoltaic and battery systems in Swedish single-family
dwellings
Downloaded from: https://research.chalmers.se, 2021-02-05 19:23 UTC

     Citation for the original published paper (version of record):
     Goop, J., Nyholm, E., Odenberger, M. et al (2021)
     Impact of electricity market feedback on investments in solar photovoltaic and battery systems
     in Swedish single-family dwellings
     Renewable Energy, 163: 1078-1091
     http://dx.doi.org/10.1016/j.renene.2020.06.153

N.B. When citing this work, cite the original published paper.

research.chalmers.se offers the possibility of retrieving research publications produced at Chalmers University of Technology.
It covers all kind of research output: articles, dissertations, conference papers, reports etc. since 2004.
research.chalmers.se is administrated and maintained by Chalmers Library

                                           (article starts on next page)
Renewable Energy 163 (2021) 1078e1091

                                                           Contents lists available at ScienceDirect

                                                                Renewable Energy
                                            journal homepage: www.elsevier.com/locate/renene

Impact of electricity market feedback on investments in solar
photovoltaic and battery systems in Swedish single-family dwellings
Joel Goop *, Emil Nyholm , Mikael Odenberger , Filip Johnsson
                                                                                     €teborg, Sweden
Department of Energy and Environment Chalmers, University of Technology, SE-412 96, Go

a r t i c l e i n f o                                 a b s t r a c t

Article history:                                      The profitability of investments in photovoltaics (PVs) and batteries in private households depends on
Received 15 July 2019                                 the market price of electricity, which in turn is affected by the investments made in and the usage of PVs
Received in revised form                              and batteries. This creates a feedback mechanism between the centralised electricity generation system,
16 May 2020
                                                      and household investments in PVs and batteries. To investigate this feedback effect, we connect a local
Accepted 30 June 2020
                                                      optimisation model for household investments with a European power generation dispatch model. The
                                                      local optimisation is based on the consumption profiles measured for 2104 Swedish households. The
Keywords:
                                                      modelling compares three different scenarios for the centralised electricity supply system in Year 2032,
Solar power
Batteries
                                                      as well as several sensitivity cases. Our results show total investment levels of 5e20 GWp of PV and 0.01
Energy systems modelling                              e10 GWh of battery storage capacity in Swedish households in the investigated cases. These levels are up
                                                      to 33% lower than before market feedback is taken into account. The profitability of PV investments is
                                                      affected most by the price of electricity and the assumptions made regarding grid tariffs and taxes. The
                                                      value of investments in batteries depends on both the benefits of increased self-consumption of PV
                                                      electricity and market arbitrage.
                                                        © 2020 The Authors. Published by Elsevier Ltd. This is an open access article under the CC BY license
                                                                                                                   (http://creativecommons.org/licenses/by/4.0/).

1. Introduction                                                                        systems for households, have been studied extensively. Hoppmann
                                                                                       et al. [5], having reviewed the literature, have reported a lack of
    Distributed generation in the form of solar photovoltaics (PVs)                    studies that optimise in economic terms investments in the com-
in combination with battery storage has the potential to be an                         bination of PVs and batteries. They have also performed a model-
important part of a future sustainable electricity system. The global                  ling analysis to identify the cost-optimal combination of
installed capacity of PVs has increased dramatically over the last 10                  investments in PV and batteries, using one standardised household
years, concomitant with drastic reductions in production costs [1].                    load profile that was retrieved from a utility and an electricity tariff
Given the grid parity effect, PVs may become competitive sooner at                     that is constant across each year, but changes from year to year over
the residential level than at utility scale. Batteries have also                       the life-time of the investments. Hoppmann et al. [5] found that
decreased substantially in cost in recent years [2] and are becoming                   investments in battery storage are already economically viable for
an increasingly attractive option to increase self-consumption of                      small residential PV systems given 2013 costs. For future PV and
the electricity produced by PVs. Although high usage of PVs and                        battery investment costs they concluded that there is considerable
batteries at the residential level could be crucial for the transition to              potentials for investments in both PV and batteries for all analyzed
a sustainable electricity system, it could also have a disruptive ef-                  future electricity price scenarios. Mulder et al. [6] have modelled
fect on the functioning of the electricity system and the market                       the dimensioning of combined PV and battery systems using 65
through, e.g., an increased need for fast-ramping generation ca-                       household demand profiles and a fixed electricity purchase tariff
pacity and restructuring of distribution grid tariffs [3,4]. Therefore,                that includes a self-consumption bonus, where the electricity price
it is an important topic for research.                                                 also changes over the life-time of the investments. In addition, they
    The sizing and economic viability of combined PV and battery                       have examined the tariff systems used in many European countries
                                                                                       and have concluded that several countries are moving towards
                                                                                       hourly pricing and that studies that target years after Year 2020
                                                                                       should be based on dynamic pricing. Mulder et al. [6] concluded
 * Corresponding author.                                                               that in order to make PV-battery system investments economically
   E-mail address: joel.goop@chalmers.se (J. Goop).

https://doi.org/10.1016/j.renene.2020.06.153
0960-1481/© 2020 The Authors. Published by Elsevier Ltd. This is an open access article under the CC BY license (http://creativecommons.org/licenses/by/4.0/).
J. Goop, E. Nyholm, M. Odenberger et al.                                                                                     Renewable Energy 163 (2021) 1078e1091

viable without subsidies both an annual electricity price increase of           significantly affect the diffusion of PV technologies.
4e6% and reduced PV and battery costs compared to their base year                   Some previous studies have implemented iterative approaches
of 2012 are required. Cucchiella et al. [7] have investigated the               so as to couple the household level to the system level centralised
sizing of residential PV and battery systems while assuming a pre-              dispatch. For example, Tapia-Ahumada et al. [21] have investigated
determined self-consumption share that is dependent upon the                    the system effects of large-scale penetration of micro-combined
ratio of PV array size to battery size based on information from the            heat and power (micro-CHP) at the household level by iterating
literature. They have assumed a fixed electricity tariff per year. They          between a unit commitment model and a local household model,
conclude that the level of self-consumption is important for the                thereby optimising the operation of the micro-CHP based on elec-
profitability of a PV system in cases without subsides for PV.                   tricity prices derived from the unit commitment model. Patteeuw
However, batteries are found to be unprofitable in the scenarios                 et al. [22] have compared different approaches to modelling the
investigated.                                                                   demand response of electric heating loads, performing iterations
    Ren et al. [8] have investigated the energy consumption and bill            between a unit commitment and dispatch model, so as to represent
savings from PV battery systems in Australian houses under several              the supply-side effects and a local demand-side model taking into
different tariff structures, PV sizes, and battery sizes. They found            account the electricity prices from the supply-side model. While
that with a PV-panel alone a flat rate retail energy price resulted in           these iterative methods can account for the feedback effects be-
the greatest bill savings. With the inclusion of a battery in                   tween the demand and supply sides in the electricity system, they
conjunction with a PV-panel critical peak pricing showed the                    have not been applied to the modelling of investments in
greatest savings, i.e., a more dynamic electricity price was benefi-             household-level PV/battery systems.
cial for battery investments. Khalilpour and Vassallo [9] conducted                 The previous studies have focused either on sizing PV and bat-
a techno-economic parametric analysis of PV-battery systems in                  tery systems using fixed electricity tariffs or investigating the role
Australian households, examining, e.g., tariff levels, PV/battery               of PVs in least-cost scenarios for the future electricity system.
costs, and household load profiles. For the various scenarios                    However, large-scale investments in PV and batteries in households
investigated, their results showed that battery costs below                     could have a significant impact on the electricity market which in
$750 per kWh were required for a positive impact on net present                 turn might affect the profitability of those household investments.
value. Furthermore, they found that the magnitude of the house-                 We identified a need for a modelling analysis of this feed-back
holds’ electricity purchase price and the selling price of excess               interaction. Therefore, we apply an iterative approach that com-
generation from the PV system had a major impact on the value of a              bines a cost-minimising investment model for households with an
battery, with a smaller magnitude being detrimental to battery                  electricity dispatch model to model the impact of household PV
investments. Talent and Du [10] optimised the economic sizing of                investments on the electricity price. The household model is
PV and batteries for one residential and one commercial consumer                applied to Sweden using measured hourly electricity consumption
in Australia. Two different tariff structures were investigated, one            profiles from 2104 households and is iteratively coupled to the
time-of-use structure and one demand tariff structure, with a po-               Electric POwer Dispatch (EPOD) model, which encompasses
wer tariff included in the demand tariff. The electricity prices re-            northern Europe. The modelling is performed for Year 2032 and the
flected current (2017) prices. They found that large PV investments              capacity mix used in the dispatch model is derived using the
and no battery investments are the cost optimal solution for the                ELectricity INvestment (ELIN) model.
investigated cases. Although battery investments are not cost                       Using this approach, we study how the profitability of PV and
optimal, PV-battery systems can still be economically preferable to             battery investments in households is affected by the feed-back
purchasing all electricity from the grid. Koskela et al. [11] investi-          mechanism in conjunction with the electricity market, and how
gate the economic incentives for investing in PV-battery systems                household PV and battery systems will affect the dispatch of cen-
for both apartment buildings and detached houses in Finland given               tralised power plants and the marginal cost of electricity. In contrast
different PV costs, battery costs and electricity tariff structures.            to most of the previous PV and battery dimensioning studies, we
They use an hourly market-price-based tariff based on day-ahead                 apply an hourly pricing regime which is important for future studies
area prices for Finland in the Nordic electricity market and                    as more and more countries are moving towards hourly tariff sys-
different tariffs for the distribution grid costs, but do not account           tems [6]. Furthermore, we use a large number of measured house-
for any feedback between decisions of households and the market.                hold electricity consumption profiles with hourly resolution.
They conclude that PV battery installations can be profitable in
Finish conditions, however, this profitability is highly dependent on            2. Methodology
the structure of the electricity and distribution grid tariffs.
    There are several other studies which investigate households                    We apply an iterative approach to investigate the feedback ef-
economic incentives for investing in PV-battery systems [12e18]. The            fects between the power system dispatch and investment and
conclusions reached differ depending on local conditions, e.g., annual          operation of PVs and batteries in households. The iterative pro-
solar PV electricity generation, electricity price structures, and              cedure involves three modelling tools: the ELIN model; the EPOD
assumed PV and battery prices. However, none of the papers account              model; and a household-level PV and battery investment model for
for the interaction between the large-scale household investments in            southern Sweden.
PV and batteries and the surrounding electricity system.                            The geographical areas covered by each of the three modelling
    Other studies have taken a different approach and investigated              tools are distinct. The ELIN model, which generates the capacity
the attractiveness of solar PVs and storage from the systems                    mix for the centralised electricity system as well as investments in
perspective. Pietzcker et al. [19] have used the REMIND model to                transmission capacity between neighbouring regions, and is run
propose that solar power might dominate the global electricity mix              only once per scenario, includes all the regions of the EU-27,1
by Year 2100. Mileva et al. [20] have also demonstrated, using the              Norway, and Switzerland. By including the full geographical area
SWITCH model, that solar power can cost-effectively cover over a                in the ELIN model, the generation as well as transmission capacity
third of the electricity demand in the Western US electricity system            investments take into account trade patterns throughout the entire
by Year 2050, assuming that the US Department of Energy’s cost
target of $1 per Wp for solar PVs is reached. However, these studies
                                                                                 1
do not take into account the household perspective, which could                      Excluding the electrically isolated islands of Malta and Cyprus.

                                                                         1079
J. Goop, E. Nyholm, M. Odenberger et al. Renewable Energy 163 (2021) 1078e1091
area.
For the EPOD model, which is run once per iteration, a subset of
regions comprising the Nordic countries and neighbouring coun-
tries is selected2 so as to shorten the computational times. Neigh-
bouring countries are included to account for their effect on the
marginal cost of electricity in Sweden, which is used as an input to
the household investment model. As the household investment
model only contains data from households in Swedish regions SE1
and SE2, it is only run for those particular regions. The geographical
scopes of the three modelling tools are shown in Fig. 1.
The iterative modelling procedure, which is illustrated in Fig. 2,
involves the following steps:
1. The ELIN model generates a development path for the electricity
generation system in the EU-27, Norway, and Switzerland up to
Year 2050 under different scenario-related assumptions.
Installed capacities for Year 2032 in the model regions are then
extracted from the ELIN results for each scenario and fed into
the EPOD model.
2. EPOD calculates the least-cost hourly dispatch over 1 year as
well as the marginal cost of electricity in each region of the
Nordic countries and neighbouring countries (see Fig. 1).
3. The hourly marginal costs of electricity are used as price curves
and transferred to the household investment model, which
determines the optimal investment in PV and battery capacity,
as well as the battery charge and discharge patterns for each of
the 2104 individual sample households in Swedish regions SE1
and SE2 (see Fig. 1).
4. The new household net loads (i.e., load plus battery charge
minus the PV electricity produced and battery discharge) are
scaled up to represent all single-family dwellings in SE1 and SE2, Fig. 1. Geographical scope chosen for the three modelling tools: the ELIN model; the
i.e., all represented households in these two regions are EPOD model; and the household-level PV and battery investment model.
assumed to participate and make investments that minimise
their own electricity costs.
5. The EPOD load curves for regions SE1 and SE2 are adjusted ac-
cording to the new household load.
6. Steps 2 to 2 are repeated until there is convergence or the with respect to CO2 emission targets and policies for CO2 abate-
maximum number of iterations is reached. ment and renewable energy beyond Year 2020, as well as in rela-
tion to the assumed development of the electricity demand in each
country up to Year 2050 (a summary of the differences in as-
sumptions between the scenarios can be found in Table A1). Im-
2.1. The ELIN model plicit to the scenarios is decarbonisation of the European electricity
supply, which entails decreasing CO2 emissions by 95% compared
To generate the mix of generation capacity in the European to Year 1990 for the Green Policy and Climate Market scenarios, and
electricity system in Year 2032, we use the ELIN model, which was 99% for the Regional Policy scenario. Furthermore, all the EU
originally created by Odenberger et al. [23], and further developed member states are assumed to reach the targets for renewable
by Go €ransson et al. [24]. The ELIN model identifies the cost-
electricity generation in Year 2020 stated in the National Renew-
minimal development of investments and production for central- able Energy Action Plans [30]. The scenarios are documented in
ised power plants as well as investments in inter-regional trans- greater detail by Unger et al. [31].
mission lines in the European electricity supply system up to Year
2050, given a description of the current power system in Europe
2.2. The EPOD model
and assumptions regarding the development of demand, CO2
emissions reduction targets and climate and renewable policies up
Once the capacity mix is extracted from the ELIN model, the linear
to Year 2050. The current power system capacity mix is taken from
cost-minimising EPOD model is used to obtain the marginal elec-
the Chalmers Power Plant Database [25], and existing transmission
tricity generation costs fed to the household model as price curves.
line capacity from the ENTSO-E [26e28]. The ELIN model covers the
The EPOD model was first presented by Unger and Odenberger [32]
EU-27 (excluding Malta and Cyprus), Norway, and Switzerland,
and developed and refined by Go €ransson et al. [24] and Goop et al.
divided into a total of 50 regions based primarily on transmission
[33]. In general, the EPOD model uses the same regional subdivision of
grid bottlenecks reported by the ENTSO-E [29] (see Fig. 1).
Europe as is used by the ELIN model. However, to reduce the
The ELIN model is run for the following three scenarios: Green
computational time required for the iterative procedure in the present
Policy; Regional Policy; and Climate Market. The scenarios differ
work, the EPOD model is run over a subset of regions consisting of the
Nordic countries and neighbouring countries (see Fig. 1). Electricity
2
Specifically, all regions that belong to Sweden, Norway, Finland, Denmark,
trading across the boundaries of the modelled area is set as fixed (for
Germany, Poland, Estonia, Latvia, Lithuania, the Netherlands, and the United each hour) to the result obtained from one initial EPOD model run that
Kingdom. spans all of the regions included in the ELIN runs (see Fig. 1).
1080J. Goop, E. Nyholm, M. Odenberger et al. Renewable Energy 163 (2021) 1078e1091
Nomenclature
Sets
I Model regions
Pi Plants (aggregates) in region i2I
T Time steps
N Subset of regions (i.e., N3I) that contain household load profiles
Hi Households in region i2N
Variables, EPOD
ctot Total running cost [MV]
ccycl Start-up and part-load costs in plant p2P; i2I at time t2T [MV]
p;t
gp;t Power generated in plant p2Pi ; i2I at time t2T [GWh]
qtrade Electricity exported from region i2I and j2I (negative in case of import from j to i) at time t2T [GWh]
i;j;t
Parameters, EPOD
run
Cp;t Specific fuel and O&M costs in plant p2P; i2I at time t2T [V/MWh]
Di;t Demand in region i2I at time t2T [GWh]
Variables, household model
ebought Electricity bought by household h2Hi ; i2N at time t2T [kWh]
h;t
esold Electricity sold by household h2Hi ; i2N at time t2T [kWh]
h;t
bh Battery investment in household h [kWh]
fh PV investment in household h [kWp]
uh Inverter investment in household h [kWp]
sadd Energy added to the battery in household h2Hi ; i2N at time t2T [kWh]
h;t
srem
h;t
Energy discharged from the battery in household h2Hi ; i2N at time t2T [kWh]
vh;t Electricity generated by PV-panel in household h2Hi ; i2N at time t2T [kWh]
lh;t Storage level of battery in household h2Hi ; i2N at time t2T [kWh]
Parameters, household model
buy
Pi;t Purchase price for electricity for region i2N at time t2T [V/MWh]
sell
Pi;t Selling price for electricity for region i2N at time t2T [V/MWh]
K bat Battery cost [V/kWh]
K PV PV cost [V/kWp]
K inv Inverter cost [V/kWp]
Abat Annuity factor, battery
APV Annuity factor, PVs
Ainv Annuity factor, inverter
Dh;t Demand for electricity in household h2Hi ; i2N at time t2T [kWh]
r Interest rate
n Investment life-time
hbat Battery discharge efficiency
The EPOD model minimises the total running cost as follows: function per unit change in the constraint constant (in this case the
demand) and is obtained directly from the solver as the optimal
X X X cycl
value of the dual variable corresponding to the constraint in
run
ctot ¼ Cp;t gp;t þ cp;t ; (1)
question.
i2I p2Pi t2T
where I is the set of all modelled regions, Pi is the set of plants 2.3. Household investment model
(aggregates) in region i, and T is the set of all time-steps. Further-
more, gp;t is the power generated in plant p at time t, crunp;t is the Given the electricity price that emanates from the EPOD model,
running cost (fuel costs plus variable operation and maintenance each of the 2104 households (see Section 2.4) in the household
cycl investment model can invest in a PV-panel and make decisions
costs), and cp;t is the sum of the start-up and part-load costs for
plant p at time t. regarding the size of the battery and the battery dispatch, thereby
To ensure that the demand is met in all the regions at all time- creating a new net load profile for each household. The profiles are
steps, the optimisation is subject to the following: then scaled up to represent the entire stock of single-family
dwellings in each represented region and fed to the EPOD model.
X X The household investment model minimises the total electricity
Di;t < gp;t þ qtrade
i;j;t ci2I; t2T; (2) cost for all households, as follows:
p2Pi j2I
X X X buy bought sell
jsi Ktot ¼ Pi;t , eh;t Pi;t , esold
h;t þ bh , K
bat
, Abat
i2N h2Hi t2T
where Di;t is the electricity demanded in region i at time t after
adjustment for electricity production and battery usage pattern in þ fh , K PV , APV þ uh , K inv , Ainv ; (3)
households, and qtrade
i;j;t is the quantity of electricity (positive or
where N3I represents the regions that contain household load
negative) traded between region i and j at time-step t. The marginal
buy
cost of generating electricity, which is assumed to represent the profiles and Hi is the set of households in region i. The term Pi;t is
market price, is extracted as the shadow price on the demand the price for buying electricity from the grid (including the elec-
constraint (2). The shadow price is the change in the objective tricity price from the EPOD model, VAT, energy tax, and variable
1081J. Goop, E. Nyholm, M. Odenberger et al. Renewable Energy 163 (2021) 1078e1091
Fig. 2. Flow chart illustrating the iterative procedure and the roles of the ELIN, EPOD, and household investment models. Solid lines represent the procedural flow and dashed lines
represent data transfer.
sell is the price for selling electricity to
distribution grid fees), and Pi;t variable sadd is the energy added to the battery and srem is the
h;t h;t
the grid (comprising the electricity price from the EPOD model and energy discharged from the battery for household h at time t. The
reimbursement from the distribution grid owner) in region i at time energy discharged is multiplied by the battery discharge efficiency,
t. The variable ebought
h;t
is the amount of electricity bought from the hbat , so as to capture energy losses resulting from operating the
battery. Furthermore, vh;t is the electricity generated by a PV-panel
grid, and esold
h;t
is the amount of electricity sold to the grid by
belonging to household h at time t.
household h at time t. For the investments, bh is the size of the
The charging and discharging of the battery are subject to:
battery investment, fh is the size of the PV-panel investment, and uh
is the size of the inverter investment made by household h. Note
h;t þ sh;t ,h
lh;t ¼ lh;t1 srem add bat
c h2Hi ; i2N; t2T; (6)
that the same inverter is assumed to be used by both the PV and the
battery. Furthermore, K bat is the cost of the battery, K PV is the cost where lh;t is the storage level of a battery belonging to household h
of the PV-panel, K inv is the cost of the inverter, and Abat , APV and at time t. The invested storage size limits the amount of energy that
Ainv represent the annuity factors for the battery, PV-panel and can be stored, as follows:
inverter, respectively. The annuity factor is defined as:
lh;t bh c i2N; h2Hi ; t2T: (7)
r
a¼ ; (4)
1 ð1 þ rÞn The power capacity (kW) of the battery is assumed to be equal to
the battery size (kWh), i.e., the battery can be fully charged from an
where r is the interest rate and n is the life-time of the investment. empty state in 1 h. The maximum size of the invested PV-panel in
Since the electricity demand for each household needs to be each household is limited to the size which generates the same
fulfilled, the optimisation is subject to: amount of annual electricity as the households annual electricity
consumption, as Swedish regulations do not allow households to
bought become annual net electricity producers. It should also be noted
Dh;t þ esold add
h;t þ sh;t ¼ eh;t þ vh;t
that simultaneous optimisation of all households is equivalent to
h;t ,h
þ srem bat
c h2Hi ; i2N; t2T; (5) optimising one household at a time, as there is no interdependency
of the households.
where Dh;t is the electricity demand from household h at time t. The Estimates and projections of PV investment costs differ widely
1082J. Goop, E. Nyholm, M. Odenberger et al. Renewable Energy 163 (2021) 1078e1091
Table 1 this discrepancy, all the statistical values are increased by 2.2%, which
Key assumptions regarding investment options in the household model. corresponds to the increase in the number of single-family dwellings
Technology Inv. Cost Life-time [years] observed between the two years. The scale factor for each scale-up
Battery 150 VkWh 12.5
heating equipment category is calculated by dividing the number of
PV 900 V/kWp 30 households from the statistical data by the number of households
Inverter 100 V/kWp 15 from the collected data for each EPOD model region. Table 3 shows the
resulting scale factors for each scale-up heating equipment category.
The actual number of buildings represented is approximately 800
between sources [34e37]. The IEA project the investment cost for times larger than the sample size of the collected data. This means that
building-mounted PV systems in Europe for Year 2030 as being a scale factor > 800 indicates that the category is under-represented
approximately 970 V/kWp [36], whereas the Danish Energy Agency in the collected data; conversely, a scale factor < 800 indicates an
project 830 V/kWp [34] for the same year. Tsiropoulos et al. [37] over-representation of the category in question. From Table 3 it is clear
summarised literature for 2030 cost projections for residential that households with electric heating are over-represented in the
battery solutions as being in the 100e650 V/kWh range. Based on measured data, especially in region SE1. All the heating categories,
these sources, we have assumed the investment costs and life- with the exception of “Others”, are more strongly represented in
times listed in Table 1. For batteries, we assume that the calendar households in region SE1 than in region SE2 (indicated by a higher
life-time rather than the cycle life-time will be the limiting factor, scale factor for SE1).
i.e., that no cost is incurred by cycling the battery. The scale-up is validated by comparing the total up-scaled
To summarize the drivers for households to invest in PVs and annual electricity consumption for heating with the correspond-
batteries, the incentives for households to invest in PVs are strongest ing values from the statistics dataset. The yearly electricity con-
when the electricity can be consumed in-house, since the value of sumption levels that result from the scale-up for the SE1 and SE2
the PV electricity is then the sum of the electricity spot price, taxes, regions are 3.78 TWh and 17.80 TWh, respectively. For Year 2012,
and grid fees. For surplus PV production, that must be sold to the the statistics for the two regions show electricity consumption
grid, the value is only the spot price. For investments in batteries, the levels of 3.79 TWh and 18.40 TWh for SE1 and SE2, respectively
incentives are firstly, in combination with PVs, to increase the [40]. In the statistics dataset, data are missing for some munici-
amount of in-house consumption of PV electricity, where the value palities. For these municipalities, data from Year 2009 is used. The
of each additional unit of electricity consumed in-house is the sum of Year 2009 data are corrected for inter-annual variations by
the taxes and grid fees. Secondly, if there is sufficient variations in assuming the same change in electricity demand as that of the
the electricity spot price, the battery can be used for arbitrage, i.e., to average municipality between Year 2009 and Year 2012. Overall,
buy at low prices and sell at high prices, where the value is the dif- the scale-up procedure is found to work well, although the scaled-
ference in price between the bought and the sold electricity. up annual electricity consumption level is 0.3% lower than the value
obtained from the statistics for region SE1 and 3.3% lower than that
2.4. Household load data obtained for region SE2. In addition to the replacement of missing
data, an error may arise in that the household profiles were
The household load profiles in the model are derived from 2104 measured from February to February while the statistics are pre-
measured hourly load profiles for Swedish single-family dwell- sented by calendar year, i.e., the electricity consumption levels in
ings.3 The measured load profiles are all located in modelling re- January might differ between the two datasets.
gions SE1 and SE2, so they only represent the households in these
regions. Nevertheless, 81% of the total Swedish electricity demand 2.5. Investigated scenarios and cases
and 89% of the Swedish single-family dwellings are located in these
regions. To represent the total single-family dwelling load in the The analysis described above (cf. Fig. 2) is performed for each of
two EPOD regions the 2104 measured profiles are scaled up to the three different scenarios for the centralised electricity genera-
represent the 1.7 million single-family dwellings that are present in tion system described above: the Green Policy scenario; the
the two regions. Regional Policy scenario; and the Climate Market scenario. In
The scale-up of the 2104 households is carried out by assigning a addition, we also investigate a case that is based on the Green
scale factor to each of the households in the dataset, i.e., a value that Policy scenario, but in which all the grid fees for households are
indicates the weight of the households with regards to the overall assumed to be fixed, i.e., variable grid fees are zero for all house-
building stock. The scale factor for each household profile is based on holds. This weakens the incentive for self-consumption of elec-
information collected about each household’s heating equipment and tricity, although the households still pay taxes for electricity bought
the total number of households that contain that specific heating from the grid. We denote this as the “Fixed Grid” case. To identify
equipment in the two EPOD model regions, according to statistical the factors that are significant for the results, the following sensi-
data provided by the Swedish Energy Agency [39]. In the collected tivity cases are also analyzed: a case with higher battery investment
data, each household has selected from 11 different choices for the costs (300 V/kWh); a case with lower battery investment cost
type of heating system used. The statistics (see Ref. [39]) also classify (90 V/kWh); and a case with higher solar PV investment costs
the heating equipment into 11 categories, although these do not (1200 V/kWp).
correspond directly to the categories in the collected data. Thus, the
categories are aggregated into six different heating equipment cate- 3. Results and discussion
gories used for the scale-up exercise. Table 2 shows the classification
of the collected and statistical data into the six categories used for the The total annual electricity generation between Year 2010 and
scale-up exercise. The statistical data are for Year 2010, whereas the Year 2050, as obtained from the ELIN model is shown in Fig. 3 for
measurements were conducted during Year 2012. To compensate for each scenario. The Green Policy scenario (Fig. 3a), in which we
assume a moderate growth in demand, is predominated by wind
power, with some solar power investments after Year 2035 and
3
The measurements where conducted by E.ON during the period from February some coal and gas power being used as bridging technologies. Note
2012 to February 2013. For further information, see Ref. [38]. that the solar power shown in the ELIN model results is only utility-
1083J. Goop, E. Nyholm, M. Odenberger et al. Renewable Energy 163 (2021) 1078e1091
Table 2
The different heat equipment categories used in the scale-up exercise and the classification of the heat equipment data from collected data and statistics into the scale-up
categories.
Scale up Collected data Statistics[39]
Electric heating Direct electric Direct electric
Electric furnace Hydronic electric
Heat pumps
Ground source heat pumps Ground source heat pump type 1 Ground source heat pump
Ground source heat pump type 2 Ground source heat pump þ electricity
Ground source heat pump þ biofuels
Biofuels Pellet fuels Biofuels
Firewood Biofuels þ electricity
District heating District heating District heating
Oil Oil Oil
Oil þ electricity
Others Gas Others
Passive houses
Table 3
Number of buildings in the measured data and the statistical data, and the calculated scale factor for each combination of heating category and region. Statistical data are
retrieved from the Swedish Energy Agency [39].
Number of buildings
Heating category Model region Collected data Statistical data Scale factor
Electric heating SE2 620 384,807 620.7
SE1 837 110,038 131.5
Ground source heat pumps SE2 290 265,066 914.0
SE1 132 36,616 277.4
Biofuels SE2 60 433,616 7226.9
SE1 55 70,810 1287.5
District heating SE2 36 163,923 4553.4
SE1 39 37,311 956.7
Oil SE2 0 17,814 e
SE1 1 4681 4681.0
Others SE2 30 127,531 4251.0
SE1 4 32,127 8031.8
scale and that the ELIN model makes no investments in distributed still gives a stable marginal cost during a substantial part of the year.
generation, i.e., household investments are added on top of the In both the Regional Policy and Climate Market scenarios, the hy-
capacity from the ELIN model. Existing nuclear power is assumed to dropower capacity is sufficient to maintain the marginal costs at a
be phased out after a life-time of 45 years and no re-investments stable level for almost all of the year. However, this level is signifi-
are made by the model. In the Regional Policy scenario (Fig. 3b), cantly higher in the Climate Market scenario, mainly due to the
growth in demand is assumed to be weak over the entire period. higher price of CO2 emissions allowances.
Furthermore, nuclear power plants remain operational for a longer In all the cases we investigate, there are significant investments in
time (a life-time of 60 years is assumed in the Regional Policy household PVs in the selected Swedish regions of SE1 and SE2. Fig. 5
scenario) and some re-investments are made after Year 2040. After shows the total investments in PVs and batteries in all households (i.e.,
Year 2040, the model also invests in carbon capture and storage in SE1 and SE2 combined) as a function of iteration number for each
(CCS) technologies, although renewable generation (and wind po- scenario as well as the Fixed Grid case, in which variable grid fees are
wer in particular) dominates the mix in Year 2050. The Climate assumed to be zero for all the households. The simulation is run for 10
Market scenario (Fig. 3c) exhibits a more diversified generation mix iterations for all cases, except the Green Policy scenario, where it is run
with significant amounts of variable renewables as well as large re- for 15 iterations to ensure that results remain stable. Note that all
investments in nuclear power and investments in CCS, both starting household investments in solar PVs are added on top of the capacity
as early as Year 2025. mix obtained from the ELIN model.
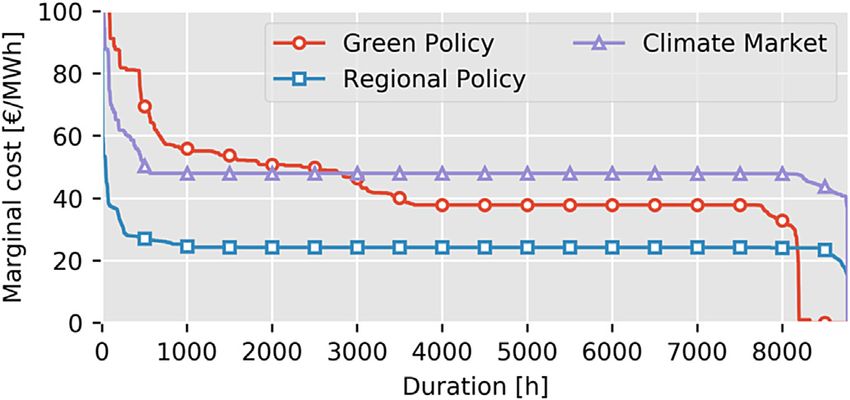
Moving now to the results from the iterative analysis, it is evident Owing to the differences in the marginal cost of electricity, the
that the marginal costs of electricity in Sweden from the EPOD levels of household investments in PVs and batteries differ signif-
model show significant differences between the three modelled icantly between the three scenarios. The only difference between
scenarios. Marginal cost duration curves for all three scenarios for the scenarios seen by the household investment model is the
region SE1 from the first iteration, i.e., before any household in- different marginal cost of electricity (treated as an electricity price
vestments, are shown in Fig. 4. The Green Policy scenario, which has in the household model). The largest investments in batteries,
high levels of wind power in the generation mix, demonstrates the approximately 10 GWh in total after the iterations, occur in the
most volatile marginal costs of the three scenarios. The presence of Green Policy and Climate Market scenarios. However, the installed
hydropower with reservoir storage in the Nordic system can level of PV capacity differs considerably between the two scenarios,
smoothen out marginal costs over extended periods of time, which with 13 GWp and 20 GWp installed respectively. The considerably
1084J. Goop, E. Nyholm, M. Odenberger et al. Renewable Energy 163 (2021) 1078e1091
Fig. 3. Evolution of the European electricity generation mix, as obtained from the ELIN model, for the three scenarios: (a) Green Policy; (b) Regional Policy; and (c) Climate Market.
The areas below the dashed line represent currently existing capacity and the areas above the line represents new investments made by the ELIN model.
This shows that profitability of investment in batteries can be
driven by both the potential for increased self-consumption of PV
electricity and market arbitrage.
However, we can also state that, in the Fixed Grid case, where
the system composition in the EPOD model is identical to that in
the Green Policy scenario (and which therefore has an identical
marginal cost in the first iteration), the removal of the variable grid
fee strongly decreases the profitability of investments in PVs and
also affects the profitability of investments batteries. This indicates
that both the self-consumption of PV electricity and price arbitrage
are drivers of household investments in battery capacity. The
lowest investment levels, 5 GWp of PVs and 0.5 GWh of battery
Fig. 4. Duration curves for the marginal cost of electricity in region SE1 from the first capacity, are noted for the Regional Policy scenario, where the
iteration, i.e., before any household investments, for the three scenarios: Green Policy;
Regional Policy; and Climate Market.
marginal cost of electricity is comparatively low and stable.
Taking feedback into account, i.e., looking at the effect of the it-
erations, we find that in the cases with a significant volatility in the
higher volatility in marginal cost seen in the Green Policy scenario,
marginal cost of electricity, market feedback has a strong dampening
as compared to the stable and on average somewhat higher mar-
effect on the levels of investment. In the Green Policy scenario, the
ginal cost in the Climate Market scenario, can thus drive large
capacities of both the batteries and PVs decrease by about a third
battery investments with considerably smaller PV investments.
after the iterations. However, in the Regional Policy scenario, in
1085J. Goop, E. Nyholm, M. Odenberger et al. Renewable Energy 163 (2021) 1078e1091
Fig. 5. Total household investments in PVs and batteries in MWp and MWh respectively for: (a) the Green Policy scenario; (b) the Regional Policy scenario; (c) the Climate Market
scenario; and (d) the Fixed Grid case, the latter of which is identical to the Green Policy scenario except that the variable grid fees are assumed to be zero for all the households.
which there are very low investments in batteries and where the PV Market scenarios have a significant impact on the market price of
investment is small compared with the other cases, the iterations electricity. Fig. 6 shows the duration curves for the difference in the
have no significant effect, indicating that investments at these levels marginal cost of electricity between iteration 1 and iteration 10 for
have little impact on marginal price formation. The Climate Market each of the four cases. In the Green Policy scenario, the average
scenario shows only a minor change between iterations. This could marginal cost of electricity is 3.1 V/MWh lower after household in-
in part be due to that a large segment of the households have vestments in PVs and batteries. The large investments in battery ca-
reached their maximum allowed solar PV size (due to the net con- pacity made in the Green Policy scenario, combined with the volatile
sumer regulations), i.e., the first iterations might have resulted in marginal costs, enable the number of high-price hours to be reduced.
larger investments if this limit was not present. It should be noted In the Climate Market scenario, the solar PVs and batteries mainly
that the effects on the dispatch and market prices from changes in cause a decrease in the stable base level of the marginal cost set by the
the household load profiles in Sweden are dampened by the avail- so-called “water value”, which is the marginal value of hydropower
ability of flexible hydropower. In a system that has a less flexible energy. The substantial PV investments also result in an increased
capacity mix in the centralised generation system, the feedback ef- number of hours with marginal costs of electricity close to 0. Fig. 6 also
fects are likely to be significantly stronger. shows that the marginal cost of electricity increases during some
Compared to the results presented in Ref. [5,6] the installed PV
and battery capacities per household are in general lower in our
results. However, the relative size between the PV panel and bat-
tery, i.e., the RBC, is of similar magnitude. In Mulder et al. the
installed capacity ranges between ALR 2e13 and RBC 0-1 for PVs
and batteries, respectively. The results from Ref. [5] corresponds to
the ranges ALR 4.5e31 and RBC 0.6e1.4. The lower values shown in
our study are most likely due to several different factors. The
market feedback, lower average electricity prices, and different
tariff structure applied in our work will have a dampening effect on
the installation levels. The generally lower annual PV electricity
generation and more seasonally skewed generation profile for
Swedish conditions, as well as the limitation that households Fig. 6. Duration curves for the difference in the marginal cost of electricity between
cannot be annual net producers, also lower investment incentives. iteration 1 (before any household investments) and iteration 10 for region SE1 for: the
The levels of household investments in PVs and batteries (around Green Policy scenario; the Regional Policy scenario; the Climate Market scenario; and
13e20 GWp in all of Sweden) found in the Green Policy and Climate the Fixed Grid case, the latter of which is identical to the Green Policy scenario except
that the variable grid fees are assumed to be zero for all the households.
1086J. Goop, E. Nyholm, M. Odenberger et al. Renewable Energy 163 (2021) 1078e1091
Fig. 7. Distributions of array-to-load ratio (ALR, the installed PV capacity in Wp divided by the average hourly load in W) after iteration 10 for households in regions SE1 and SE2 for
(a) the Green Policy scenario; (b) the Regional Policy scenario; (c) the Climate Market scenario; (d) and the Fixed Grid case, the latter of which is identical to the Green Policy
scenario except that the variable grid fees are assumed to be zero for all the households. The distributions are scaled up to represent all the households in the two regions. The
darker colour indicates the overlap between the two distributions.
hours, especially in the Green Policy scenario, which means that some Green Policy scenario. However, the superior solar irradiation
price spikes cannot be avoided completely but instead can only be conditions and differences in electricity consumption for heating,
shifted in time using the available battery capacity. Note that this ef- attributed to a warmer climate, could contribute to different pre-
fect may reflect that the households only react to the price from the requisites for the two regions in terms of investments in solar PVs
last iteration. If the dispatch of the battery storage is optimised and batteries. It should be noted that most households in region
together with the dispatch of the centralised power plants it may be SE1 reach their maximum PV installation sizes in the Green Policy
possible to reduce the number of price spikes even further. and Climate Market scenarios, as do many households in region SE2
The investments in PVs also has a significant impact on the in the Climate Market scenario.
electricity costs for individual households. The weighted average The storage capacities of the batteries, in relation to the amount
decrease in annual electricity costs after iterations range from 6% in of installed PV capacity, differ significantly between the investi-
the Regional Policy scenario to 18% in the Climate Market scenario. gated cases. In Fig. 8, the distributions of relative battery capacity5
The cost for each household is calculated as the net electricity cost (RBC) are shown for each of the investigated cases for households in
including taxes and grid fees plus the annualised investment cost region SE1 and region SE2. The RBC shows similar distributions for
for PV and battery investments. the households in the two regions, except in the Fixed Grid sce-
The sizing of the PV array in relation to the household electricity nario, where the households in region SE1 (the southern-most
consumption differs between the SE1 and SE2 regions. The distri- Swedish region) install significantly larger batteries in relation to
butions of the array-to-load ratios4 (ALRs) are shown in Fig. 7, their PV array sizes than the households in region SE2. The ALR
where they have been scaled up in line with the data presented in values (the sizing of the PV array in relation to the average load)
Table 3 to represent all the households. The households in region show clear differences between the two regions, whereas the RBC is
SE1, which is the south-most region in Sweden, on average have a generally similar between the regions, which indicates that the
higher ALR than the households in SE2. The difference in the sizing of the battery depends mostly on PV capacity.
marginal cost of electricity between the two regions is small, The ways in which the households utilise their battery storage,
ranging from, on average before iterations, 0.1 V/MWh higher in differ over the seasons of the year, depending on how much electricity
region SE1 in the Climate Market scenario to 2.7 V/MWh in the the PV is producing. Fig. 9 shows how the battery storage is utilised in
4 5
Defined as the PV capacity in Wp divided by the average hourly load in W, see Defined as the battery energy capacity in Wh times 1000 divided by the annual
Ref. [38]. PV production in a household, see Ref. [38].
1087J. Goop, E. Nyholm, M. Odenberger et al. Renewable Energy 163 (2021) 1078e1091
Fig. 8. Distributions of relative battery capacity (RBC, battery energy capacity in Wh 1000 divided by the annual PV production) after iteration 10 for households in the SE1 and
SE2 regions for: (a) the Green Policy scenario; (b) the Regional Policy scenario; (c) the Climate Market scenario; (d) and the Fixed Grid case, the latter of which is identical to the
Green Policy scenario except that the variable grid fees are assumed to be zero for all the households. The distributions are scaled up to represent all the households in the two
regions. The darker colour indicates the overlap between the two distributions.
Fig. 9. Amount of energy stored in the battery for an example household and the marginal cost of electricity for: (a) a winter week and (b) a summer week in the Green Policy
scenario after iteration 10.
an example household during a winter week and a summer week. although a marked diurnal pattern is observed, which indicates that
During the winter week, the behaviour of the household is clearly the battery is being used to self-consume electricity generated in-
governed by the marginal cost of electricity, i.e., the electricity price house by PVs. This behaviour can be attributed to the fact that the
seen by the household, discharging whenever there is a peak in the benefits accrued from avoiding taxes and grid fees through the self-
price and charging during local price troughs. The marginal cost also consumption of PV electricity outweigh the diurnal variations in the
affects the charge and discharge patterns during the summer week, market price of electricity that constitute the benefits of market
1088J. Goop, E. Nyholm, M. Odenberger et al. Renewable Energy 163 (2021) 1078e1091
arbitrage, i.e., buying at a low price and selling at a high price. The price of electricity, as well as upon additional fees that incentivise
benefits of using the battery for market arbitrage could be over- the self-consumption of PV electricity. For the three investigated
estimated due to the perfect foresight nature of the household scenarios for the capacity mix of the centralised electricity gener-
model. The electricity price curve for the entire year, the level of solar ation system, the results show investment levels as low as 5 GWp
production, and the load are all known in advance, and the usage of and 0.5 GWh for the PVs and batteries, respectively.
the battery can be optimised accordingly. We show that investments in batteries are driven by the benefits
of both increased self-consumption of PV electricity and market
3.1. Sensitivity analysis arbitrage. The relatively high and stable marginal cost of electricity in
the Climate Market scenario and the more volatile marginal cost in
To investigate the importance of the battery investment cost a the Green Policy scenario both create strong incentives for house-
sensitivity case based on the Green Policy scenario, but with an hold investments in PVs and batteries, although the investments in
investment cost of 90 V/kWh is modelled. With the lower invest- PVs are approximately twice as high in the Climate Market scenario.
ment cost, total battery investments initially increase to 51 GWh The difference is that the stable and slightly higher marginal cost in
and stabilise at 25 GWh after iterations, an increase of 150% the Climate Market scenario, which is not dominated to the same
compared with the original Green Policy scenario. As a conse- extent by variable renewable sources, results in a larger incentive for
quence the PV investments increase by 28% to 17 GWp. At this cost, self-consumption and thus larger solar PV installations.
in the Green Policy scenario, with a relatively volatile marginal cost When considering market feedback, i.e., after iteration between
of electricity, it is profitable to use the batteries for market arbi- the dispatch and the household investment model, the investment
trage, which is the main driver of the increased battery in- levels decrease significantly, especially when the initial in-
vestments. As a side-effect, the increased battery capacity enables vestments in batteries are high and there is high volatility in the
an increased self-consumption of PV electricity, which results in the marginal cost of electricity. This shows that, with hourly pricing,
increased PV investments. The substantial decrease of battery in- and if household investments in PVs and batteries have a high
vestments after iterations, shows that market feedback effects are penetration level, it is necessary to take market feedback effects
highly important when it comes to determining the profitability of into account, i.e., that household investments in PVs and batteries
using batteries for market arbitrage. It is likely, however, that at a can have a significant impact on the market price of electricity and
battery investment cost this low, there would also be investments therefore affect the profitability of such investments.
in centralised battery storage facilities, which is not accounted for Our sensitivity analysis shows that a significant fraction of PV
here. The presence of additional centralised storage in the system investments in households can be profitable even in the absence of
would stabilise the electricity prices, thus weakening incentives to low-cost battery storage. However, the profitability of battery in-
invest in residential battery storage. vestments, depends both on the use of such investments for
A case with a higher investment cost for solar PVs is also increasing self-consumption of PV-generated electricity as well as
modelled to investigate how strongly the investments in batteries the potential for using batteries for market arbitrage.
are dependent upon the investments in solar PVs. An assumed The generalizability of the results for other countries depends
investment cost of 1200 V/kWp yields a total investment in solar on the geographical location of the country and its electricity sys-
PVs of 8 GW, corresponding to a decrease of 38% compared with the tem composition. The trends presented should be applicable to
original Green Policy results. As a consequence, the battery in- countries with electricity consumption and solar irradiation pro-
vestments also drop by 20% to 8 GWh. This shows that if it is to be files similar to Sweden. At latitudes where the solar PV generation
profitable for households, the level of investment in batteries is is more uniformly distributed over the year the value of batteries
significantly dependent upon the presence of solar PVs. can be expected to be higher. The large share if hydropower in the
An additional model run was performed, in which a doubling of Swedish electricity system diminishes the marginal value of storage
the battery investment cost to 300 V/kWh was assumed, in com- and thereby the possibilities for arbitrage. In countries with less
bination with the higher PV cost of 1200 V/kWp. With these flexible generation capacity, variations in electricity price could
changes, battery investments decreased to 0.35 GWh after the it- intensify both in terms of frequency and magnitude, increasing the
erations, which is approximately 97% lower than the level in the potential for arbitrage.
Green Policy scenario with the original investment costs. PV in-
vestments are still significant, around 6.5 GWp in total, i.e., there is a CRediT authorship contribution statement
decrease in PV investment of approximately 18% compared to when
the same PV investment cost is combined with a lower battery cost. Joel Goop: Conceptualization, Methodology, Software, Visuali-
This shows that a large proportion of the PV investments can be zation, Writing - original draft. Emil Nyholm: Conceptualization,
profitable at a relatively high investment cost despite the absence Methodology, Software, Writing - review & editing. Mikael
of battery storage systems. Odenberger: Conceptualization, Methodology, Supervision,
Writing - review & editing. Filip Johnsson: Conceptualization,
4. Conclusions Methodology, Supervision, Writing - review & editing.
We present an iterative approach to modelling investments in Declaration of competing interest
PVs and batteries in Swedish single-family dwellings, which in-
volves coupling the cost-minimising dispatch model EPOD to a The authors declare that they have no known competing
household investment model using 2104 measured load profiles for financial interests or personal relationships that could have
Swedish single-family dwellings. appeared to influence the work reported in this paper.
The modelling results show that, given the assumptions made,
the electricity prices in the modelled system for Year 2032 provide Acknowledgements
significant incentives for investments in PVs and batteries in
Swedish households, yielding up to 20 GWp of PV capacity and This work is co-funded by the ChalmerseE.ON Initiative, the
10 GWh of battery storage capacity. However, the investment levels Pathways to Sustainable European Energy Systems research pro-
are heavily dependent upon the characteristics of the wholesale gramme, and the Chalmers Energy Initiative.
1089J. Goop, E. Nyholm, M. Odenberger et al. Renewable Energy 163 (2021) 1078e1091
Appendix A. Scenarios
Table A 1
Summary of the main differences in assumptions between the scenarios used. More details on the scenarios can be found in Ref. [31].
Green Policy Regional Policy Climate Market
Demand growth Moderate Low High
Drivers/policies Common European goals on RES-levels National goals on RES-levels based on A pure CO2 target between the years
corresponding to 95% RES by Year 2050 NREAPs (corresponding to a total 2020 and 2050 implemented as a
CO2 target European level of 70% RES by Year continuation of the ETS scheme
2050), European efficiency target affect
the demand for electricity
Nuclear Phase out in Germany, Belgium, and Phase out in Germany, Belgium, and Expansion allowed
Sweden. Re-investments allowed in Sweden. Re-investments allowed in
others. Lifetime 45 yr others. Lifetime 60 yr
CCS After Year 2025 After Year 2030 After Year 2025
CO2 target 2050 93%(1) 99%(1) 93%(1)
1
Compared with the emission levels in Year 1990.
References [18] J. Li, Optimal sizing of grid-connected photovoltaic battery systems for resi-
dential houses in Australia, Renew. Energy 136 (2019) 1245e1254, https://
doi.org/10.1016/j.renene.2018.09.099.
[1] International Energy Agency, A snapshot of global pv (1992e2014), URL:
[19] R.C. Pietzcker, D. Stetter, S. Manger, G. Luderer, Using the sun to decarbonize
http://www:iea-pvps:org/fileadmin/dam/public/report/technical/PVPS_
the power sector: the economic potential of photovoltaics and concentrating
report_-_A_Snapshot_of_Global_PV_-_1992-2014:pdf, , 2014.
solar power, Appl. Energy 135 (2014) 704e720.
[2] B. Nykvist, M.n. Nilsson, Rapidly falling costs of battery packs for electric ve-
[20] A. Mileva, J.H. Nelson, J. Johnston, D.M. Kammen, Sunshot solar power reduces
hicles, Nat. Clim. Change 5 (2015) 100e103.
costs and uncertainty in future low-carbon electricity systems, Environ. Sci.
[3] M. Schwarz, J. Ossenbrink, C. Knoeri, V.H. Ho_mann, Addressing integration
Technol. 47 (16) (2013) 9053e9060.
challenges of high shares of residential solar photovoltaics with battery
[21] K. Tapia-Ahumada, I. Pe rez-Arriaga, E. Moniz, A methodology for under-
storage and smart policy designs, Environ. Res. Lett. 14 (2019), https://doi.org/
standing the impacts of large-scale penetration of micro-combined heat and
10.1088/1748-9326/aaf934.
power, Energy Pol. 61 (2013) 496e512.
[4] S.A. Janko, M.R. Arnold, N.G. Johnson, Implications of high-penetration re-
[22] D. Patteeuw, K. Bruninx, A. Arteconi, E. Delarue, W. D’haeseleer, L. Helsen,
newables for ratepayers and utilities in the residential solar photovoltaic (pv)
Integrated modeling of active demand response with electric heating systems
market, Appl. Energy 180 (2016) 37e51, https://doi.org/10.1016/
coupled to thermal energy storage systems, Appl. Energy 151 (2015)
j.apenergy.2016.07.041.
306e319.
[5] J. Hoppmann, J. Volland, T.S. Schmidt, V.H. Homann, The economic viability of
[23] M. Odenberger, T. Unger, F. Johnsson, Pathways for the North European
battery storage for residential solar photovoltaic systems e a review and a
electricity supply, Energy Pol. 37 (5) (2009) 1660e1677.
simulation model, Renew. Sustain. Energy Rev. 39 (2014) 1101e1118.
[24] L. Go €ransson, J. Goop, T. Unger, M. Odenberger, F. Johnsson, Linkages between
[6] G. Mulder, D. Six, B. Claessens, T. Broes, N. Omar, J.V. Mierlo, The dimensioning
demand-side management and congestion in the European electricity trans-
of PV-battery systems depending on the incentive and selling price condi-
mission system, Energy 69 (2014) 860e872.
tions, Appl. Energy 111 (2013) 1126e1135.
[25] J. Kj€
arstad, F. Johnsson, The European power plant infra-
[7] F. Cucchiella, I. D’Adamo, M. Gastaldi, Photovoltaic energy systems with bat-
structureeePresentation of the Chalmers energy infrastructure database with
tery storage for residential areas: an economic analysis, J. Clean. Prod. 131
applications, Energy Pol. 35 (7) (2007) 3643e3664, the database used is
(2016) 460e474.
updated to the Year 2016 version.
[8] Z. Ren, G. Grozev, A. Higgins, Modelling impact of PV battery systems on
[26] ENTSO-E, Interconnected network of continental Europe, URL, https://www.
energy consumption and bill savings of Australian houses under alternative
entsoe.eu/Documents/Publications/maps/2019/Map_Continental-Europe-2.
tariff structures, Renew. Energy 89 (2016) 317e330, https://doi.org/10.1016/
500.000.pdf, 2019. (Accessed 13 May 2020).
j.renene.2015.12.021.
[27] ENTSO-E, Interconnected network of northern Europe, URL, https://www.
[9] K.R. Khalilpour, A. Vassallo, Technoeconomic parametric analysis of PV-
entsoe.eu/Documents/Publications/maps/2019/Map_Northern-Europe-3.000.
battery systems, Renew. Energy 97 (2016) 757e768.
000.pdf, 2019. (Accessed 13 May 2020).
[10] O. Talent, H. Du, Optimal sizing and energy scheduling of photovoltaic-battery
[28] ENTSO-E, Power flows from country to country 2015e2019. https://
systems under different tariff structures, Renew. Energy 129 (2018) 513e526,
eepublicdownloads.blob.core.windows.net/public-cdn-container/clean-
https://doi.org/10.1016/j.renene.2018.06.016.
documents/Publications/Statistics/PEPF_data-2015-2019.xlsx, 2020.
[11] J. Koskela, A. Rautiainen, P. J€arventausta, Using electrical energy storage in
(Accessed 13 May 2020).
residential buildings e sizing of battery and photovoltaic panels based on
[29] ENTSO-E, Ten-year network development plan 2010e2020. https://www.
electricity cost optimization, Appl. Energy 239 (2019) 1175e1189, https://
entsoe.eu/fileadmin/user_upload/_library/SDC/TYNDP/TYNDP-final_
doi.org/10.1016/j.apenergy.2019.02.021.
document.pdf, 2010. (Accessed 3 September 2015).
[12] K. Uddin, R. Gough, J. Radcliffe, J. Marco, P. Jennings, Techno-economic anal-
[30] European Commission, National action plans. https://ec.europa.eu/energy/en/
ysis of the viability of residential photovoltaic systems using lithium-ion
topics/renewable-energy/national-action-plans, 2015. (Accessed 10
batteries for energy storage in the United Kingdom, Appl. Energy 206
September 2015).
(2017) 12e21, https://doi.org/10.1016/j.apenergy.2017.08.170.
[31] T. Unger, M. Odenberger, F. Johnsson, Four scenarios for the European elec-
[13] C.O. Okoye, O. Solyalı, Optimal sizing of stand-alone photovoltaic systems in
tricity generation, in: F. Johnsson, T. Unger, E. Axelsson, U. Claeson Colpier
residential buildings, Energy 126 (2017) 573e584, https://doi.org/10.1016/
(Eds.), European Energy Pathways e towards a Sustainable European Elec-
j.energy.2017.03.032.
tricity System, Energy Technology, Energy and Environment, Chalmers Uni-
[14] C. Goebel, V. Cheng, H.-A. Jacobsen, Profitability of residential battery energy
versity of Technology, Go € teborg, 2014, pp. 131e142, 978-91-978585-6-4.
storage combined with solar photovoltaics, Energies 10 (7) (2011), https://
[32] T. Unger, M. Odenberger, Dispatch modelling of the European electricity
doi.org/10.3390/en10070976.
supply: the EPOD model, in: F. Johnsson (Ed.), Methods and Models Used in
[15] M. Kharseh, H. Wallbaum, How adding a battery to a grid-connected photo-
the Project Pathways to Sustainable European Energy Systems, 97e101, 2011.
voltaic system can increase its economic performance: a comparison of
Mo € lndal.
different scenarios, Energies 12 (1) (2018), https://doi.org/10.3390/
[33] J. Goop, M. Odenberger, F. Johnsson, The effect of high levels of solar gener-
en12010030.
ation on congestion in the European electricity transmission grid, Appl. En-
[16] S. Schopfer, V. Tiefenbeck, T. Staake, Economic assessment of photovoltaic
ergy 205 (2017) 1128e1140, https://doi.org/10.1016/j.apenergy.2017.08.143.
battery systems based on household load profiles, Appl. Energy 223 (2018)
[34] Danish Energy Agency and Energinet, Technology data - energy plants for
229e248, https://doi.org/10.1016/j.apenergy.2018.03.185.
electricity and district heating generation, first published, https://ens.dk/sites/
[17] E. O’Shaughnessy, D. Cutler, K. Ardani, R. Margolis, Solar plus: optimization of
ens.dk/files/Statistik/technology_data_catalogue_for_el_and_dh_-_0009.pdf,
distributed solar PV through battery storage and dispatchable load in resi-
2016. (Accessed 13 May 2020), 2020.
dential buildings, Appl. Energy 213 (2018) 11e21, https://doi.org/10.1016/
[35] Danish Energy Agency and Energinet, Technology data - energy storage, first
j.apenergy.2017.12.118.
1090You can also read


