Impact of physical confinement on nuclei geometry and cell division dynamics in 3D spheroids
←
→
Page content transcription
If your browser does not render page correctly, please read the page content below

www.nature.com/scientificreports

                        OPEN          Impact of physical confinement on
                                      nuclei geometry and cell division
                                      dynamics in 3D spheroids
Received: 25 January 2018             Annaïck Desmaison1, Ludivine Guillaume1, Sarah Triclin1, Pierre Weiss1,2,
Accepted: 24 May 2018                 Bernard Ducommun1,3 & Valérie Lobjois1
Published: xx xx xxxx
                                      Multicellular tumour spheroids are used as a culture model to reproduce the 3D architecture,
                                      proliferation gradient and cell interactions of a tumour micro-domain. However, their 3D
                                      characterization at the cell scale remains challenging due to size and cell density issues. In this study, we
                                      developed a methodology based on 3D light sheet fluorescence microscopy (LSFM) image analysis and
                                      convex hull calculation that allows characterizing the 3D shape and orientation of cell nuclei relative to
                                      the spheroid surface. By using this technique and optically cleared spheroids, we found that in freely
                                      growing spheroids, nuclei display an elongated shape and are preferentially oriented parallel to the
                                      spheroid surface. This geometry is lost when spheroids are grown in conditions of physical confinement.
                                      Live 3D LSFM analysis of cell division revealed that confined growth also altered the preferential cell
                                      division axis orientation parallel to the spheroid surface and induced prometaphase delay. These results
                                      provide key information and parameters that help understanding the impact of physical confinement on
                                      cell proliferation within tumour micro-domains.

                                      Multicellular spheroids reproduce the three-dimensional (3D) multicellular architecture, cell-cell interactions as
                                      well as oxygen and proliferation gradients observed in tumour micro-domains1,2. Multicellular spheroids have
                                      been used as surrogate to investigate the consequence of the resistance opposed by the tumour microenvironment
                                      to tumour growth in vivo. When multicellular aggregates are grown in constrained conditions, for instance upon
                                      embedding within agarose gel, alginate capsules or polydimethylsiloxane (PDMS) pillars3–7, growth is altered,
                                      cell proliferation is reduced and apoptosis is increased5,7,8. Growth confinement might also alter cell shape at the
                                      spheroid periphery9. In a previous study, we explored the effect of a confined environment on spheroid growth,
                                      and showed that multicellular aggregates grown in PDMS micro-channels for several days adopt an elongated
                                      rod-like shape with the longer axis parallel to the channel axis10. This growth directionality is accompanied by
                                      accumulation of mitotic cells within spheroids. This accumulation is not associated with alteration of cell round-
                                      ing, but with spindle pole abnormalities10.
                                          Most of the studies on the impact of confinement on spheroid growth and proliferation were based on the
                                      analysis of the spheroid global shape, or on the characterization at the cell scale using imaging strategies based on
                                      2D optical sections or cryosections. However, these approaches are not appropriate to characterize the impact of
                                      confinement on cell behaviour parameters, such as shape and orientation of nuclei, as well as the orientation of
                                      cell division that should be performed directly using 3D data.
                                          To address this challenge we used light-sheet fluorescence microscopy (LSFM) to acquire 3D images of optically
                                      cleared spheroids and to monitor cell division in live spheroids11,12. Moreover, we developed dedicated algorithms
                                      and software tools for semi-supervised 3D image analysis. We found that, in spheroids grown in suspension, nuclei
                                      have an elongated shape and are preferentially oriented parallel to the spheroid surface, like the cell division axes.
                                      These features were altered in spheroids grown in confined conditions following embedding in low-melting point
                                      agarose. Live monitoring of cell division within spheroids grown in constrained and non-constrained conditions
                                      revealed that prometaphase was delayed in spheroids embedded in low-melting point agarose.
                                          These results are consistent with the growing body of evidence that the physical microenvironment is an
                                      essential actor of tumour growth, and suggest that confinement could impair cell division and thus, might con-
                                      tribute to genomic instability.

                                      1
                                       ITAV, Université de Toulouse, CNRS, Toulouse, France. 2IMT, Université de Toulouse, CNRS, Toulouse, France.
                                      3
                                       CHU de Toulouse, Toulouse, France. Annaïck Desmaison and Ludivine Guillaume contributed equally to this work.
                                      Correspondence and requests for materials should be addressed to V.L. (email: valerie.lobjois@itav.fr)

        SCIeNTIFIC REPOrts | (2018) 8:8785 | DOI:10.1038/s41598-018-27060-6                                                                               1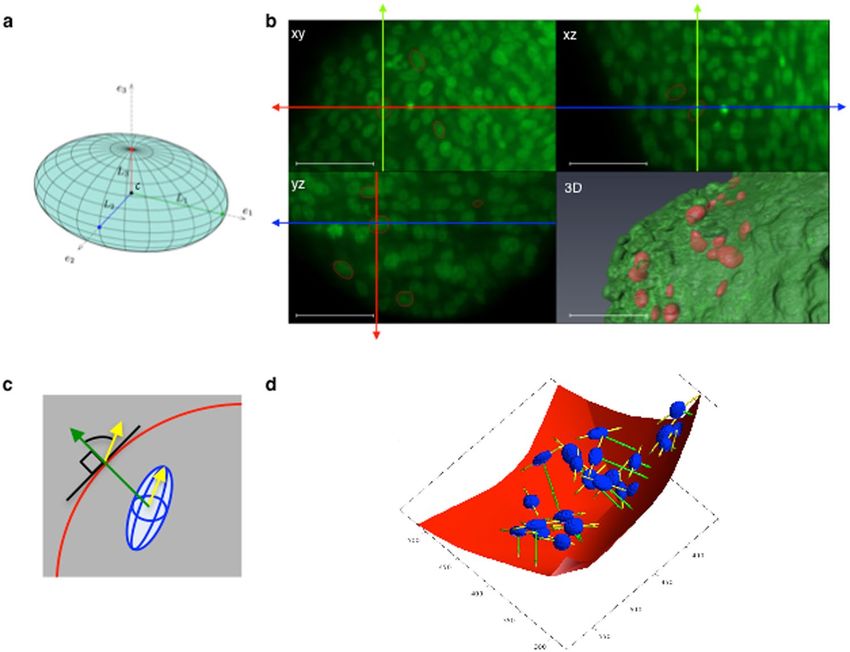
www.nature.com/scientificreports/

                              Figure 1. Principle of the determination of 3D nuclei geometry. Spheroids were fixed and stained with
                              propidium iodide (a fluorescent nuclear marker). After optical clearing through ethanol dehydration and
                              incubation in an organic solvent (BABB), nuclei in the whole spheroid volume were imaged by light-sheet
                              fluorescence microscopy. (a) Geometrical parameters of an ellipsoid. (b) Images of the xy, xz and yz planes
                              of a portion of a z-stack with propidium iodide fluorescence shown in green. The red ellipses show the result
                              of the 3D segmentation of nuclei performed using the FitEllipsoid Icy 3D segmentation plugin in each plane.
                              Green, red and blue axes indicate the position in x, y and z respectively. The 3D visualization (lower right panel)
                              corresponds to the volume rendering of a LSFM spheroid z-stack (AMIRA software) in green with the 3D iso-
                              surfaces of segmented nuclei in red. Scale bar: 50 µm. (c) The orientation of a nucleus (in blue) is defined as the
                              angle of the long axis (yellow arrow) relative to the normal (in green) at the closest point on the spheroid surface
                              (in red). (d) 3D visualization of the spheroid convex hull (red) and the ellipsoids corresponding to the nuclei
                              (blue) from a z-stack. The direction of the long axis and the closest point on the spheroid convex hull are shown
                              in yellow and green, respectively.

                              Results
                              3D analysis of the geometry of cell nuclei in spheroids. Previous studies performed using spheroid
                              cryosections suggest that nuclei located at the spheroid periphery tend to be elongated and aligned with the sphe-
                              roid boundary13. However, in spheroid sections, nuclei are randomly cut and information on their shape can only
                              be very partial. A more accurate characterization requires determining their 3D geometry. The nucleus shape
                              can be described using ellipsoids that are defined by a centre c, three orthogonal unit vectors denoted e1, e2 and
                              e3 in R3, and their respective lengths L1, L2 and L3 (Fig. 1a). Therefore, our objective was to develop a method
                              to fit ellipsoids in a 3D environment to mimic nuclei within spheroids. We previously reported that light-sheet
                              fluorescence microscopy (LSFM) is well suited to perform 3D imaging of large samples, such as spheroids derived
                              from HCT116 cancer cells11,12,14. Optical clearing with organic solvents efficiently improves in-depth 3D imaging
                              of thick samples by LSFM15. Here, we adapted clearing with benzyl alcohol-benzyl benzoate (BABB) to spheroids
                              stained with propidium iodide after fixation to improve in depth resolution for the analysis of the 3D shape of
                              nuclei (Fig. 1b). The automatic segmentation of nuclei in 3D LSFM images was not possible using open-source or
                              commercial software tools that were not efficient enough to segment large collections of nuclei from a huge dataset,
                              such as in LSFM z-stacks of spheroids. Therefore, we designed a specific semi-supervised algorithm to efficiently fit
                              ellipsoids in 3D to nuclei (Fig. 1b) and to extract the c, e1, e2 and e3 coordinates as well as the L1, L2 and L3 lengths.
                              The algorithm is available and distributed as a plugin for Icy, a widely used open community platform for bioimage
                              informatics (https://www.youtube.com/watch?v=MjotgTZi6RQ&feature=youtu.be)16.We determined the nucleus
                              elongation on the basis of its aspect ratio defined as the ratio between its longest axis L1 and its shortest axis L3.
                                  Using this methodology, we found that nuclei located between 0 and 100 µm from the surface in spheroids
                              grown in suspension had an elongated shape (median aspect ratio = 1.83) (Fig. 2a, Fig. S1). As a control, we
                              showed that, in agreement with our previous results based on cryosections13, nuclei of spheroids incubated
                              with latrunculin A, a pharmacological agent that prevents actin polymerization, were rounder (median aspect
                              ratio = 1.62) (Fig. 2a).

SCIeNTIFIC REPOrts | (2018) 8:8785 | DOI:10.1038/s41598-018-27060-6                                                                                   2
www.nature.com/scientificreports/

                              Figure 2. Analysis of nucleus geometry in spheroids. (a) Boxplots (R software) of the L1 to L3 ratio in
                              control spheroids (control), spheroids incubated with latrunculin A (500 nM) for 8 hours (Lat A) or grown
                              in 1% low-melting point agarose for 24 hours (Agar) before fixation. A high ratio value indicates that the
                              nucleus is elongated; n = 272, 244 and 429 nuclei from control, latrunculin A-treated and agarose-embedded
                              spheroids, respectively. 6 to 13 independent spheroids were analysed in each condition. (b) Boxplots showing
                              the orientation of nuclei in control and agarose-embedded (Agar) spheroids. Only nuclei with an L1/L3 value
                              higher than 1.5 (and thus considered to be elongated) were analysed. A 90° angle means that L1 is parallel to
                              the spheroid convex hull. In control, the nucleus angle values are significantly different from those in agarose-
                              embedded spheroids (p < 0.0001 in both case).

                                  Considering the elongated shape of nuclei, we then analysed their orientation relative to the spheroid surface.
                              From a mathematical viewpoint, the nucleus orientation parallel to the spheroid surface means that the vector
                              e1, which is collinear with the nucleus longest axis, approximately belongs to the plane tangent to the spheroid
                              surface at the point nearest to the ellipsoid centre c (Fig. 1c). To find this point for each fitted ellipsoid, we gener-
                              ated the convex hull of the whole spheroid volume from 3D images and used it as a mesh for the spheroid surface
                              (Fig. 1d). Then, for each segmented nucleus, we found the point on the convex hull nearest to the centre of the
                              corresponding ellipsoid and the plane tangent to the surface at this point. Using this experimental approach, we
                              measured the angle between the ellipsoid main axis and the normal to the tangent plane, and we found that, for
                              elongated nuclei with an aspect ratio higher than 1.5 (87% of all nuclei), the median angle value was 77°, suggest-
                              ing that nuclei were oriented quite parallel to the spheroid surface (Fig. 2b).

                              3D analysis of cell division axis orientation within spheroids. As our findings indicated that nuclei
                              between 0 and 100 µm from the surface are preferentially elongated and orientated parallel to the spheroid sur-
                              face, we asked whether the cell division axis orientation was also parallel to the spheroid surface.
                                  The cell division axis is defined as the axis perpendicular to the metaphase plate. As the probability to detect a
                              mitotic cell in the plane of the section is very low in spheroid cryosections, we performed this analysis using 3D
                              images. To optimize the detection of metaphases, we monitored mitotic cells by time-lapse LSFM in spheroids
                              made of HCT116 cells that express a histone H2B-mCherry fusion protein (Supplementary Movie 1). The achieved
                              image resolution allowed us to distinguish metaphase plates (see Supplementary Movie 2). To determine the divi-
                              sion axis orientation, we developed a procedure described in details in the Methods section. Briefly, the metaphase
                              plate is segmented and represented as a 3D surface by a thin and homogeneous ellipsoid, flattened along one axis
                              (Fig. 3a) and the descriptive parameters (the x, y and z coordinates of the mass centre and the x, y and z coordinates
                              of the three orthogonal axes) are extracted. Then, the orientation of the division axis is determined by calculating
                              the angle of the shortest axis of the ellipsoid with reference to the normal to the tangent at the closest point to the
                              spheroid convex hull (Fig. 3a). Using this method, we observed that, in freely grown spheroids, the division axis
                              was preferentially parallel to the surface (median angle = 74.7°) in most mitotic cells (Fig. 3b).

                              Physical confinement alters the 3D nucleus geometry and cell division axis orientation.                       To
                              investigate the impact of mechanical confinement on the 3D nucleus geometry and cell division axis orientation,
                              we used the previously described experimental strategy and spheroids grown in 1% low-melting point agarose
                              for 24 hours. In this condition, it has been shown that stress accumulates around spheroids due to displacement
                              of the gel by the growing spheroid5,6. After embedding, spheroids were in contact with the surrounding agarose
                              (Fig. S2) and after around 30 hours, they ruptured the gel, leading to a rapid deformation of the spheroid shape.
                              This indicates that agarose limits the spheroid growth (Fig. S2 and Supplementary Movie 3).
                                  Compared with spheroids grown in suspension (control), nuclei located between 0 and 100 µm from the
                              spheroid surface were significantly less elongated in spheroids grown in agarose (median aspect ratio = 1.67,
                              p < 0.0001 compared with control) (Fig. 2a). Moreover, elongated nuclei (75% of all nuclei) were less parallel
                              to the spheroid surface (median angle = 70°, p < 0.0001 compared with control) (Fig. 2b), and the preferential

SCIeNTIFIC REPOrts | (2018) 8:8785 | DOI:10.1038/s41598-018-27060-6                                                                                  3
www.nature.com/scientificreports/
Figure 3. Analysis of the cell division axis orientation. Mitotic cells in the z-stack of a spheroid are detected
based on the chromatin condensation visualized thanks to histone H2B-mCherry fluorescence (HCT116-
H2B-mCherry cells). (a) 3D visualization of a portion of one HCT116-H2B-mCherry cell spheroid from a
LSFM acquisition z-stack. The red surface delineates the metaphase plate. The green arrows indicate the 3D
orientation of the division axis. The blue line shows the spheroid surface. The orientation of the division axis was
determined by measuring the angle of the division axis relative to the normal to the spheroid surface (MCTS)
at the nearest point (S, purple arrow). An angle of 90° corresponds to a division axis parallel to the spheroid
surface and a metaphase plate perpendicular to the surface. (b) Boxplots of the angle of the division axis in
control and in low-melting point agarose-embedded spheroids.
orientation of the cell division axis was changed (median angle = 62°, p < 0.05 compared with control) (Fig. 3b).
Conversely, the geometry of nuclei deeper than 100 µm within the spheroid was similar in control and confined
spheroids (Fig. S1). Together, these results indicate that confined growth conditions alter the 3D nuclei geometry
and the cell division axis orientation only in the outmost cell layers of spheroids.
3D cell division dynamic monitoring reveals prometaphase delay upon constrained growth. Cell
division is largely dependent on the cell and nucleus geometry during interphase17–20 and their alteration can affect
mitosis progression21,22. Therefore, we examined the impact of confinement on progression into mitosis. To this
aim, we performed live LSFM imaging to monitor cell division in HCT116 cell spheroids that express histone
H2B-mCherry (Supplementary Movie 3, Fig. 4a). From LFSM time lapse experiments, the image resolution (Fig. 4a)
allowed us to precisely identify the steps of cell division and the time point at which they occur: DNA condensa-
tion, alignment of chromosomes on the metaphase plate, and separation of chromosomes at anaphase onset. From
these data, we could calculate the duration of prometaphase (i.e., the time interval between DNA condensation
and metaphase plate formation) and of metaphase (i.e., the time interval between metaphase plate formation and
anaphase onset). Anaphase duration corresponds to the time between anaphase onset and the beginning of DNA
decondensation and cytokinesis, and is much more difficult to identify. For this reason, we determined only the
prometaphase and metaphase duration in a large number of dividing cells within spheroids grown in suspension
(control, Supplementary Movie 4) or in 1% low-melting point agarose for 24 h (Supplementary Movie 5). In control
spheroids, prometaphase lasted on average 14.4 ± 7.6 minutes and metaphase 13 ± 5 minutes. Growth in agarose
increased prometaphase duration (23.1 ± 14.1 minutes, p < 0.0001 compared with control), but did not affect meta-
phase duration (Fig. 4b,c). When we considered also mitotic cells the metaphase plate of which could not be detected
in the recorded movies (not included in Fig. 4b), we found that 22% of mitotic cells in spheroids grown in agarose
had a prometaphase longer than 40 minutes, but only 1% in control spheroids. Moreover, in mitotic cells with longer
prometaphase, condensed chromosomes were organized as a persistent ring with a central lumen instead of the full
cylinder that corresponds to the metaphase plate observed in controls (Fig. 4d and Supplementary Movies 6 and 7).
This ring-shaped organization of the chromosomes could correspond to the structure that has been described for the
capture of chromosomes by microtubules during prometaphase23.
Discussion
Biochemical and biomechanical cues contribute to tumour development. Particularly, it has been shown that
stiffening of the extracellular matrix during tumour growth contributes to the loss of tensional homeostasis in
solid tumours24,25. Moreover, the extracellular matrix in the tumour microenvironment limits tumour expansion
and imposes a mechanical stress. Spheroids embedded within an inert biocompatible matrix made of agarose
have been used to demonstrate the accumulation of mechanical stress in constrained growth conditions. In such
constrained conditions, cell proliferation also is decreased5,6. In a previous study, we showed that constrained
growth induces accumulation of mitotic cells within multicellular tumour spheroids. The objective of the present
study was to analyse the impact of mechanical confinement on tumour cell division dynamics in relation with
the 3D cell organization. To this aim we developed a 3D methodology and used spheroids embedded in agarose.
This cell culture method allows considering only the impact of the mechanical resistance from the microenviron-
ment on the organization of cells within spheroids and on cell division orientation and dynamics, independently
of signalling pathways. We developed an interdisciplinary approach combining 3D fluorescence live imaging
SCIeNTIFIC REPOrts | (2018) 8:8785 | DOI:10.1038/s41598-018-27060-6 4www.nature.com/scientificreports/
Figure 4. 3D cell division dynamic monitoring reveals longer prometaphase duration in spheroids grown in
agarose. (a) 3D time-lapse imaging of cell progression through mitosis using LSFM allows monitoring the cell
division dynamics. Top panel: maximal projection of a z-stack (left) and zoom on a mitotic cell (right). Scale
bar: 100 µm. Bottom panels: selected in depth images of cells at the indicated stages of mitosis. Time after
nuclear condensation is indicated. Prometaphase duration: time between DNA condensation and metaphase
initiation. Metaphase duration: time between the establishment of the metaphase plate and anaphase initiation.
(b) Prometaphase (blue) and metaphase (red) duration (minutes) measured in mitotic cells within control
(n = 98) and agarose-embedded spheroids (n = 50). Each bar represents the duration of these two phases in
one mitotic cell in which prometaphase and metaphase were fully monitored (98 out of 104 cells in control,
and 50 out of 78 cells in agarose-embedded spheroids). Stars indicate mitotic cells where condensation started
before the beginning of the time-lapse video recording. Consequently, in these cells, prometaphase was longer
than the duration indicated in the graph. All cells were aligned relative to the metaphase plate. The median
(±SD) duration is indicated. (c) Boxplot of the prometaphase (blue) and metaphase (red) duration in control
and agarose-embedded spheroids. (d) (Left panels): 3D images of a mitotic cell in a control spheroid with
chromosomes organized in a metaphase plate. Scale bar: 5 µm. (Right panels): 3D images of a mitotic cell in a
spheroid grown in agarose with chromosomes organized in a ring. Scale bar: 10 µm. Side view (upper panels)
and front view (lower panels) are shown.
SCIeNTIFIC REPOrts | (2018) 8:8785 | DOI:10.1038/s41598-018-27060-6 5www.nature.com/scientificreports/
technology and proprietary software to quantitatively analyse these parameters. LSFM implementation has been
a major breakthrough for the imaging of large and scattering 3D models, such as spheroids14,26. Using cell lines
that express fluorescent histone H2B and specifically designed sample holders, we previously showed that this
technology allows monitoring live cell division dynamics in large 3D spheroidal micro-tissues12. However, despite
this 3D imaging improvement, data quality and size were still not compatible with fully automated segmentation
procedures. Therefore, we developed dedicated algorithms and software tools that demonstrate the advantage of
using semi-supervised algorithms for 3D image analyses compared with time-consuming fully manual segmen-
tation strategies.
Here, using this methodology, we show that nuclei display a preferential 3D orientation and elongation par-
allel to the spheroid surface. The analysis of cell shape in spheroids also indicates that cells tend to be elongated
along the spheroid surface9. We also found that the cell division axis is preferentially oriented parallel to the
spheroid surface and therefore to the nucleus elongation axis. Altogether, these data suggest that the spheroid cell
organization could be dependent on mechanical strain relative to the spheroid surface that induces cell and nuclei
elongation and orientation parallel to the maximal strain axis.
Several studies have shown that in cultured adherent cells and in developing tissues, the cell division axis is
oriented along the axis of maximal tension27–29. In cells grown on adhesive patterns, focal adhesions and actin
cytoskeleton produce internal cortical forces that direct the orientation of the division axis30. Cell shape also
guides spindle orientation. In cell monolayers under stretch, cell division is mostly aligned along the interphase
long axis31. It has been shown in flies and plants that cells adjust cell division orientation to their shape following
mechanical strain32. Similarly, in sea urchin embryos, cell shape dictates the positioning and orientation of the
nucleus and division axis through pulling forces exerted by microtubules33 and in endothelial cells cultured on
adhesive micro-patterns, cell elongation alters the nucleus shape and orientation relative to the cell long axis20.
It has been already reported that spheroid growth in conditions of confinement induces cell cycle arrest in
the G1-phase8. Our work shows that in such conditions, mitosis progression also is altered. Indeed, in physically
confined growth conditions, we observed that prometaphase duration was increased. This could results from an
alteration of spindle positioning induced by the modification of mechanical strain and nuclei organization. We
could not test this hypothesis by live 3D microscopy because of the alteration of the global morphology of sphe-
roids of HCT116 cell engineered to express tubulin-GFP (data not show), and the insufficient resolution for 3D
reconstruction of the mitotic spindle after live LSFM imaging of spheroids. However, the ring-shaped condensed
chromosome organization observed in cells with extended prometaphase within spheroids grown in agarose is
similar to the chromosome arrangement in the equatorial ring in cultured human cells. This structure is associ-
ated with transient unstable interactions between kinetochores and microtubules during spindle assembly in early
prometaphase23. Therefore, our observations strongly suggest that in conditions of physical confinement, mitotic
spindle assembly and/or positioning is transiently impaired, leading to activation of the spindle assembly check-
point34,35, and increased prometaphase duration. Spindle assembly and orientation are crucial for chromosome
capture and segregation, and consequently for tissue organization and development27,36,37. Spindle misorientation
alone is unlikely to be tumorigenic38; however, spindle defects contribute to carcinogenesis, suggesting that they
synergize with cancer-associated mutations and promote genomic instability37.
Methods
Cell culture and spheroid generation. HCT116 colorectal adenocarcinoma cells (ATCC, nearly diploid
and Ras mutated) that express histone H2B fused with mCherry were obtained by lentiviral transfection. Cells
were cultured in DMEM (Gibco) containing 10% foetal calf serum with 2 mM/l glutamine and penicillin/strep-
tomycin in a humidified atmosphere of 5% CO2 at 37 °C. In these culture conditions, HCT116 cells have an epi-
thelial morphology. Spheroids were prepared as previously described39. Briefly, 500 cells/well were distributed in
poly-HEMA-coated 96-well round bottom plates. Plates were centrifuged (300 g for 6 min) and then placed in a
humidified atmosphere of 5% CO2 at 37 °C. Spheroids of 650 µm in diameter were kept in suspension, incubated
or not with 0.5 µM latrunculin A for 8 hours, or transferred in 1% Low-Melting Point agarose (10 g/L, Euromedex)
for 24 hours before further analysis.
Light-sheet fluorescence microscopy of optically cleared spheroids. HCT116 cell spheroids were
fixed at room temperature with formalin (Sigma) for 4 hours. Spheroids were stained with propidium iodide,
embedded in an agarose cylinder, and then sequentially transferred in 25%, 50%, 75% and finally 95% ethanol
solutions for complete dehydration. For clearing, samples were transferred in BABB solution (1:2 benzyl alcohol:
benzyl benzoate, Sigma). Spheroids immersed in BABB were then imaged by LSFM25 using a 10x objective. The
whole volume of each spheroid was imaged with a 1 µm z-step.
Nucleus geometry analysis. The FitEllipsoid plugin for Icy was used16,40. Briefly, from the propidium
iodide fluorescence signal, a few points on the nucleus boundary were manually delimited on the xy, yz and
xz views on a central z-plane of each nucleus analysed. Then, an ellipsoid was fitted automatically to the set of
selected points. The ellipsoid geometrical parameters were then saved by the plugin. A MATLAB algorithm was
used to determine the geometry of nuclei within the spheroid from this data. The user provides the image stack
of the spheroid and a file with the parameters of all the identified ellipsoids (nuclei). The algorithm first identifies
the spheroid boundary from the stack of images and extracts the convex hull. Then, for each ellipsoid it finds the
closest point on the envelope, and finally calculates the angle between the ellipsoid longest axis and the normal to
the surface. Uneven fluorescent signal intensity in nuclei and non-homogeneous imaging of the whole spheroid
might preclude the envelope extraction. To address this potential limitation, the following steps are undertaken
by the algorithm. First, the image is denoised by a Gaussian convolution. By thresholding, a 3D binary image that
roughly corresponds to the spheroid is obtained, and then the spheroid form is regularized by finding the smallest
SCIeNTIFIC REPOrts | (2018) 8:8785 | DOI:10.1038/s41598-018-27060-6 6www.nature.com/scientificreports/
convex polyhedron that contains all the points of the binary image. The output is a triangulation of the envelope.
To detect the closest point of a nucleus to the surface, the projection of the ellipsoid centre is calculated on all the
envelope triangles and the shortest distance is kept.
Live light-sheet fluorescence microscopy imaging of spheroids. Samples were prepared as previ-
ously described11. Briefly, sample chambers in hydrogel (Phytagel, 10 g/L in PBS) were fabricated and filled with
culture medium or melted agarose. Spheroids were transferred into the chambers 24 hours prior acquisition.
LSFM setup, 3D and time-lapse image acquisition were as previously specified12. Chambers were hanged with
a rod and immersed in medium in the physiologic chamber. Image stacks of 170 to 300 µm from the spheroid
periphery to the centre, with 1 µm step, were acquired every 4 minutes for a maximum of 4 hours.
Analysis of the cell division orientation axis. Mitotic cells were visualized in 3D fluorescence images
acquired by LSFM using the Imaris software. The metaphase plate was segmented and represented as an ellipsoid
flattened along one axis that indicates the division axis orientation. The ellipsoid descriptive parameters (the x,
y and z coordinates of the centre of the mass and the x, y and z coordinates of the three orthogonal axes) corre-
sponding to the segmented object were then extracted. The last metaphase plate detected before anaphase onset
was used to determine the shortest axis of the ellipsoid that corresponds to the division axis orientation. This ori-
entation refers to a coordinate reference that is the normal to the spheroid surface at the closest point. To obtain
this reference, a MATLAB program was used to determine the spheroid convex hull and calculate the distance
of mitotic cells from the surface. The angle of the ellipsoid shortest axis with the normal to the surface was then
calculated to obtain the orientation of the division axis.
Analysis of the duration of mitotic steps. Stack images were downloaded with Imaris to allow their 3D
visualization. For each detected dividing cell, DNA condensation was determined as the first frame where the
nucleus appears non-homogeneous. The metaphase plate corresponds to the thinner, full and homogeneous cyl-
inder of chromosomes. Anaphase corresponds to the first frame in which the separation of the sister chromatids
is detected. The time measured between DNA condensation and metaphase corresponds to the prometaphase
duration. The time measured between the establishment of the metaphase plate and anaphase corresponds to the
metaphase duration.
Data analysis. Graphs and data were analysed with GraphPad Prism version 6.00, GraphPad software,
La Jolla California USA, www.graphpad.com and in R (R Core Team 2017, https://www.R-project.org/). The
non-parametric Mann-Whitney test was used to compare data from different conditions. Stacks were analysed
using the Amira, Imaris and Fiji41 software programs.
References
1. Costa, E. C. et al. 3D tumor spheroids: an overview on the tools and techniques used for their analysis. Biotechnology advances 34,
1427–1441 (2016).
2. Lobjois, V., Frongia, C., Jozan, S., Truchet, I. & Valette, A. Cell cycle and apoptotic effects of SAHA are regulated by the cellular
microenvironment in HCT116 multicellular tumour spheroids. Eur J Cancer 45, 2402–2411, https://doi.org/10.1016/j.
ejca.2009.05.026 (2009).
3. Alessandri, K. et al. Cellular capsules as a tool for multicellular spheroid production and for investigating the mechanics of tumor
progression in vitro. Proc Natl Acad Sci USA 110, 14843–14848, https://doi.org/10.1073/pnas.1309482110 (2013).
4. Aoun, L. et al. Microdevice arrays of high aspect ratio poly(dimethylsiloxane) pillars for the investigation of multicellular tumour
spheroid mechanical properties. Lab on a chip 14, 2344–2353, https://doi.org/10.1039/c4lc00197d (2014).
5. Cheng, G., Tse, J., Jain, R. K. & Munn, L. L. Micro-environmental mechanical stress controls tumor spheroid size and morphology
by suppressing proliferation and inducing apoptosis in cancer cells. PLoS One 4, e4632, https://doi.org/10.1371/journal.
pone.0004632 (2009).
6. Helmlinger, G., Netti, P. A., Lichtenbeld, H. C., Melder, R. J. & Jain, R. K. Solid stress inhibits the growth of multicellular tumor
spheroids. Nature biotechnology 15, 778–783, https://doi.org/10.1038/nbt0897-778 (1997).
7. Montel, F. et al. Stress clamp experiments on multicellular tumor spheroids. Physical review letters 107, 188102 (2011).
8. Delarue, M. et al. Compressive stress inhibits proliferation in tumor spheroids through a volume limitation. Biophysical journal 107,
1821–1828, https://doi.org/10.1016/j.bpj.2014.08.031 (2014).
9. Dolega, M. E. et al. Cell-like pressure sensors reveal increase of mechanical stress towards the core of multicellular spheroids under
compression. Nature communications 8, 14056, https://doi.org/10.1038/ncomms14056 (2017).
10. Desmaison, A., Frongia, C., Grenier, K., Ducommun, B. & Lobjois, V. Mechanical stress impairs mitosis progression in multi-cellular
tumor spheroids. PLoS One 8, e80447, https://doi.org/10.1371/journal.pone.0080447 (2013).
11. Desmaison, A., Lorenzo, C., Rouquette, J., Ducommun, B. & Lobjois, V. A versatile sample holder for single plane illumination
microscopy. Journal of microscopy 251, 128–132, https://doi.org/10.1111/jmi.12051 (2013).
12. Lorenzo, C. et al. Live cell division dynamics monitoring in 3D large spheroid tumor models using light sheet microscopy. Cell Div
6, 22, https://doi.org/10.1186/1747-1028-6-22 (2011).
13. Zhang, W. et al. Structure Tensor Based Analysis of Cells and Nuclei Organization in Tissues. IEEE transactions on medical imaging
35, 294–306, https://doi.org/10.1109/TMI.2015.2470093 (2016).
14. Pampaloni, F., Reynaud, E. G. & Stelzer, E. H. The third dimension bridges the gap between cell culture and live tissue. Nat Rev Mol
Cell Biol 8, 839–845 (2007).
15. Ertürk, A. & Bradke, F. High-resolution imaging of entire organs by 3-dimensional imaging of solvent cleared organs (3DISCO).
Experimental neurology 242, 57–64, https://doi.org/10.1016/j.expneurol.2012.10.018 (2013).
16. Fehrenbach, J., Kovac, B. & Weiss, P. FitEllipsoid: a fast supervised ellipsoid segmentation plugin. Preprint at https://hal.archives-
ouvertes.fr/hal-01520337 (2017).
17. Lazaro-Dieguez, F., Ispolatov, I. & Musch, A. Cell shape impacts on the positioning of the mitotic spindle with respect to the
substratum. Molecular biology of the cell 26, 1286–1295, https://doi.org/10.1091/mbc.E14-08-1330 (2015).
18. Thery, M. et al. The extracellular matrix guides the orientation of the cell division axis. Nat Cell Biol 7, 947–953, https://doi.
org/10.1038/ncb1307 (2005).
19. Williams, S. E., Beronja, S., Pasolli, H. A. & Fuchs, E. Asymmetric cell divisions promote Notch-dependent epidermal differentiation.
Nature 470, 353–358, https://doi.org/10.1038/nature09793 (2011).
SCIeNTIFIC REPOrts | (2018) 8:8785 | DOI:10.1038/s41598-018-27060-6 7www.nature.com/scientificreports/
20. Versaevel, M., Grevesse, T. & Gabriele, S. Spatial coordination between cell and nuclear shape within micropatterned endothelial
cells. Nature communications 3, 671, https://doi.org/10.1038/ncomms1668 (2012).
21. Carreno, S. et al. Moesin and its activating kinase Slik are required for cortical stability and microtubule organization in mitotic cells.
J Cell Biol 180, 739–746, https://doi.org/10.1083/jcb.200709161 (2008).
22. Lancaster, O. M. et al. Mitotic rounding alters cell geometry to ensure efficient bipolar spindle formation. Developmental cell 25,
270–283, https://doi.org/10.1016/j.devcel.2013.03.014 (2013).
23. Magidson, V. et al. The spatial arrangement of chromosomes during prometaphase facilitates spindle assembly. Cell 146, 555–567,
https://doi.org/10.1016/j.cell.2011.07.012 (2011).
24. Butcher, D. T., Alliston, T. & Weaver, V. M. A tense situation: forcing tumour progression. Nat Rev Cancer 9, 108–122, https://doi.
org/10.1038/nrc2544 (2009).
25. Northey, J. J., Przybyla, L. & Weaver, V. M. Tissue Force Programs Cell Fate and Tumor Aggression. Cancer discovery 7, 1224–1237,
https://doi.org/10.1158/2159-8290.CD-16-0733 (2017).
26. Huisken, J. & Stainier, D. Y. Selective plane illumination microscopy techniques in developmental biology. Development 136,
1963–1975, https://doi.org/10.1242/dev.022426 (2009).
27. di Pietro, F., Echard, A. & Morin, X. Regulation of mitotic spindle orientation: an integrated view. EMBO reports 17, 1106–1130,
https://doi.org/10.15252/embr.201642292 (2016).
28. Legoff, L., Rouault, H. & Lecuit, T. A global pattern of mechanical stress polarizes cell divisions and cell shape in the growing
Drosophila wing disc. Development 140, 4051–4059, https://doi.org/10.1242/dev.090878 (2013).
29. Wyatt, T., Baum, B. & Charras, G. A question of time: tissue adaptation to mechanical forces. Curr Opin Cell Biol 38, 68–73, https://
doi.org/10.1016/j.ceb.2016.02.012 (2016).
30. Thery, M., Jimenez-Dalmaroni, A., Racine, V., Bornens, M. & Julicher, F. Experimental and theoretical study of mitotic spindle
orientation. Nature 447, 493–496, https://doi.org/10.1038/nature05786 (2007).
31. Wyatt, T. P. et al. Emergence of homeostatic epithelial packing and stress dissipation through divisions oriented along the long cell
axis. Proc Natl Acad Sci USA 112, 5726–5731, https://doi.org/10.1073/pnas.1420585112 (2015).
32. Gibson, W. T. et al. Control of the mitotic cleavage plane by local epithelial topology. Cell 144, 427–438, https://doi.org/10.1016/j.
cell.2010.12.035 (2011).
33. Minc, N., Burgess, D. & Chang, F. Influence of cell geometry on division-plane positioning. Cell 144, 414–426, https://doi.
org/10.1016/j.cell.2011.01.016 (2011).
34. Cordeiro, M. H., Smith, R. J. & Saurin, A. T. A fine balancing act: A delicate kinase-phosphatase equilibrium that protects against
chromosomal instability and cancer. The international journal of biochemistry & cell biology 96, 148–156, https://doi.org/10.1016/j.
biocel.2017.10.017 (2018).
35. Musacchio, A. & Salmon, E. D. The spindle-assembly checkpoint in space and time. Nat Rev Mol Cell Biol 8, 379–393, https://doi.
org/10.1038/nrm2163 (2007).
36. Heald, R. & Khodjakov, A. Thirty years of search and capture: The complex simplicity of mitotic spindle assembly. J Cell Biol 211,
1103–1111, https://doi.org/10.1083/jcb.201510015 (2015).
37. Noatynska, A., Gotta, M. & Meraldi, P. Mitotic spindle (DIS)orientation and DISease: cause or consequence? J Cell Biol 199,
1025–1035, https://doi.org/10.1083/jcb.201209015 (2012).
38. Pease, J. C. & Tirnauer, J. S. Mitotic spindle misorientation in cancer–out of alignment and into the fire. J Cell Sci 124, 1007–1016,
https://doi.org/10.1242/jcs.081406 (2011).
39. Laurent, J. F. et al, V. Multicellular tumor spheroid models to explore cell cycle checkpoints in 3D. BMC Cancer 13 (2013).
40. de Chaumont, F. et al. Icy: an open bioimage informatics platform for extended reproducible research. Nat Methods 9, 690–696,
https://doi.org/10.1038/nmeth.2075 (2012).
41. Schindelin, J. et al. Fiji: an open-source platform for biological-image analysis. Nat Methods 9, 676–682 (2012).
Acknowledgements
We gratefully thank the members of our groups for discussions and interest in this project. The authors wish to
acknowledge the TRI-Genotoul and ITAV imaging facilities. Annaïck Desmaison was a recipient of a doctoral
fellowship from ARC (Association de la Recherche contre le Cancer), Ecole de l’Inserm-Liliane Bettencourt and
Fondation Bettencourt-Schueller. This work was supported by the CNRS, Université Paul Sabatier, Région Midi-
Pyrénées, La Ligue contre le Cancer comité de la Haute-Garonne and Agence Nationale de la Recherche ANR
(12-BSV5-0008-01).
Author Contributions
A.D., L.G., B.D. and V.L. conceived the experiments. A.D., L.G., V.L., S.T. conducted the experiments. P.W.
conceived and developed the software. A.D., L.G., P.W., V.L. analysed the results. A.D., B.D. and V.L. wrote the
manuscript. All authors reviewed the manuscript.
Additional Information
Supplementary information accompanies this paper at https://doi.org/10.1038/s41598-018-27060-6.
Competing Interests: The authors declare no competing interests.
Publisher's note: Springer Nature remains neutral with regard to jurisdictional claims in published maps and
institutional affiliations.
Open Access This article is licensed under a Creative Commons Attribution 4.0 International
License, which permits use, sharing, adaptation, distribution and reproduction in any medium or
format, as long as you give appropriate credit to the original author(s) and the source, provide a link to the Cre-
ative Commons license, and indicate if changes were made. The images or other third party material in this
article are included in the article’s Creative Commons license, unless indicated otherwise in a credit line to the
material. If material is not included in the article’s Creative Commons license and your intended use is not per-
mitted by statutory regulation or exceeds the permitted use, you will need to obtain permission directly from the
copyright holder. To view a copy of this license, visit http://creativecommons.org/licenses/by/4.0/.
© The Author(s) 2018
SCIeNTIFIC REPOrts | (2018) 8:8785 | DOI:10.1038/s41598-018-27060-6 8You can also read