Impact of Tax Effects on Profit Optimisation. Review of International Approaches
←
→
Page content transcription
If your browser does not render page correctly, please read the page content below
SHS Web of Conferences 92, 03016 (2021)                                       https://doi.org/10.1051/shsconf/20219203016
Globalization and its Socio-Economic Consequences 2020

         Impact of Tax Effects on Profit Optimisation.
         Review of International Approaches
         Serhiy Lyeonov1 , and Lucia Michalkova2,*
         1Department  of Economic Cybernetics, Sumy State University, 57, Petropavlivska str., Sumy, 40030,
         Ukraine
         2 Department of Economics, Faculty of Operation and Economics of Transport and Communications,

         University of Zilina, Univerzitna 1, 010 26 Zilina, Slovakia

                       Abstract.

                       Research background: Deteriorating economic conditions and the risk of
                       an impending crisis underline the need for significant profit optimization,
                       especially in the area of taxation.
                       Purpose of the article: The aim of this paper is to analyse and evaluate the
                       conditions for the creation of a tax shield in the V4 countries on a theoretical
                       level and to confront these findings with the value of the total tax shield in
                       the countries in question.
                       Methods: This study uses the method of two-way analysis of variance with
                       interaction, while also testing the assumptions of the model by normality
                       tests, homogeneity test and post hoc tests (Scheffé and Tukey methods).
                       Findings & Value added: A review of the sources of the tax shield shows
                       that the tax systems in all the countries examined offer similar conditions for
                       the application of tax shields. In a sample of more than 90000 companies, it
                       was found that the level of the total tax shield given as the effective tax rate
                       is similar in all countries examined (except Hungary). The branch of
                       affiliation plays a role only in the environment of Hungarian companies, on
                       the contrary, Slovak companies show homogeneity of the reported effective
                       tax rate. Country and industry affiliation does not have sufficient
                       explanatory power to predict the total tax shield. Conversely, other
                       indicators of financial performance (operating profit) may be suitable
                       indicators of the effective tax rate.

                       Keywords: tax shield; profit optimalisation; deprecation; effective tax rate

                       JEL Classification: G31, G32, H43

         1       Introduction
         The current economic conditions, rising debt, a global downturn in economic performance
         and the risk of a protracted crisis are a challenge for businesses, and profit optimization has
         gained in importance. In order to achieve the highest possible profit, business managers solve

         *
             Corresponding author: lucia.michalkova@fpedas.uniza.sk

   © The Authors, published by EDP Sciences. This is an open access article distributed under the terms of the Creative
   Commons Attribution License 4.0 (http://creativecommons.org/licenses/by/4.0/).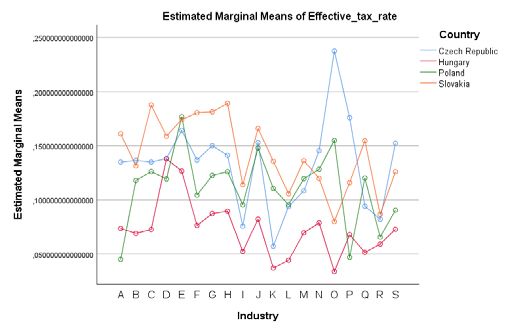
SHS Web of Conferences 92, 03016 (2021)                                 https://doi.org/10.1051/shsconf/20219203016
Globalization and its Socio-Economic Consequences 2020

         several tasks, such as optimizing the capital structure, reducing costs, as well as optimizing
         tax liability. Tax optimization and tax planning represent a complex system of decisions of
         financial managers in order to adjust (reduce) tax liability. This optimization can be achieved
         legally or illegally; such as tax avoidance or tax evasion.
             Within this tax planning, the most important role is played by the tax shield, i.e. reducing
         tax liability by managing business activities so as to maximize tax deductions [1]. Depending
         on which expenses are the basis for tax planning, we distinguish between interest and non-
         interest tax shields. While interest and the debt tax shield play a role in optimizing the capital
         structure, the non-debt tax shield consists of a wide range of deductible items such as
         depreciation, research and development costs or loss carry forward.
             In addition to profit after tax and tax liability, this phenomenon also affects the cash flow
         and value of the company. There is a split in the literature on the great impact of the tax
         advantage on the value of the company. Miller [2] states that the tax shield has zero value
         because, in a corporate and personnel tax system, the two effects cancel each other out. Other
         authors [3-6] quantify this advantage from 2.73% to 10%. Most of these studies are aimed at
         US companies, but even when examining samples from other countries, the proportion did
         not differ significantly despite differences in tax systems.
             The complexity of tax systems creates many opportunities for the creation of tax shields
         on a national and international scale. Each national tax system provides different conditions
         for optimizing corporate taxes and creating a tax shield. The aim of this paper is to analyse
         and evaluate the conditions for creating a tax shield in the context of the V4 countries and
         other European countries, focusing on four sources of the tax shield: interest, depreciation,
         R&D costs and loss carry forward. These findings are confronted with the value of the
         effective tax rate as a proxy for the total tax shield. The effective tax rate is examined on a
         sample of 90,000 Visegrad Four enterprises through a two-way analysis of variance and
         relevant statistical tests.
             The paper is structured as follows: in the first part, various approaches to quantification
         of the tax shield are reviewed, focusing on the specifics of national tax systems. This section
         also examines the four main sources of the tax shield in terms of its availability to businesses.
         The Methods section describes the pattern, variables, and two-way Anova procedure. In the
         last section Results and Discussion, we confront the theoretical findings and tax
         competitiveness ranking with the results of the model in order to answer the question of how
         significantly the conditions of national tax policy affect the value of the overall tax shield.

         2    Literature review

         2.1 Approaches to tax shield valuation
         Ever since the first ground-breaking study by [7] and the subsequent work of [8], the tax
         shield has been defined as a tax saving arising from the tax deductibility of interest paid. The
         interest tax shield is quantified as the product of the corporate tax rate, the cost of debt and
         the value of the debt. Modigliani and Miller [7] modified this formula to assume perfect
         capital markets; then the tax is dependent only on the value of the debt and the tax rate and
         the cost of the debt is irrelevant. Liu [9] calls this approach "tax shield capacity".
             The basic definition of a tax shield allows only interest as a source of tax advantage.
         Velez-Pareja confronts the definition of [7] in several papers [10,11]. He notes that the tax
         shield is dependent on operating profit (EBIT). The company achieves at least a partial tax
         shield if EBIT is positive. The partial tax shield represents the difference between the tax
         paid by an unlevered and a levered company. Velez-Pareja [11] realized his original analysis
         about the existence of a tax loss. A negative pre-tax profit means that the tax shield is not

                                                         2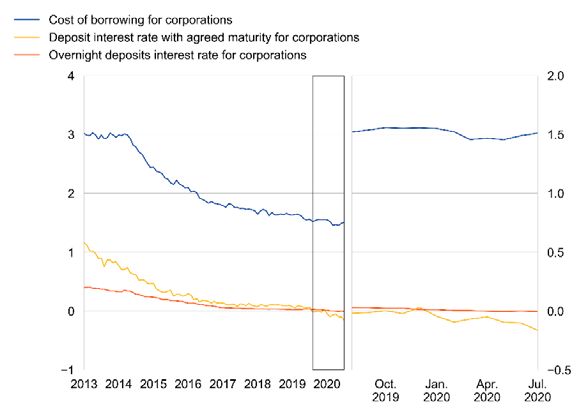
SHS Web of Conferences 92, 03016 (2021)                                  https://doi.org/10.1051/shsconf/20219203016
Globalization and its Socio-Economic Consequences 2020

         applied. Notwithstanding, if the tax system allows a loss carried forward, then the tax shield
         is not applied in one year, but is divided into two periods. This author distinguishes three
         risks associated with a tax advantage: the risk of debt default, the risk of market costs of debt
         and the operational risk associated with operating profit.
             In addition to the mentioned models, tax profit optimization also takes into account
         shareholder taxation. Miller's [2] most commonly used model is based on the Anglo-Saxon
         (American) tax system, which allows double taxation of profits on the part of both the
         company and shareholders. If the corporate and personnel taxes are equal, then the effect of
         the tax advantage is cancelled and it does not matter the capital structure. The second effect
         that Miller deals with is the equality of the tax rate on dividends and interest (withholding
         tax). If these two effects are identical, then the effect of personnel taxation is zero and the tax
         shield is quantified according to [7]. Velez-Pareja [12] notes that the basic shortcoming is the
         equal taxation of shareholders and debt holders. This presumption only applies if the
         shareholders and the debt holders are the same person. In real companies, however, these
         people are different and the net value of the tax shield is not zero. A comparison of Miller's
         model and its modification according to Velez-Pareja [12] revealed that Miller's model does
         not reflect the value of the dividend when quantifying the net value of the tax benefit and
         systematically overestimates the value of the tax shield even if the shareholder and debt
         holder are the same.
             The existence of personnel taxation and its implementation into the tax shield model
         encounters a barrier to the diversity of tax systems. Castillo, Niño and Zurita [13] responded
         to this by creating a general model of the value of the tax shield that is applicable in any tax
         system, regardless of the relationship between corporate and dividend tax. They created seven
         variations of the general model (for the classical system, modified classical system, dividend
         partial inclusive system, no shareholder taxation system, partially integrated or partially
         imputation system, fully integrated or fully imputation system and other systems). These
         variations fully cover the tax systems of OECD countries. Cnossen [14] examining EU
         systems notes that Member States other than Sweden and the UK do not levy a withholding
         tax on dividends. The diversity of tax systems in the EU determines the application of these
         modifications in practice.
             The dividend distribution system in force in Estonia, Latvia (since 2018) and Georgia
         (since 2017) allows only part of the profit in the form of dividends to be taxed; retained
         earnings are not taxed. Taxation of only distributed profits has been shown to increase
         investment activity in order to minimize the tax burden [15]. Estonia, along with Latvia, has
         the first two places in the Corporate Tax Rank (International Tax Competitiveness Index)
         2019 [16].
             Tax shield models largely apply the terms of US tax systems; to a lesser extent, the
         conditions of other tax systems are included, mainly in the area of personnel taxes. In terms
         of sources of tax benefit, the main examined deductible cost is interest. Other sources of tax
         advantage are less explored than e.g. depreciation, research and development costs and tax
         loss. These other factors of the tax advantage vary depending on the tax system, despite some
         harmonization of the tax systems of the EU Member States. In particular, the conditions of
         the V4 countries may differ from other Member States of Western Europe. For this reason, it
         is necessary to explore the possibilities of tax optimization in these countries at the theoretical
         level and at the level of the effective tax rate as a proxy for the total tax shield.

         2.2 Sources of the tax shield in the V4 countries
         As mentioned in the previous subchapter, the most significant sources of tax benefit are the
         four tax deductible items: interest paid, depreciation, R&D costs and tax loss deduction. From
         the corporate point of view, in addition to interest and decisions on the capital structure,

                                                         3
SHS Web of Conferences 92, 03016 (2021) https://doi.org/10.1051/shsconf/20219203016
Globalization and its Socio-Economic Consequences 2020
depreciation is important for decisions on the method of acquisition of non-current assets
(buy vs. leasing). Loss carry forward plays a similar role in the application of income
smoothing or earnings management.
Interest expense and the capital structure of companies depend primarily on the
development of interest rates in the economy. Despite the fact that only Slovakia belongs to
the Euro area, interest rates in all V4 countries depend directly or indirectly on the
development of ECB interest rates. Since 2015, the ECB has pursued a policy of quantitative
easing (a policy of cheap money) aimed at supporting investment activity and economic
growth. This policy is reflected in the extreme decline in interest rates to zero or negative
values, as shown in Fig. 1
Fig. 1 Bank interest rates in Euro area to July 2020 [17].
The cost of borrowing as well as deposit interest rates and overnight deposit interest rates
have been declining since 2015; in the first and second quarters of 2020, the cost of borrowing
did not change significantly compared to the previous period. Based on the loan amount,
these costs ranged from 1.17% to 1.96% [17]. Relatively low interest rates support the growth
of corporate investment, however, they can have a negative impact on the value of the interest
tax shield. The second negative of low interest rates is the extreme increase in corporate
indebtedness and the increase in the risk of financial distress.
The tax deductibility of interest is conditioned by two factors: the link between the interest
paid and the object of the business and the relationship between the debtor and the creditor.
If these persons are related parties, then the tax shield is not recognized in full and thin
capitalization is applied. The purpose of this is, firstly, to reduce the outflow of tax revenues
of the state, and secondly to reduce the credit risk of companies (their indebtedness). The EU
has introduced Council Directive 2016/1164 [18], known as the ATAD (The Anti-Tax
Avoidance Directive), as part of the harmonization of thin capitalization and transfer pricing
rules in the common market. This directive was implemented in all states of the European
Union until 31.12.2018. European countries have implemented these rules in various ways,
most often as the 25% EBITDA rule, i.e. the value of interest exceeding 25% of EBITDA is
not tax deductible. Slovakia belongs to such countries; other countries such as Hungary,
Poland, the Netherlands, Spain or Romania have introduced two variations of this rule - 30%
of EBITDA or the maximum tax deductible interest expense. The Czech Republic, on the
other hand, combines the 30% EBITDA model, the maximum interest value (80 mil. CZK),
4SHS Web of Conferences 92, 03016 (2021) https://doi.org/10.1051/shsconf/20219203016
Globalization and its Socio-Economic Consequences 2020
with the debt to equity ratio rule (4:1). A specific case is Austria, where the thin capitalization
rule is not legally established; there is only a recommendation to apply the debt to equity
ratio model 3: 1 or 4: 1 depending on the industry [19].
Depreciation is the second major source of tax benefits. The Slovak and Czech Republic
share similar rules for depreciation and the existence of 6 depreciation groups of assets. In
Slovakia, accelerated depreciation is permitted in only two depreciation groups and the
longest depreciation period is 40 years. On the contrary, in the Czech Republic it is up to 50
years and accelerated depreciation is allowed in all depreciation groups. Polish companies
can use accelerated depreciation only for certain assets; moreover, the Polish tax system
favours companies by one-time depreciation for assets with a purchase price lower than PLN
10,000, or start-up companies can depreciate assets on a one-off basis up to PLN 50,000.
Hungarian companies use a similar system, including straight-line depreciation, a
depreciation period of 2 to 50 years and a one-off depreciation. Austria applies a relatively
loose tax depreciation system, where depreciation rates are given only for certain types of
assets [19].
R&D costs are another important component of the overall tax shield by which the
government wants to support the company's innovative policy. In the V4 countries, there is
a growing massive support for these activities by tax benefits. In Slovakia, since 2015, the
super-deduction has been growing from 25% of R&D costs to the current 200% for the 2019
tax period. A total of 353 super-deductions in the amount of CZK 45.8 million were applied
for the period 2015-2017. EUR, most entities were recorded in 2017 (158). The most
represented industries were companies from NACE, industry C – Manufacturing [20].
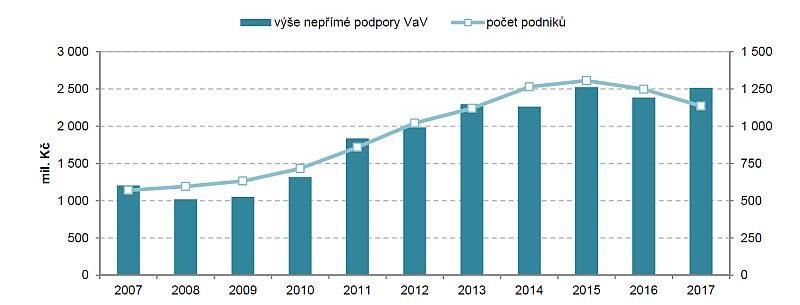
The Czech Republic introduced a super-deduction of R&D costs in 2005. The maximum
value is 100% of R&D costs and an additional 10% quantified as the difference between the
costs of the current year and the costs of the previous year. The overall development of R&D
costs in the Czech Republic is shown in Fig. 2.
Indirect support of R&D Number of companies
mil. CZK
Fig. 2 R&D cost in the Czech Republic since 2007 [21]
Compared to Slovakia, a disproportionately more companies used the tax advantage
(1,135 companies in 2017). In terms of ownership, however, they were mainly foreign
companies operating in the automotive industry. The number of enterprises in the last
monitored period decreased compared to the peak in 2015 [21].
In Poland, since 2018, the principle of 100% of R&D cost or 150% (research centres) has
been applied. Since 2019, it has adopted a patent box that allows for a 5% reduction in
corporate tax on qualified intellectual property income [22]. Among the V4 countries,
Hungary has the most favourable R&D cost policy; 300% of R&D up to 50 mil. HUF if the
tax entity cooperates with a university or other research institution. Western European
countries differently support the innovative activities of companies through R&D. Denmark
5SHS Web of Conferences 92, 03016 (2021) https://doi.org/10.1051/shsconf/20219203016
Globalization and its Socio-Economic Consequences 2020
or the United Kingdom offer a super-deduction equivalent to 100% (130%) of the R&D cost.
Dutch and Austrian companies can take advantage of a tax advantage of 14% to 40% of the
R&D cost, depending on the conditions set. As in the case of depreciation, Estonia and Latvia
do not apply the R&D cost advantage scheme, but in the dividend distribution system, the
retained earnings used for R&D are not taxed [19].
The tax advantage of the loss is the last significant source of the tax advantage. The
existence of a tax loss has a negative effect on the application of other types of tax shields in
the year in which the tax loss arose. However, the taxpayer may carry all or part of the tax
loss to subsequent tax periods. Slovak companies can carry a tax loss evenly over 4
consecutive periods; from 2020 up to 50% of the tax base for a period of 5 years from the
occurrence of the tax loss. Micro-taxpayers, who must meet pre-determined conditions, are
not limited by the condition of 50% of the tax base, they can write off the tax loss even once.
Similar conditions apply in the Czech Republic and Poland; one-time deduction can be
applied by all taxpayers regardless of the type of taxpayer (there is no group of micro-
taxpayers). Hungarian companies can offset losses before 2015 indefinitely until 2025, after
this year for a maximum of 5 years according to the FIFO principle up to a maximum of 50%
of pre-tax profit. Other EU countries can be divided into four groups: tax carried forward
time limit (Finland - 10 years, the Netherlands - 9 years, Greece - 5 years, Luxembourg - 17
years); limit of percentage of year tax base (Denmark - 60% of the tax base, Lithuania - 70%
of the tax base, Slovenia - 50% of the tax base); a combination of the previous ones (Portugal)
and a dividend distribution system (Estonia, Latvia), which do not deduct the tax loss from
the tax base [19].
3 Methods
The aim of this paper is to analyse and evaluate the conditions for the creation of a tax
shield in the V4 countries on a theoretical level and to confront these findings with the
value of the total tax shield in the countries in question. The previous chapter showed that
the conditions for obtaining tax benefits are similar in these countries, which suggests that
the value of the total tax shield may not differ.
This study analyses two qualitative factors, industry and country affiliation. The
breakdown by country is given by the different conditions of tax systems and the possibility
of achieving a tax shield. The second factor is industry; its classification is conditioned by
the different financial performance of companies in the sectors. Also, according to data on
the use of the R&D cost deduction in Slovakia and the Czech Republic, this tax advantage
is the most used by manufacturing companies (automotive industry). Industry membership
was assigned according to the NACE rev. 2. The total tax shield is estimated by an effective
tax rate that reflects all tax benefits used by businesses.
A two-way ANOVA was chosen as a suitable method to test the impact of these factors
on the total tax shield. In contrast to the one-way version, the method also analyses an
interaction term indicating that the combination of both factors is significant for estimating
the total tax shield. This method is subject to several assumptions (normality of subsets,
homogeneity of variances, independence of cases and no outliers). These assumptions are
tested by appropriate tests (Kolmogorov-Smirnov test, Levene's test) and outliers were
removed by wisorizing at 1% and 99% percentile. If the assumptions are not met, then the
two-way Anova is tested on a robust basis (with robust standard errors).
Eq. 1 shows a regression form of ANOVA.
= + + + ∙ ∙ + (1)
Where: - effective tax rate, = 1,2, … , 90324 – number of case in net sample,
Country - qualitative variable {The Czech Republic, Hungary, Poland Slovakia},
6SHS Web of Conferences 92, 03016 (2021) https://doi.org/10.1051/shsconf/20219203016
Globalization and its Socio-Economic Consequences 2020
- qualitative variable, industry classification according to NACE rev. 2,
∙ ∙ - interaction term
The sample for this study was obtained from the database Amadeus; two selection
criteria were specified - total assets of at least EUR 1 million and the registered office of the
company in one of the countries examined. The gross sample contained 91,154 companies
and their financial indicators of 2018. SPSS program was used for the examination of
samples and achieve the objective of the paper.
4 Results and discussion
The first step in analysing the impact of the tax system and sectoral structure on the overall
tax shield is to analyse a sample of companies. The gross sample was primarily adjusted for
enterprises with missing values of key variables. In the second step, outliers were detected
via the 1% and 99% percentiles. These outliers were wisorized, making the sample larger
than using other outlier removal methods. The net sample contained 90,324 businesses. The
structure of enterprises by industry is shown in Fig. 3.
2,90%2,20% 14,21%
4,06% 0,50%
6,33% 1,84%
2,98%
1,88%
22,31% 7,35% 0,04%
0,42%
1,23%
6,14%
0,90%
8,13% 0,55%
2,12% 21,26%
A B C D E F G H I J K L M N O P Q R S
Fig. 3 Industry structure of sample.
Wholesale and retail companies have the largest share in the sample, while
manufacturing companies have the second largest share in the sample. The real estate sector
accounts for more than ten percent. Other sectors have a relatively lower share of the
sample. Fig. 3 shows the non-uniformity of the sub-samples, which indicates that one of the
ANOVA assumptions is not met. Subsequently, we examined the value of the total tax
shield by descriptive statistics.
Table 1. Descriptive statistics of total tax shield (effective tax rate)
Factor Effective tax rate (total tax shield proxy)
Std. % of Total
Country Mean Median N
Deviation N
the Czech Republic 0,1275 0,1751 0,2079 23,55% 21270
Hungary 0,0715 0,0514 0,1412 21,96% 19835
Poland 0,1161 0,1036 0,2384 39,77% 35926
Slovakia 0,1579 0,2031 0,2467 14,72% 13293
The mean values of the effective tax rate indicate that Slovak companies are subject to
the highest level of taxation, while Hungarian companies are the least taxed. The ranking of
7SHS Web of Conferences 92, 03016 (2021) https://doi.org/10.1051/shsconf/20219203016
Globalization and its Socio-Economic Consequences 2020
countries according to the average values of effective taxation corresponds to the values of
statutory tax rates. On average, the surveyed companies achieve an overall tax advantage
because their effective tax rate is lower than statutory. However, in terms of median values,
Polish companies achieve the most significant tax advantage; on the other hand, Slovak
companies to a small extent apply the tax benefits given by the state (the effective tax rate is
close to the statutory one). However, the mean values of the total tax shield of Slovak and
Polish companies have the largest deviation indicating a high number of companies that do
not use / use tax shields to a small extent.
The analysis of variance is based on a set of assumptions that we tested. First, we tested
the normality of the subsamples by the Kolmogorov-Smirn test at the level of 0.05. A
significant difference between the mean and the median indicates that this criterion was not
met, which was confirmed by the test results. The second assumption of homogeneity of
subsample scatterings was also rejected. The reason for rejecting both assumptions may be
due to inequality in the size of the subsamples. For these reasons, a two-way ANOVA with
robust standard variances was used, this eliminates the occurrence of type I error. A summary
ANOVA table is shown in Table 2.
Table 2. Summary table of two-way ANOVA
Type III Partial
Source Sum of df Mean Square F Sig. Eta
Squares Squared
Corrected Model 115,130a 75 1,535 33,660 0,000 0,027
Intercept 81,776 1 81,776 1793,130 0,000 0,019
Country 4,316 3 1,439 31,545 0,000 0,001
Industry 31,251 18 1,736 38,070 0,000 0,008
Country * Industry 16,829 54 0,312 6,834 0,000 0,004
Error 4115,794 90248 0,046
Total 5428,389 90324
Corrected Total 4230,924 90323
R Squared = ,027 (Adjusted R Squared = ,026)
The results of the model show that both examined factors significantly explain the
changes in the value of the tax shield. The interaction term reports that the effective tax rate
varies not only in different countries but also in different industries. The strength of the
interaction between the factors is shown in Fig. 4.
Fig. 4 Interaction between country and industry affiliation
8SHS Web of Conferences 92, 03016 (2021) https://doi.org/10.1051/shsconf/20219203016
Globalization and its Socio-Economic Consequences 2020
The strong interaction between the country and the industry indicates that, despite some
harmonization of tax systems and the similarity of the conditions for achieving tax benefits,
the effective tax rate varies in the countries and sectors monitored. We examined the
difference in effective tax rates as simple main effects and performed a one-way ANOVA
analysis for each country. This analysis has shown that the most significant difference
between the total tax shield across sectors is shown by Hungarian companies. On the
contrary, the tax advantage in Slovak companies does not change significantly on the basis
of sectoral affiliation [23]. Polish companies have a significantly higher tax advantage in
agriculture and, conversely, tax shields in the field of water management are applied to a very
small extent. Overall, businesses in Central Europe (excluding Hungary) provide a similar
rate of total tax shield regardless of country affiliation.
5 Conclusion
In conclusion, we can state that, as described in the theoretical level in Chapter 2.2, the tax
systems of the V4 countries provide similar conditions for tax optimization of profits.
However, the results of the ANOVA model describe that the explanatory power of the
investigated qualitative variables is not sufficient. These results confirm the ranking of
countries according to The International Tax Competitiveness Index 2019 - Corporate Tax
rank, which ranked Hungary in fourth place, the Czech Republic in 9th place and Poland and
Slovakia in 13. /14. place [16]. The financial performance of companies, or their operating
profit [24, 25], have a higher impact on the value of the tax shield, as confirmed by Velez-
Pareja [10]. For this reason, we propose to use a wider range of financial performance
indicators in further research on tax profit optimization to create a comprehensive model of
profit optimization.
This research was financially supported by the Ministry of Education, Science, Research and Sport of
the Slovak Republic and Slovak Academy of Sciences VEGA 1/0121/20: Research of transfer pricing
system as a tool to measure the performance of national and multinational companies in the context of
earnings management in conditions of the Slovak Republic and V4 countries.
References
1. Raisova, M., Regaskova, M., Lazanyi, K. (2020). The financial transaction tax: an
ANOVA assessment of selected EU countries. Equilibrium. Quarterly Journal of
Economics and Economic Policy, 15(1), 29-48.
2. Miller, M.H. (1977). Debt and taxes. Journal of Finance, 32(2), 261-275.
3. Doidge, D., Dyck, A. (2015). Taxes and corporate policies: Evidence from a quasi-
natural experiment. Journal of Finance, 70(1), 45-89.
4. Kemsley, D., Nissim, D. (2002). Valuation of Debt Tax Shield. Journal of finance, 42(5),
2045-2074.
5. Clemente - Almendros, J., Sogorb-Mira, F. (2017). How much do the tax benefits of debt
add to firm value? Evidence from spanish listed firms. Revista de Economía Aplicada,
25(74), 105-129.
6. Menichini, A. A. (2017). On the value and determinants of the interest tax shields.
Review of Quantitative Finance and Accounting, 48(3), 725 – 748.
7. Modigliani F., Miller M.H. (1963). Corporate income taxes and the cost of capital. A
correction. The American Economic Review, 53(3), 433-443.
9SHS Web of Conferences 92, 03016 (2021) https://doi.org/10.1051/shsconf/20219203016
Globalization and its Socio-Economic Consequences 2020
8. Brealey R.A, Myers, S.C, Allen, F. (2010). Principles of Corporate Finance. 10th ed.
New York: McGraw-Hill/Irwin.
9. Liu, Y. (2009). The slicing approach to valuing tax shields. Journal of Banking &
Finance, 33(6), 1069-1078.
10. Velez - Pareja, I. (2013). Return to Basics: Are You Properly Calculating Tax Shields?
Análisis Financiero, 122, 6-17.
11. Velez - Pareja, I. (2016). Tax shield, financial expenses and losses carried forward.
Cuadernos de Economica. 35(69), 663 - 689.
12. Velez – Pareja, I. (2017). Do Personal Taxes Destroy Tax Shields? A Critique to Miller’s
(1977) Proposal. Emerging Markets Finance and Trade, 53(10), 2199 – 2214.
13. Castillo, A., Niño, J., Zurita, S. (2017). Debt Tax Shields Around the OECD World.
Emerging Markets Finance and Trade, 53(1), 26 – 43.
14. Cnossen, S. (2017). Corporation taxes in the European Union; Slowly moving toward
comprehensive business income taxation? International Tax and Public Finance, 25(3),
808-840.
15. Kantsukov, M., Sander, P. (2018). A lesson in valuation from Estonia: the difference
between the fundamental value of equity under distributed and traditional profit taxation
systems. Verslas teorija ir praktika, 9(1), 146-156.
16. Tax Foundation (2019). The International Tax Competitiveness Index 2019.
Washington: Tax Foundation.
17. European Central Bank (2020, September 2). Euro area bank interest rate statistics: July
2020. ECB. Retrieved from: https://www.ecb.europa.eu/press/
pr/stats/mfi/html/ecb.mir2007~61960f8a6e.en.html
18. Council Directive (EU) 2016/1164.
19. PWC (2020). Worldwide Tax summaries. Retrieved from:
https://taxsummaries.pwc.com
20. Financna sprava SR (2018). Zoznam danovych subjektov, ktori si uplatnili odpocet
vydavkov na vyskum a vyvoj. Retrieved from:
https://www.financnasprava.sk/sk/elektronicke-sluzby/verejne-
sluzby/zoznamy/zoznam-danovych-subjektov-kto
21. Veda a Vyskum (2019, April 12). Firem vyuzivajicich danove odpocty na vyzkum a vyvoj
bylo opet mene. Retrieved from: https://vedavyzkum.cz/politika-vyzkumu-a-
vyvoje/politika-vyzkumu-a-vyvoje/firem-vyuzivajicich-danove-odpocty-na-vyzkum-a-
vyvoj-bylo-opet-mene.
22. Polish Investment & Trade Agency (2019). Corporate Income tax. Retrieved from:
https://www.paih.gov.pl/polish_law/taxation/cit#81
23. Novak Sedlackova, A., Svecova, D., Tomova, A. (2019). Slovak Airports as Profit/Loss
Making Entities: Consequences for Transport Policies. Journal of Tourism and Services,
10(19), 153-163.
24. Siekelova, A., Kovacova, M., Adamko, P., Stehel, V. (2019). Profit Management as an
Instrument for SMEs Developing: The Case for Slovakia. Marketing and Management
of Innovations, 3, 285-296.
25. Dvorsky, J., Petrakova, Z., Polach, J. (2019). Assessing the Market, Financial, and
Economic Risk Sources by Czech and Slovak SMEs. International Journal of
Entrepreneurial Knowledge, 7(2), 30-40.
10You can also read