Impact Study on a Minimum Wage Increase in the Agricultural Sector - cahrc
←
→
Page content transcription
If your browser does not render page correctly, please read the page content below

Impact Study on a Minimum Wage Increase in the Agricultural Sector

Final report presented to AGRIcarrières - Comité sectoriel de main-d’oeuvre de la production agricole
and the Union des producteurs agricoles du Québec

                                                  July 11, 2017

408 Victoria Ave., Suite 3, Saint-Lambert, QC J4P 2H9                               forestlavoieconseil.com
   (450) 812-8409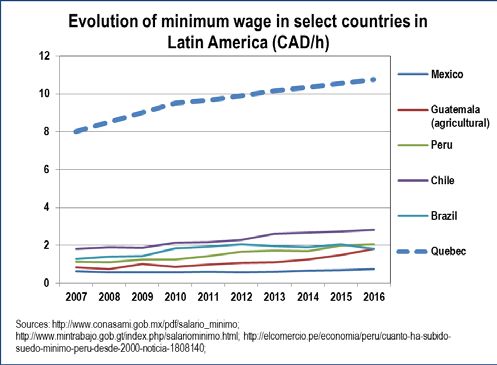
Impact Study on a Minimum Wage Increase in the Agricultural Sector
Final Report

                                                  Team
   Team lead:                            Gilbert Lavoie, agronomist, M.Sc., Forest Lavoie Conseil
                                         Jean-François Forest, agronomist, M.Sc., Forest Lavoie Conseil

   Research, analysis and editing:       Gilbert Lavoie, agronomist, M.Sc., Forest Lavoie Conseil
                                         Jean-François Forest, agronomist, M.Sc., Forest Lavoie
                                         Conseil Claude Hamel, agronomist, M.Sc., Forest Lavoie
                                         Conseil Edjigayehu Seyoum, M.Sc., consultant

   Document review:                      Lota D. Tamini, Ph.D., Université Laval
                                         Claude Hamel, agronomist, M.Sc., Forest Lavoie
                                         Conseil Gilbert Lavoie, agronomist, M.Sc.,
                                         Forest Lavoie Conseil Rémy Lambert, Université
                                         Laval

   French-language revision:             Ève Sylvestre

   Thanks:            We would like to thank the actors and participants who contributed to this study by
                      sharing their time and experience. More specifically, we would like to thank:
                      • AGRIcarrières - Comité sectoriel de main-d’oeuvre de la production agricole
                      • Association des producteurs de fraises et framboises du Québec
                      • Quebec Produce Growers Association
                      • Centre d’études sur les coûts de production en agriculture
                      • Quebec Reference Center for Agriculture and Agri-food
                      • Les Éleveurs de porcs du Québec
                      • Les Éleveurs de volailles du Québec
                      • Financière agricole du Québec
                      • Federation of Quebec Maple Syrup Producers
                      • Fédération des producteurs d’œufs du Québec
                      • Fédération québécoise des producteurs de fruits et légumes de transformation
                      • Les Producteurs de lait du Québec
                      • Les Producteurs de pommes du Québec
                      • Union des producteurs agricoles

Suggested citation: Forest Lavoie Conseil (2017). “Impact Study on a Minimum Wage Increase in the
Agricultural Sector”. Report presented to AGRIcarrières.

                                     Better understand – Devise – Implement
Forest Lavoie Conseil                                                                                     i
Impact Study on a Minimum Wage Increase in the Agricultural Sector
Final Report

                                                                     Table of Contents
1. Mandate, objectives and process ....................................................................................................................................... 1
          1.1 Mandate context and comprehension ..................................................................................................................... 1
          1.2 Mandate objectives ................................................................................................................................................... 1
          1.3 Process ...................................................................................................................................................................... 3
2. Document review .................................................................................................................................................................. 5
          2.1 Document review objectives .................................................................................................................................... 5
          2.2 Economic theories: comparative and competitive advantages ............................................................................ 5
          2.3 Price transmission factors in agri-food sectors..................................................................................................... 9
          2.4 Agri-food sector characteristics: competition and price transmission
              factors ...................................................................................................................................................................... 12
          2.5 Effects of a minimum wage increase on households, average salary and employment.................................. 26
          2.6 Household income and income elasticity measures ........................................................................................... 26
          2.7 Average salary and employment by sector .......................................................................................................... 27
          2.8 Ripple effects of a minimum wage increase ......................................................................................................... 29
          2.9 Document review conclusions............................................................................................................................... 31
3. General and specific data sheets: Approach and primary observations ...................................................................... 34
          3.1 General workforce data sheet (Appendix 1) ......................................................................................................... 34
          3.2 Sector data sheets .................................................................................................................................................. 36
4. Possible solutions .............................................................................................................................................................. 41
          4.1 Positive and negative effects of an increased minimum wage ........................................................................... 41
          4.2 Examples of payroll expense relief programs/measures for businesses .......................................................... 42
5. Conclusion and recommendations................................................................................................................................... 46

     Appendix: General data sheet: Agricultural production in Quebec............................................................................... 47

                                                            Better understand – Devise – Implement
Forest Lavoie Conseil                                                                                                                                                          ii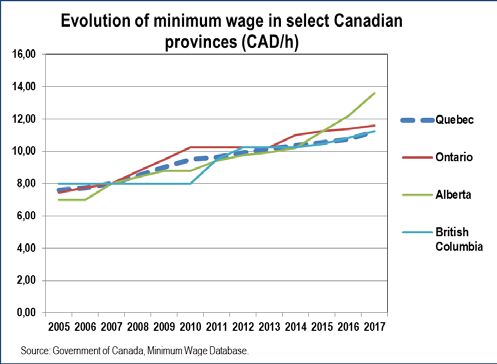
Impact Study on a Minimum Wage Increase in the Agricultural Sector
Final Report
1. Mandate, objectives and process
1.1 Mandate context and comprehension
For several months, people across Canada and in Quebec have been discussing the potential ramifications of increasing the
minimum wage to $15/hour. While the Government of Quebec has not taken the leap and directly increased its minimum wage
to $15/hour, in January 2017 it announced that it would gradually increase the minimum wage over four years. According to
the announcement, Quebec’s minimum wage will gradually increase by $1.70/hour, rising from $10.75/hour in 2016 to
$12.45/hour in 2020.1
In the wake of the announcement and the ensuing discussions surrounding a significant increase in the minimum wage,
AGRIcarrières and its partners decided to take a closer look at the ways in which a minimum wage increase could affect the
agricultural sector. The agricultural industry, particularly its horticultural sectors (fresh vegetables, strawberries and
raspberries, apples, etc.), has some very real concerns. Labour represents a significant proportion of its production costs, and
competition with imported products is particularly fierce. It is important to determine whether agricultural businesses could
remain competitive and profitable if the minimum wage were to suddenly increase. It is equally important to determine how this
increase would affect various agricultural sectors according to their specific business environments.
AGRIcarrières and its partners therefore mandated Forest Lavoie Conseil (FLC) to study the potential impact of a sudden
minimum wage increase on the competitiveness of Quebec’s various agricultural sectors for the purpose of developing
mitigation strategies if needed. Two minimum wage increase scenarios were studied: one where the minimum wage was
raised to $12.45/h, which is the rate announced by the Government of Quebec for 2020; and one where the minimum wage
was raised to $15/h, which is the rate currently being discussed in several Canadian provinces and American states.
1.2 Mandate objectives
The primary objective of this mandate:
• Identify and explain the potential impact of a sudden minimum wage increase on the competitiveness of
Quebec’s various agricultural sectors in order to develop mitigation strategies, where necessary.
The specific objectives were:
• Review existing literature to gain a better understanding of the problem and to predict the repercussions of a
sudden, significant minimum wage increase. In particular, this literature covers:
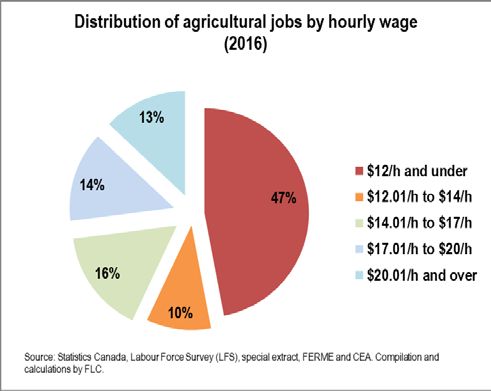
the evolution of the minimum wage, with an overview of the current situation in Quebec, in other potentially
competing provinces, and in other agricultural regions in North America, Central America and certain South
American countries, namely Brazil, Peru and Chile;
how price increases are passed along from a sector to the consumer, based on the sector’s structure and
makeup as well as the openness of its interprovincial and/or international markets;
the economic theories and studies about comparative advantages, industry competitiveness and business
and employment localization/offshoring;
1
http://www.fil-information.gouv.qc.ca/Pages/Article.aspx?idArticle=2501195313
Better understand – Devise – Implement
Forest Lavoie Conseil 1Impact Study on a Minimum Wage Increase in the Agricultural Sector
Final Report
the ripple effects of an increased minimum wage on employees receiving higher wages; and
consumer purchasing behaviours following a relative increase in their revenue and a relative increase in the
price of certain local foods.
• Assess the current labour conditions (job structure, payroll size, etc.) and the particular business environment
(sector structure, pricing methods, current and potential competition,2 etc.) that could exacerbate or mitigate the
effects of a sudden, impactful minimum wage increase in the agricultural production industry, particularly within
the following sectors: horticulture (strawberries/raspberries, apples, fresh vegetables), processing fruits and
vegetables, dairy, pork, maple products, poultry, and table eggs.
• Catalogue and analyze economic impacts (provincial and extraprovincial production costs, relationship with
income security programs, sale price of a food product, replacement value, market access, competition in open
markets, business losses, offshoring, etc.) and potential structural changes (changes in salary structure, job
losses, business closures, etc.) while identifying similarities and differences of the effects between each
agricultural sector.
• Develop potential options based on policies or exceptions that have been developed in other areas to protect the
agricultural sector from the effects of a minimum wage increase.
2 For example, current competition may come mostly from imports. However, a minimum wage increase could increase the competitiveness of
other Canadian provinces.
Better understand – Devise – Implement
Forest Lavoie Conseil 2Impact Study on a Minimum Wage Increase in the Agricultural Sector
Final Report
1.3 Process
In order to reach the objectives that were set, FLC used the process shown in the following diagram.
Figure 1: Study process
Using this process, the following activities were performed:
• Creation of a pilot committee composed of representatives from AGRIcarrières, the UPA and specialized groups
whose production was being studied:
o Two meetings were held with the pilot committee.
o Regular follow-up meetings were held (by phone, email or in person) with project managers at
AGRIcarrières.
• Relevant documents were gathered and a document review was performed.
• Specific consultation meetings were held with the sectors being studied to determine various aspects, such as:
o Workforce overview (size, pay, etc.)
o Business environment and pricing processes
o Farm type
o Information sources and proposed approach for the impact analysis
o Issues related to a minimum wage increase in the sector, etc.
Better understand – Devise – Implement
Forest Lavoie Conseil 3Impact Study on a Minimum Wage Increase in the Agricultural Sector
Final Report
• From the information gathered:
o A general agricultural workforce data sheet was created. This sheet was checked many times throughout
the project, both by AGRIcarrières and by the production sectors being studied.
o Nine sector data sheets were produced. Each illustrates the impacts of a minimum wage increase to
$12.45/h or $15/h on each of the sectors being studied. These data sheets were checked by each sector
several times throughout the project.
• Potential options were analyzed. Using case studies of other jurisdictions that successfully protected the agricultural
industry (or other industries) from the effects of a minimum wage increase, the potential options for agricultural
production sectors in Quebec were analyzed.
Better understand – Devise – Implement
Forest Lavoie Conseil 4Impact Study on a Minimum Wage Increase in the Agricultural Sector
Final Report
2. Document review
2.1 Document review objectives
This document review aims to provide a clearer image of the problem and identify elements that are essential to the impact
analyses for the production sectors being studied. More specifically, it covers:
• the economic theories and studies about comparative advantages, industry competitiveness and business and
employment localization/offshoring;
• the ways prices are transmitted from a sector to its consumers, depending on the sector’s structure and makeup and
the openness of its interprovincial and/or international markets;
• the effects of a minimum wage increase on:
o consumer purchasing behaviours following a relative increase in their revenue and a relative increase in the
price of certain local foods;
o businesses;
• the ripple effects of an increased minimum wage on employees receiving higher wages.
The information gathered from the document review will guide the impact analyses for the nine agricultural production sectors
being studied. This information will also provide a clearer picture of the factors that affect the anticipated impacts, as well as
their severity, particularly in terms of competitiveness.
2.2 Economic theories: comparative and competitive advantages
This section discusses various economic theories regarding comparative advantages, sector competitiveness and business
and employment localization/offshoring. It also lists various factors that influence sectors’ competitiveness. For example, it
may show how a price increase (such as one driven by an increased minimum wage) in one area can affect its
competitiveness with other production regions or lead to job offshoring.
2.2.1 Comparative advantage theories
The theories of absolute advantage and comparative advantage were first formalized by Ricardo in 1817 (Feenstra and
Taylor, 2008).3 An economy has an absolute advantage when its unit price for a good is lower than that in another economy.
Comparative advantage, on the other hand, measures the opportunity cost of producing one good over another. In other
words, absolute advantage analyzes a single good, while comparative advantage analyzes several goods. In Ricardo’s model,
comparative advantage is created through a difference in production technologies. The comparative advantage theory can
also be applied to international trade models based on the availability of resources (production factors). These two theories
have led to many other international trade models, in which comparative advantages are determined by differences in
technology and production factor endowments. Additionally, Helpman (2010)4 states that institutions play a role, whereas
3 Feenstra, R.C. & A.M. Taylor. 2008. International Economics, Worth Publishers, New York.
4 Helpman,
E. 2010. Labor Market Frictions as a Source of Comparative Advantage, with Implications for Unemployment and Inequality.
NBER Working Papers 15764, National Bureau of Economic Research, Inc.
Better understand – Devise – Implement
Forest Lavoie Conseil 5Impact Study on a Minimum Wage Increase in the Agricultural Sector
Final Report
Mani and Hwang (2004)5 posit that comparative advantages come from consumer demand. The latter state that consumer
preferences and income can drive the price of a final good down (or up), providing an advantage to the countries producing
this good. Siggel (2006)6 therefore suggests a broader definition of comparative advantage, given that the transition from a
“simple” economy to one with many goods and production factors means that comparative advantage comes from primary
(labour, capital, etc.) or intermediate (energy, animal feed, manure, etc.) factors, from technological differences or from
differing production scales. Since there are so many potential sources of comparative advantage, measuring it can be difficult.
This is particularly evident in sectors that have supply management, since they are regulated; resource allocation is not
determined solely be economic factors. However, as Larue and Gervais (2008)7 have pointed out, few studies of the
agricultural industry have measured comparative advantage.
2.2.2 Competitiveness theories
In any case, a country’s comparative advantage implies that it is more competitive in its provision of a good. It is from this
concept that the ideas of competitiveness and competitive advantage emerged. However, it has only recently begun to be
used on a macroeconomic (country) scale (Siggel, 20068; Grant, 20119). On a mesoeconomic scale (sectors or regions), the
idea of competitiveness and its measurement has gained more traction. Michael Porter, an economist at Harvard, is one of the
leading voices on the subject.
Porter (1985)10 based his ideas on the fact that hypotheses on comparative advantage provided incomplete explanations of
trade flow due to economy of scale, unequal competition in several sectors and increasingly differentiated goods, all of which
are factors related to demand. Furthermore, due to globalization, businesses do not rely solely on production factor
endowments from a single country. Porter’s approach has been lauded as a perfect synthesis of various international trade
theories and an innovative representation of competitive advantages in international trade (Grant, 2011)11.
5 Mani, A. & J. Hwang, J. 2004. Income Distribution, Learning-by-Doing and Comparative Advantage. Review of Development Economics
8: 452-473.
6 Siggel,
E. 2006. International competitiveness and comparative advantage: a survey and a proposal for measurement. Journal of Industrial
Competition and Trade 6: 137-159.
7 Larue, B. & J. P. Gervais. 2008. The Assessment of the Concept of Revealed Comparative Advantage and its Applicability in the
Allocation of Egg Overbase Production. Report prepared for the National Farm Products Council. Ottawa.
8 Siggel,
E. 2006. International competitiveness and comparative advantage: a survey and a proposal for measurement. Journal of Industrial
Competition and Trade 6: 137-159.
9 Grant,
R.M. 2011. National economic development and The Competitive Advantage of Nations. In Competition, Competitive
Advantage and Clusters. Edited by R. Huggins and H. Izuski. Oxford University Press.
10 Porter, M.E. 1985. Competitive advantage: creating and sustaining superior performance. New York, NY: Free Press.
11 Grant,
R.M. 2011. National economic development and The Competitive Advantage of Nations. In Competition, Competitive
Advantage and Clusters. Edited by R. Huggins and H. Izuski. Oxford University Press.
Better understand – Devise – Implement
Forest Lavoie Conseil 6Impact Study on a Minimum Wage Increase in the Agricultural Sector
Final Report
Porter (1990)12 suggests a “National Diamond” diagram for analyzing the competitive advantages of a country or region. Porter
explains that each country has four primary pillars that describe the business environment in which it operates. These pillars
are: (i) factor endowment; (ii) demand conditions (consumer preferences); (iii) related and supporting industries; and (iv)
strategy, structure and rivalry. Porter argues that companies are more likely to succeed in industry sectors where the diamond
is the strongest. This diamond is a system whose elements reinforce each other. Therefore, when analyzing competitiveness,
a sector must account for all of these elements. For this analysis, productivity determinants had to be identified, as productivity
has been identified as the final measurement of competitiveness. The pillars of productivity can be sorted into three groups: (i)
basic requirements; (ii) efficiency enhancers; and (iii) innovation and sophistication factors.
On a business scale, Porter (1985)13 developed a method of analyzing competitive advantage determinants that accounts for
value chains as a whole. Among others, the author has identified three main sources of competitive advantage: (i) cost
leadership, which creates lower prices; (ii) product differentiation; and (iii) focus, or technological advantages
coming from innovation. Cost or technological leadership leads to a lower-cost end product that generates profits similar to
that of competitors (Huggins and Izuski, 2011).14 Even if the differentiation strategy is initially costly, it can be managed
through cost leadership and technological innovation (Porter, 1985: pp. 17–18).15
Finally, note that macroeconomic factors can affect price advantage. In Canada, currency fluctuations can reinforce or
undermine price advantages on international markets. For example, a higher Canadian dollar can hinder competitiveness of
Canadian sectors.
2.2.3 Business localization/offshoring
Competitiveness factors throughout the sector will influence production localization and offshoring. For example, a processing
industry will determine its location by assessing not only the cost of its primary factor input and workforce, but also the cost of
transporting that factor input to its processing unit, plus the cost associated with accessing the end market. Therefore, market
proximity is a significant factor (Disdier and Mayer, 2004).16 Byrkett et al. (1976)17 provide an example of all of the factors that
go into determining the location of a slaughterhouse. Agglomeration effects, which allow one or more sectors to reduce costs,
may also be a factor (Jones, 2017;18 Prager, 201519). These effects can improve the overall competitiveness of a sector and
encourage businesses to remain in their own countries.
12 Porter, M.E. 1990. The Competitive Advantage of Nations. New York Press.
13 Porter, M.E. 1985. Competitive advantage: creating and sustaining superior performance. New York, NY: Free Press.
14 Huggins, R. & H. Izuski. 2011. Competition, Competitive Advantage and Clusters: The ideas of Michael Porter. In Competition,
Competitive Advantage and Clusters. Edited by R. Huggins and H. Izuski. Oxford University Press.
15 Porter, M. E. 1985. Competitive advantage: creating and sustaining superior performance. New York, NY: Free Press.
16 Disdier, A. C., & T. Mayer, T. 2004. How different is Eastern Europe? Structure and determinants of location choices by French firms in
Eastern and Western Europe. Journal of comparative Economics, 32(2), 280-296.
17 Byrkett, D. L., Miller, R. A., & E.P. Taiganides. 1976. Modeling the optimal location of the cattle feeding industry. American Journal of
Agricultural Economics, 58(2), 236-244.
18
Jones, J. 2017. Agglomeration economies and the location of foreign direct investment: A meta‐analysis. Journal of Regional Science.
19 Prager, J. C. 2015. La dynamique économique des territoires. Revue de l’OFCE, (7), 13-74.
Better understand – Devise – Implement
Forest Lavoie Conseil 7Impact Study on a Minimum Wage Increase in the Agricultural Sector
Final Report
However, several studies emphasize that competitiveness is not the only factor considered when choosing whether to
outsource a business. Other factors include institutional stability (Disdier and Mayer, 2004)20 and the overall stability of the
productive fabric (Jones, 2017).21 This is the case, for example, in the supply management system. Finally, note that
“neighbourhood” conditions can also affect a business’ location decision (Weterings, 2015).22 This is a key factor for
agricultural businesses operating in short channels.
Section summary
The economic theories and studies about comparative advantages, industry competitiveness and business and
employment localization/offshoring.
The economic theories studied here highlighted the fact that sectoral competitiveness is complex and affected by a number
of factors, such as cost leadership, product differentiation, technological advantages and various macroeconomic factors that
influence prices.
This competitiveness then affects business localization/offshoring. Institutional and economic stability are also important
factors.
20 Disdier,
A. C., & T. Mayer. 2004. How different is Eastern Europe? Structure and determinants of location choices by French firms in
Eastern and Western Europe. Journal of comparative Economics, 32(2), 280-296.
21 Jones, J. 2017. Agglomeration economies and the location of foreign direct investment: A meta‐analysis. Journal of Regional Science.
22 Weterings, A. 2014. What makes firms leave the neighbourhood?. Urban Studies, 51(8), 1613-1633.
Better understand – Devise – Implement
Forest Lavoie Conseil 8Impact Study on a Minimum Wage Increase in the Agricultural Sector
Final Report
2.3 Price transmission factors in agri-food sectors
This section documents the factors that influence price transmission to the market and between the links in each sector’s
supply chain. This information will help to determine which factors are present in each sector during impact analyses for the
nine agricultural production sectors being studied. It will also determine how a price increase (such as one driven by a
minimum wage increase) will be transmitted to other links in the chain or passed on to the consumer.
Vertical price transmission influences wealth sharing within a sector. When it is coordinated and efficient, this price
transmission leads to a certain symmetry in price movements. Otherwise, the prices received by actors within the sector may
not reflect the costs and risks they themselves generate. This leads to asymmetrical price transmission. There are two types
of asymmetry. The first involves an unequal amount of price transmission, wherein a price change is not entirely passed on to
the next link in the supply chain. In this case, a $1 price increase would translate to a less than $1 price increase for the next
link in the chain. Second, there is asymmetry in the speed of transmission, that is, a price change in one link does not reach
the next link right away.
In general, the literature suggests that five factors influence price transmission (Gervais and Lambert, 2008).23 The first factor
is consumer influence. For example, consumers are increasingly concerned about the origin and quality of their products.
Therefore, businesses “downstream” from a sector will incur certain costs (e.g. certification, identification of origin) in
response. These additional costs may be transmitted to providers or consumers, depending on the situation. For example,
since producers’ short-term supply is often relatively fixed, additional costs due to changes in consumer trends can easily be
passed along to them. In that case, they may offer a lower price for their products. Additionally, the intensity of consumers’
reaction to a price change will determine whether the cost of a trend-related change will be transmitted to the consumer. For
instance, the demand for a highly differentiated product is usually consistent, so the industry can more easily transmit price
increases caused by changing trends.
The second factor is competition between links in the chain (Lambert et al., 2004).24 Strong concentration in one link within
the sector can give it a certain amount of market power. This can either help it to prevent other links from transmitting their
price increases or allow it to more easily transfer any of its own increases (for example, from salary raises) to other links.
Coordination and marketing mechanisms for agricultural products are the third factor in price transmission. For instance,
individual contracts and collective marketing can help coordinate relationships between different links in the supply chain.
These mechanisms determine each link’s ability to transfer price increases and which link will assume the most risk. Collective
marketing allows for good vertical coordination among producers, increasing their ability to transmit price increases to other
links in the chain. Moreover, several recent studies have found that inventory levels play a role in price transmission symmetry
(Abassi et al., 2012).25 When one link has a larger stock of product, other links are not able to transmit price changes to that
link as quickly. Inventory therefore acts as a sort of buffer, allowing that link to continue providing product even when
production costs are high. The actors responsible for managing stock therefore influence the way prices are transmitted to
other links in the supply chain.
23 Gervais, J-P. & Lambert, R. 2008. La transmission des prix dans les filières agroalimentaires. Bioclips volume 11, no. 1.
24 Lambert,
R., Criner, G. & Rancourt, Y. 2004. Concentration, prix et pouvoir de marché dans l’industrie alimentaire canadienne.
CRÉA Research Series, SR.04.09.
Better understand – Devise – Implement
Forest Lavoie Conseil 9Impact Study on a Minimum Wage Increase in the Agricultural Sector
Final Report
Fourth, external factors play a role in price transmission. For instance, the cost structure of retail businesses can affect price
transmission, because these businesses eventually transmit price increases to certain links. For example, retailers cannot
transmit an increase in labour costs to an energy-based link. It may be easier for them to transmit that cost to consumers if
demand is inelastic or to their agricultural product provider if they have some amount of market power. However, there can be
costs associated with adjusting the retail price of agricultural products. This is true for retailers. In the short term, at least, it is
not profitable for retailers to transmit price changes (Azzam, 1999).26
Finally, border openness affects market prices, and therefore the ability to transmit prices. Consider, for example, what would
happen if borders were to close completely. A price increase on an entirely inelastic demand would lead to little or no
decrease in consumption. Therefore, price increases could be transmitted fully. On the other hand, if borders were entirely
open, global prices would prevail. It would be impossible to increase prices on the local market following an increase in costs.
Furthermore, fully open borders would mean that locally produced agricultural goods could be easily replaced with imported
goods.
The inset below shows the impact of a $15/h minimum wage on retail prices in Seattle, USA. Note that the impact on retail
prices would vary depending on the sector.
Inset 1: Impact of a $15/h minimum wage on retail prices in Seattle, USA.
According to a recent University of Washington study (2016),27 one year after the minimum wage was increased to $15/h in Seattle, retail
prices had not increased in most businesses. This was particularly true in pharmacies and grocery stores, where most employees were
paid near minimum wage, yet retail prices did not rise. In these sectors, strong competition between businesses was identified as a
significant mitigating factor, as businesses were unable to increase retail prices significantly to compensate for increased labour costs.
This may not be the case for less competitive markets, which could more easily offset the costs of an increased minimum wage by
increasing retail prices (Nilsson and MacDonald, 2016)28.
For example, the food service industry in Seattle did experience price increases of 7–9% in one year. The study also lists some of the
strategies used by that industry to reduce the impact of increased labour costs, such as closing businesses during low-traffic hours.
It shows that some industries were more easily able to absorb cost increases or transmit those increases to the market. Additionally, the
level of competition between food retail businesses seem to reduce the ability to transmit cost increases to consumers, therefore reducing
agricultural producers’ ability to transmit their own costs to retailers.
Finally, note that as Basker and Khan (2016)29 have indicated, different studies have drawn different conclusions about the effects of a
minimum wage increase on retail prices.
25 Abbassi,A., Tamini, L.D. & Gervais, J-P. 2012. Do Inventories Have an Impact on Price Transmission? Evidence from the Canadian
Chicken Industry. Agribusiness, 28: 173-186.
26 Azzam, A. M. 1999. Asymmetry and rigidity in farm-retail price transmission. American Journal of Agricultural Economics, 81(3), 525-533.
27
https://www.fastcompany.com/3059118/after-a-year-seattles-new-minimum-wage-hasnt-raised-retail-prices
28 Nilsson, E., & D. MacDonald. (2016). New Findings Regarding the Effect of the Minimum Wage on Prices.
29 Basker, E. & M.T. Khan. 2016. Does the Minimum Wage Bite into Fast-Food Prices?. Journal of Labor Research, 37(2), 129-148.
Better understand – Devise – Implement
Forest Lavoie Conseil 10Impact Study on a Minimum Wage Increase in the Agricultural Sector
Final Report
Section summary
Price increase transmission throughout a sector — how and where price increases are transmitted — depends
on the sector’s structure and composition and the openness of its interprovincial and/or international markets.
This section identifies the various price transmission factors within a sector: consumer influence, competition between links
and degree of concentration, coordination and marketing mechanisms for agricultural products, external factors such as retail
cost structure, and openness of borders (substitution by imports).
In the food retail industry specifically, the ability to transmit price increases to consumers is limited. Depending on the sector’s
characteristics, price increases may therefore be transmitted between links in the supply chain or to the consumer.
Better understand – Devise – Implement
Forest Lavoie Conseil 11Impact Study on a Minimum Wage Increase in the Agricultural Sector
Final Report
2.4 Agri-food sector characteristics: competitiveness and price transmission factors
Using the theories described in sections 2 and 3, we will now take a closer look at the competitiveness and price transmission
characteristics of the sectors that are the focus of this study. By analyzing competitiveness and price transmission, the sector
analyses (sector data sheets) generate a clearer picture of the impacts of a minimum wage increase, which can be affected by
market openness or the structure of the segments within each sector.
We have grouped the sectors into four groups based on their shared characteristics:
• Dairy, chicken, turkey and eggs, which are under supply management and have relatively little
international/interprovincial trade
• Strawberries/raspberries, fresh apples and vegetables, which have relatively large interprovincial/international trade
• Pork and processing fruits and vegetables, which are sectors whose products will be processed, so the relationship
between producers and processors plays a major role
• Maple syrup, which is under provincial supply management but relies heavily on international trade
For each of these major groups, we will describe:
• General production characteristics;
• Supply;
• Sector organization;
• Consumer demand characteristics;
• Competitiveness characteristics.
2.4.1 Products under supply management: dairy, chicken, turkey and eggs
2.4.1.1 General characteristics of production under supply management
Production under supply management is characterized by import control at the borders in the form of tariffs. Supply
management policies were established with the intent of guaranteeing Canadian consumers regular supply at competitive
prices while allowing producers to cover their production costs. In order for this policy to effectively stabilize producer revenue
and bring balance to the market, it relies on three pillars: (i) production discipline (national production quota), which is
determined by Canadian consumer demand and to which each province contributes; (ii) setting minimum producer prices
according to production costs; and (iii) import control through border tariffs.
2.4.1.2 Supply
Most of the supply in the dairy, chicken, turkey and table and hatching egg sectors is domestic. An additional 5–25%
(depending on the sector) of Canadian consumption is fulfilled by imports. Canadian producers are able to meet 80–95% of
domestic consumer consumption. Even though imports make up a relatively small part of the Canadian market, they show that
the domestic market is not fully insulated from fluctuations in international markets.30 However, the ability to substitute local
produce with imports is limited due to import control mechanisms. Demand for supplementary imports can be justified only in
the event of a supply deficit on the domestic market.31
30 Tamini
L.D., J-F. Forest & M. Hernandez 2007. Études des facteurs du marché canadien du poulet. Final report prepared by
ÉcoRessources Consultants for Chicken Farmers of Canada.
31 http://www.international.gc.ca/controls-controles/report-rapports/index.aspx?lang=eng
Better understand – Devise – Implement
Forest Lavoie Conseil 12Impact Study on a Minimum Wage Increase in the Agricultural Sector
Final Report
Little data are available on interprovincial trade in sectors under supply management. However, the data that are available
indicates that interprovincial trade does exist. For example, Quebec produced nearly 310 million kilograms of chicken in 2016.
Approximately 5% of this was imported from other provinces, while approximately 8% was exported.32
In the short term, a minimum wage increase should not affect this general production profile, as processing facilities in Quebec
supply the majority of processed product. However, a minimum wage increase could affect the provinces’ production quotas in
the medium term due to (i) a decrease in Quebec’s competitiveness and (ii) a potential decrease in demand due to higher
retail prices.
2.4.1.3 Sector organization
Vertical integration is not predominant in sectors under supply management.33 Instead, these sectors are characterized by
highly concentrated intermediary links in the supply chain, such as graders and processors for table eggs and
slaughterhouses for poultry. In these sectors, the two primary agents have over 75% of the market share.34 In 2015–16, three
factories were responsible for processing just over 77% of fluid milk while nine factories were responsible for processing
nearly 78% of industrial milk.35 This strong concentration of intermediary links could theoretically affect the way that sudden
price changes by producers are transmitted along the supply chain. Gervais and Devadoss (2006)36 show that the highly
concentrated nature of this link gives it some negotiating power. For poultry37, 38 and dairy, studies have shown that retail
prices were not being fully transmitted to intermediaries. In other words, the retail portion of the chain should not be able to
transmit its price increases to intermediaries (e.g. graders, processors, slaughterhouses). Instead, it must absorb the cost or
transmit it to consumers by increasing retail prices. In the latter case, the final impact of a minimum wage increase on retail
prices will at least partially reflect the effects of this increase on the links in the supply chain (Chavas and Kim, 2005).39 In the
end, a production cost increase will be partially or completely transmitted to the intermediary links. In turn, these links will
transmit some or all of that increase to the retail sector, depending on their market power.
32 http://www.agr.gc.ca/eng/industry-markets-and-trade/statistics-and-market-information/?id=1361289956531
33 Royer, A., & F. Vézina. 2012. Intégration verticale et contractualisation en agriculture : État de la situation au Québec. Taken from
http://personnel.fsaa.ulaval.ca/fileadmin/fichiers/fichiersPersonnel/AnnieRoyer/Rapport_final_-_Integration.pdf
34 Three grading facilities, belonging to two companies, grade the majority of Quebec’s eggs. Nutri-Oeuf Inc. and Oeufs Ovale SEC both
belong to Nutrigroupe and grade 70% of Quebec’s eggs. Ferme St-Zotique Ltd., which is owned by Burnbrae Farms, grades
approximately 25% of the province’s eggs (MAPAQ 2014).
35 http://www.groupeageco.ca/fsl/
36 Gervais,
J. P., & S. Devadoss. 2006. Estimating bargaining strengths of Canadian chicken producers and processors using a bilateral
monopoly framework. Agribusiness, 22(2), 159-173.
37 Tamini L.D., J-F. Forest & M. Hernandez. 2007. Études des facteurs du marché canadien du poulet. Final report prepared by
ÉcoRessources Consultants for Chicken Farmers of Canada.
38 Gervais, J. P., & S. Devadoss. 2006. Estimating bargaining strengths of Canadian chicken producers and processors using a bilateral
monopoly framework. Agribusiness, 22(2), 159-173.
39 Chavas, J. P., & K. Kim. 2005. An econometric analysis of price dynamics in the presence of a price floor: the case of American cheese.
Journal of Agricultural and Applied Economics, 37(01), 21-35.
Better understand – Devise – Implement
Forest Lavoie Conseil 13Impact Study on a Minimum Wage Increase in the Agricultural Sector
Final Report
The table egg sector is well equipped to transmit increased costs, such as those caused by a minimum wage increase, as
long as producer prices are equal to production costs. Price transmission is weak to moderate in the dairy sector, where
prices are determined partly by national production costs and partly by global prices. Finally, price transmission is very weak
in poultry and hatching eggs, because prices are the same as they are in Ontario.
2.4.1.4 Consumer demand characteristics
In Canada, the demand for products under supply management is largely inelastic.40 This price elasticity is -0.81 for poultry
and -0.35 for table eggs (Pomboza and Mbaga, 2007).41 Overall, for products under supply management, consumer
preference should not discourage price transmission, especially since chicken’s cross-price elasticity with other meats is very
weak. This is also the case for eggs’ cross-price elasticity with other sources of protein (Pomboza and Mbaga, 2007). 42
Recent studies of the Canadian market have found that demand is equally inelastic in the dairy sector. In the whole milk
sector, Ntetami (2012) found that elasticity was -0.81 for whole milk, -0.97 for yogurt, -0.66 for ice cream and -0.41 for cottage
cheese. According to Rude and An (2013), elasticity is -0.23 for cottage cheese, -0.4 for butter, -0.62 for ice cream and -0.81
for yogurt.43 Other drinks (orange juice, coffee, tea, soda, etc.) can be substitutes for milk. However, the cross-price elasticity
between dairy products and these other drinks is very weak (Ntetami, 2012). Therefore, a price increase in milk following an
increase in labour costs should not lead to these products being substituted for milk more frequently.
As far as we know, there are no data on the elasticity of specialty cheeses. That said, these products are highly differentiated
but have close substitutes. We believe that demand is elastic for different types of cheeses, with cross-price elasticity being
equally significant, as consumers can easily substitute one type of specialty cheese for another.44
40 Demand is considered inelastic when a 1% price increase translates to a less than 1% decrease in consumption. Demand is
considered elastic when a 1% price increase translates to a greater than 1% decrease in consumption.
41 Pomboza, R. & M. Mbaga. 2007. The Estimation of Food Demand Elasticities in Canada. AAFC.
42 Pomboza, R. & M. Mbaga. 2007. The Estimation of Food Demand Elasticities in Canada. AAFC.
43 These data are also available on the FAPRI website (http://www.fapri.iastate.edu/tools/elasticity.aspx )
44 van Tongeren, F., Disdier, A. C., Ilicic-Komorowska, J., Marette, S., & M. von Lampe. 2010. Case Studies of Costs and Benefits of Non-
Tariff Measures: Cheese, Shrimp and Flowers (No. 28). OECD Publishing.
Better understand – Devise – Implement
Forest Lavoie Conseil 14Impact Study on a Minimum Wage Increase in the Agricultural Sector
Final Report
2.4.1.5 Competitiveness characteristics
Sectors under supply management barely have to deal with international competitiveness, as they mostly serve the domestic
market. However, one of the pillars of supply management is setting prices based on production costs. Note that producer
price increases are not necessarily automatic for all sectors under supply management. For example, prices for milk are set
according to national production costs, as well as international prices for some classes of milk. Therefore, if production costs
were to increase in Quebec but not other provinces, the price increase for Quebec producers would have a relatively small net
effect. Cost calculations account for global prices, the consumer price index and Quebec’s share of production in Canada. For
poultry, the price in Quebec is equal to the price in Ontario. The price in the latter is set according to its production costs.
Therefore, if there is no change in Ontario, the price in Quebec will not be affected by an increase in production costs. Finally,
for table eggs, the price is based on production costs in Quebec. In this scenario, a labour-related cost increase in Quebec
would be reflected by an increase in producer prices. Note that if Ontario were to raise its minimum wage, it would partially (for
dairy) or totally (for poultry) change producer prices to reflect labour-related cost increases.
If the producer price is higher than the international producer price, it is worth reconsidering the effectiveness of the border
protection system. An increase in production costs in sectors under supply management could theoretically render border
tariffs (one of the pillars of the supply management system) less effective. However, our research found that most of the time,
tariffs are high enough to ensure that a cost increase translates to weaker border protection (Rafajlovic and Cardwell, 2013;
Rude and An, 2013; Rude and Gervais, 2006).45, 46, 47
Overall, an increase in producer price should not translate to greater pressure on products under supply management, seeing
as consumption is minimally sensitive to price. However, dairy processing (cheese and butter) sectors may be more
vulnerable.48, 49 For these processed products, increased production costs could lead to a decrease in local supply, to the
detriment of imports. Note also the issues related to the importation of dairy products such as diafiltered milk, which are not
subject to supply management. These products are used in the processing industry and may reduce the sector’s ability to
transmit price increases due to the substitution effect.
As previously indicated, these sectors, except for the dairy sector, are also characterized by interprovincial trade. All else
being equal, if Quebec’s sectors were to experience decreased competitiveness, other provinces’ relative share of production
quotas could decrease in the medium term. In the short term, however, the system is fairly inflexible.
45 Rafajlovic,
J., & R. Cardwell. 2013. The effects of a new WTO agreement on Canada’s chicken market: A differentiated products
modeling approach. Canadian Journal of Agricultural Economics/Revue canadienne d’agroéconomie, 61(4), 487-507.
46 Rude, J. & J.P. Gervais. 2006. Tariff-Rate Quota Liberalization: The case of World Price Uncertainty and Supply Management. Canadian
Journal of Agricultural Economics 54: 33-54.
47 Rude,J. & H. An. 2013. Trans-Pacific Partnership: Implications for the Canadian industrial dairy sector. Canadian Public Policy, 39(3),
393-410.
48 On, J. 2015. Trade Liberalization and its Impacts on the Canadian Industrial Dairy Sector (Master’s dissertation, University of Guelph).
49 Rasmussen, P. 2016. The Impact of Trade Policy in Canadian Dairy (Master’s dissertation, University of Calgary).
Better understand – Devise – Implement
Forest Lavoie Conseil 15Impact Study on a Minimum Wage Increase in the Agricultural Sector
Final Report
2.4.2 Strawberries/raspberries, fresh apples and fresh vegetables
2.4.2.1 General horticultural production characteristics
These producers work in an open environment where imports put constant pressure on price and production levels in Quebec.
Furthermore, these products are generally destined for the fresh market. Some products (such as carrots, onions and lettuce)
are also exported.
2.4.2.2 Supply
In terms of strawberry/raspberry, apple and fresh vegetable production, data on Canadian imports and exports show that
foreign markets dominate the supply of these products in Canada. Imported products are therefore available to replace local
production in these markets. The importance of imports in the supply of strawberries/raspberries, apples and fresh vegetables
means that some shocks (increased or decreased prices and costs) may be transmitted to the domestic market. Conversely,
changes to costs or prices in Quebec would not really be transmitted to the markets from which the imports are coming, given
Quebec’s relatively small share of these markets (Carew et al., 2012).50
For Quebec fruit and vegetable distributors, the ability to substitute their supply with imports, at least in the medium term,
means that the production sector may be unable to transmit its price increases to other links in the supply chain.
Finally, in horticultural sectors, the balance between supply and demand dictates market conditions. As indicated above,
supply is determined by the size of local production each year and each month within a year, as well as by imports. This
balance between supply and demand determines prices, as the quantities produced are relatively stable in the short term. For
this reason, producers cannot transmit production cost increases. However, economic theory states that a (marginal) increase
in production costs following a minimum wage raise will lead to a reduction in local supply if the projected price is equal. This
may play out over the medium or long term.
2.4.2.3 Sector organization
Royer and Vézina (2012)51 state that approximately 70% of domestic vegetable production in Quebec is marketed through
long channels (wholesalers, major chains), while the rest is marketed through greengrocers, small retailers and short
marketing channels (farmer’s markets, farm kiosks).52 Many studies have found that accessing major chains can be difficult,
as they prefer to do business with a smaller number of suppliers. Royer and Vézina (2012)53 also highlight that major chains
tend to obtain their supply from a limited number of producers and distributors that are CanadaGAP certified and that also act
as packagers. This organizational structure of vegetable sectors leads us to believe that wholesalers and retailers have
significant market power, reducing producers’ ability to fully transmit price changes.
50 Carew, R., Florkowski, W. J., & A. Doroudian. 2012. Market integration and relationship between farm-level prices: evidence from cherry
market in BC, Washington and California. Journal of International Agricultural Trade and Development, 8(1), 43.
51 Royer, A., & F. Vézina. 2012. Intégration verticale et contractualisation en agriculture : État de la situation au Québec. Taken from
http://personnel.fsaa.ulaval.ca/fileadmin/fichiers/fichiersPersonnel/AnnieRoyer/Rapport_final_-_Integration.pdf
52 Mundler, P., & S. Laughrea. 2016. The contributions of short food supply chains to territorial development: A study of three Quebec
territories. Journal of Rural Studies, 45, 218-229.
53 Royer, A., & F. Vézina. 2012. Intégration verticale et contractualisation en agriculture : État de la situation au Québec. Taken from
http://personnel.fsaa.ulaval.ca/fileadmin/fichiers/fichiersPersonnel/AnnieRoyer/Rapport_final_-_Integration.pdf
Better understand – Devise – Implement
Forest Lavoie Conseil 16Impact Study on a Minimum Wage Increase in the Agricultural Sector
Final Report
According to the MAPAQ (2015),54 between 2009 and 2013 nearly half of apple production was put on the fresh market, but
only a small portion of that was from direct sales. In Quebec, apples are marketed through a joint plan administered by the
Fédération des producteurs de pommes du Québec (MAPAQ, 2011).55 According to the Règlement sur la mise en marché des
pommes du Québec [Quebec marketing regulation for apples], producers may only sell their apples directly to consumers or to
an authorized agent. Quebec apples must meet the “Pommes Qualité Québec” standard. Producer prices are the result of
negotiations between producers and packagers through a “price committee.” Production costs, supply and demand all factor in
to pricing for each variety of apple. Apple producers can therefore theoretically transfer part of a production cost increase.
However, the significant presence of imports in total consumption, lower production costs in competing markets (British
Columbia and the state of Washington) and the limited number of packagers definitely hinder the sector’s ability to fully (or
even partially) transmit price increases. One implication of a minimum wage increase could be a return of compensation from
the ASRA program. However, this is unlikely due to the partnership between the ASRA program and AgriStability, which
covers certain business losses.56
In some aspects, strawberries and raspberries are marketed in the same way as vegetables. To improve promotion, product
availability and coordination within the sector, a coordination chamber was established in 2004. However, the coordination
chamber is not involved in the price negotiation process.
2.4.2.4 Consumer demand characteristics
In Canada, the demand for horticultural products is considered inelastic: -0.84 for fruits and -0.65 for vegetables (Pomboza
and Mbaga, 2007). Lundy (2014) also found similar results.57 For these products, consumer preferences should not
discourage price transmission in theory, especially since consumers can choose whether or not to pay for the “Produit du
Québec” or “Aliments du Québec” labels, as proven by Rodier (2010).58 Rodier also showed that foods labelled “Aliments du
Québec” have a 2.8% bigger market share. However, it is important to note that in addition to substituting local products with
imported ones, consumers are just as likely to replace fresh Quebec products with frozen ones.
54 Ministère de l’Agriculture, des Pêcheries et de l’Alimentation. 2015. Monographie de l’industrie de la pomme au Québec.
55 MAPAQ. 2011. Monographie de l’industrie de la pomme au Québec. https://www.agrireseau.net/marketing-
agroalimentaire/documents/pommemonographie.pdf
56 http://www.fadq.qc.ca/statistiques/assurance-recolte/statistiques-annuelles/
57 Lundy, A. 2014. The Canadian Demand for Healthy and Unhealthy Food: A Comparison of Food Elasticity Estimates Using Several
Different Functional Forms. Master’s research paper, McGill University.
58 Rodier,
F. 2010. «Mesure de l’impact de la marque de provenance Aliments du Québec sur la valeur du produit». Doctoral thesis,
Sherbrooke University, Quebec.
Better understand – Devise – Implement
Forest Lavoie Conseil 17You can also read