IMPLEMENTATION REPORT - 2017 NORTHWEST PORTS CLEAN AIR STRATEGY
←
→
Page content transcription
If your browser does not render page correctly, please read the page content below
NORTHWEST PORTS
CLEAN AIR STRATEGY

IMPLEMENTATION
REPORT
2017
Northwest Ports Clean Air Strategy: 2017 Implementation Report

Executive Summary
In 2013, the Port of Seattle (POS), Port of Tacoma (POT), and Port of Vancouver collaborated to create
an updated Northwest Ports Clean Air Strategy (Strategy) with three objectives: reducing port-related
air quality impacts of diesel particulate matter (DPM), reducing greenhouse gas (GHG) emissions, and
helping meet air quality standards and objectives for the airshed. The Strategy is being implemented in
partnership with several agencies, including the U.S. Environmental Protection Agency, the
Washington State Department of Ecology (Ecology), the Puget Sound Clean Air Agency, Environment
Canada, BC Ministry of Environment and Climate Change Strategy, and Metro Vancouver (strategy
partners). This 2017 Implementation Report summarizes the progress made toward the goals and
performance targets identified in the 2013 updated Strategy, building on the progress outlined in the
2014, 2015 and 2016 reports. This report also highlights key demonstration projects and pilot studies
undertaken by the Ports and Strategy partners in 2017 that support the Strategy goals, and provides a
summary of initiatives underway in 2018.

In August 2015, POS and POT formed The Northwest Seaport Alliance (NWSA) to jointly manage their
marine cargo facilities and business. Going forward, NWSA will participate as a port partner in
implementing the Strategy. For this report, the NWSA, and the ports of Seattle, Tacoma and Vancouver
will be collectively referred to as “the Ports”.

Progress Toward Strategy Goals
The Ports conduct air emission inventories every five years, and these are used to track progress on
the two strategy goals. Based on the 2015/2016 inventories, the ports collectively met the 2020 DPM
and the 2020 GHG goals by the end of 2016.

Goal 1: Reduce DPM emissions per metric ton of cargo by 80% by 2020, relative to 2005

  à DPM emissions per metric ton of cargo were reduced by 80% between 2005 and 2015/2016.

Goal 2: Reduce GHG emissions per metric ton of cargo by 15% by 2020, relative to 2005

  à GHG emissions per metric ton of cargo were reduced by 17% between 2005 and 2015/2016.

Performance Target Status for 2017
Performance targets are organized into six sectors: ocean-going vessels (OGV), harbor vessels, cargo-
handling equipment (CHE), trucks, locomotives and rail transport, and port administration. Table E-1
summarizes the progress toward the 2020 (and 2017 for drayage trucks) performance targets. Further
details about this progress are included in the report.

January 2019                                                                                       i
Northwest Ports Clean Air Strategy: 2017 Implementation Report

Demonstration Projects and Pilot Studies in 2017
The Ports and their partners undertook pilot studies and demonstration projects in 2017. This report
highlights three studies or projects undertaken at the ports in 2017, as follows:

     •     Port of Vancouver: Terminal Tractor Active Start Stop Installation

     •     Port of Seattle: Solar Energy Installation

     •     NWSA and Port of Tacoma: Shore Power Analysis

Key Initiatives for 2018
The Ports have numerous initiatives planned and/or underway for 2018, including creating port-wide
greenhouse gas reduction strategies; installing new shore power terminals, solar arrays and electric
vehicle charging stations; creating new staff positions to focus further efforts on air quality and climate
action initiatives; and many others outlined in Section 10.

Starting in 2018, the Ports and strategy partners are undertaking a review and update of this Strategy
with the intention to publish an updated Strategy in 2019 that builds on the strong collaboration
established among the participants over the last decade. The goal of the strategy update is to continue
to promote emission reductions of both DPM and GHGs and to encourage sustainable port operations.

January 2019                                                                                          ii
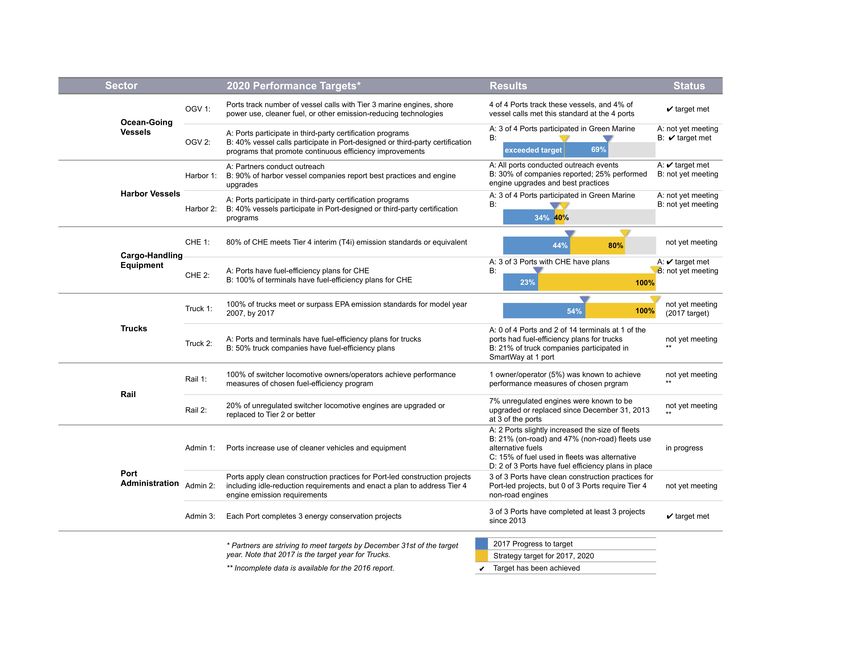
Northwest Ports Clean Air Strategy: 2017 Implementation Report

Table E-1. Status of 2017 and 2020 Performance Targets for 2017

   October 2018                                                     iii
Northwest Ports Clean Air Strategy: 2017 Implementation Report

Table of Contents
                       Executive Summary ................................................................................................. i

                       Table of Contents .................................................................................................. iv

                       List of Acronyms ..................................................................................................... v

                       1. Introduction ...................................................................................................... 1

                       2. Clean Air Strategy Goals .................................................................................. 4

                       3. Ocean-Going Vessels ....................................................................................... 6

                       4. Harbor Vessels ............................................................................................... 12

                       5. Cargo-Handling Equipment ............................................................................. 16

                       6. Trucks ............................................................................................................ 22

                       7. Locomotives and Rail Transport...................................................................... 27

                       8. Port Administration ......................................................................................... 31

                       9. Pilot Studies and Demonstration Projects........................................................ 38

                       10. Port Initiatives & Pilots for 2018 ...................................................................... 40

                       Acknowledgements ............................................................................................... 43

January 2019                                                                                                                             iv
Northwest Ports Clean Air Strategy: 2017 Implementation Report

List of Acronyms
AESS                              Automatic engine stop start

CHE                               Cargo-handling equipment

CNG                               Compressed natural gas

DERA                              EPA Diesel Emission Reduction Act

DPM                               Diesel particulate matter

ECA                               Emission control area

Ecology                           Washington State Department of Ecology

EPA                               U.S. Environmental Protection Agency

ESI                               Environmental Shipping Index

FRATIS                            Port of Tacoma Freight Advanced Traveler Information Systems

GHG                               Greenhouse gas

HC                                Hydrocarbon

IMO                               International Marine Organization

LNG                               Liquefied natural gas

NOx                               Nitrogen oxides

NRDE                              Port of Vancouver Non-Road Diesel Emissions program

NWSA                              The Northwest Seaport Alliance

OGV                               Ocean-going vessel

PM                                Particulate matter

POS                               Port of Seattle

POT                               Port of Tacoma

PSCAA                             Puget Sound Clean Air Agency

RNG                               Renewable Natural Gas

RTG                               Rubber-tired gantry crane

ScRAPS                            NWSA Seaport Scrappage and Replacements for Air in Puget Sound

TLS                               Port of Vancouver Truck Licensing System

ULSD                              Ultra-low-sulfur diesel

VFPA                              Vancouver Fraser Port Authority

January 2019                                                                                       v
Northwest Ports Clean Air Strategy: 2017 Implementation Report

1. Introduction
The Northwest Ports Clean Air Strategy (Strategy) is a collaboration, established by the ports of
Seattle (POS), Tacoma (POT) and Vancouver, with the aim of reducing air emissions from maritime
and port-related activities that affect air quality and contribute to climate change. The formation of
The Northwest Seaport Alliance (NWSA) in 2015 added a fourth port partner to the Strategy.

Several government agencies work in partnership with the Ports to support implementation of the
Strategy, including the U.S. Environmental Protection Agency (EPA), the Washington State
Department of Ecology (Ecology), the Puget Sound Clean Air Agency (Clean Air Agency),
Environment Canada, BC Ministry of Environment and Climate Change Strategy, and Metro
Vancouver (strategy partners).

The Strategy, originally developed in 2007, was updated in 2013 based on new data and on lessons
learned from the first six years of implementation, advances in emission-reduction technology, and
changes in the regulatory landscape. The Ports and strategy partners issue annual implementation
reports that summarize progress toward the goals and targets identified in the Strategy. This 2017
Implementation Report is the fourth to report progress against the 2013 Strategy. In 2018 and 2019,
the Ports and Strategy partners will undertake a review and update of the Strategy.

The Strategy is organized by these six sectors:

                  Ocean-going vessels (OGV)                        Trucks

                  Harbor vessels (Harbor)                          Locomotives and rail transport (Rail)

                  Cargo-handling equipment (CHE)                   Port administration (Admin)

Strategy Objectives, Goals and Targets
The updated 2013 Strategy has three primary objectives:

     1. Reduce port-related air quality impacts from diesel particulate matter (DPM) emissions to
           decrease immediate and long-term effects on human health, the economy, and the
           environment in the Georgia Basin-Puget Sound airshed.

     2. Reduce greenhouse gas (GHG) emissions to limit contributions to climate change and
           reduce associated environmental, health, and economic impacts.

     3. Help meet air quality standards and objectives for the Georgia Basin-Puget Sound airshed.

To track progress on these objectives, two airshed-wide goals are included in the Strategy – one for
DPM emissions and one for GHG emissions (see Section 2 for progress towards these goals).

January 2019                                                                                          1
Northwest Ports Clean Air Strategy: 2017 Implementation Report

Several targets were also defined in the Strategy within each of the sectors identified above. The
strategy partners work with stakeholders to meet targets by the end of the stated calendar year–that
is, the achievement date for 2020 targets is December 31, 2020. This report focuses on the progress
made toward the 2020 (and December 31, 2017 for trucks) performance targets. The Ports continue
to work toward achieving both the 2015 and 2020 targets where they have not yet met the 2015
performance targets.

Summary of the Participating Pacific Northwest Ports
In 2017, the ports collectively moved approximately 179 million metric tons of cargo. Each port has a
unique operating context, including the amount of cargo moved annually, the number of terminals
and other operations, and the types of business sectors served (see Table 1 for a summary of these
by port). Despite different operating contexts, the Ports recognize that defining and working toward
common goals can have a greater overall impact on reducing port-related air emissions in the Georgia
Basin-Puget Sound airshed.

Table 1. Summary of terminals, cargo and passengers moved, and business sectors served at
each port

                        Total tonnage of
                                                      Number of     Number of   Types of business sectors
 Port                   cargo moved in
                                                      Passengers    Terminals            served
                       2017 (metric tons)
                                                                                Automobile / Roll-on Roll-off
 Northwest                                                                             Breakbulk
 Seaport                     27,570,924                      n/a       15
 Alliance                                                                                  Bulk
                                                                                       Container
                                                                                         Bulk
                                                                                        Cruise
 Seattle                      4,362,603                 1,071,594       3
                                                                                 Commercial/Recreational
                                                                                       Marinas
 Tacoma                       4,893,609                      n/a        1                   Bulk
                                                                                Automobile / Roll-on Roll-off
                                                                                       Breakbulk
                                                                                           Bulk
 Vancouver                  142,078,359                  842,928       27
                                                                                       Container
                                                                                          Cruise
                                                                                          Other

January 2019                                                                                                    2
Northwest Ports Clean Air Strategy: 2017 Implementation Report

How this Report is Organized
This report is organized according to the following key elements from the 2013 Strategy:

     •     Goals for reducing port-related emissions in the Georgia Basin–Puget Sound airshed that
           focus on DPM and GHGs. (Report Section 2)

     •     Performance targets for 2017 and 2020 for reducing emissions in each of the six sectors.
           (Report Sections 3 to 8)

     •     Port commitments to undertake pilot studies and demonstration projects designed to
           advance emission-reduction technologies that can help meet the emission-reduction goals.
           (Report Section 9)

January 2019                                                                                      3
Northwest Ports Clean Air Strategy: 2017 Implementation Report

        2. Clean Air Strategy Goals
        The actions in the Strategy are intended to complement regulations and, together with the
        regulations, help to achieve the following emission reductions:

        DPM Goal: Reduce diesel particulate matter emissions per metric ton of cargo by 80% by 2020, to
        decrease immediate and long-term health effects on adjacent communities, relative to 2005.

        GHG Goal: Reduce greenhouse gas emissions per metric ton of cargo by 15% by 2020, to limit
        contributions to climate change and reduce associated environmental, health, and economic impacts,
        relative to 2005.

        The Strategy goals focus on reducing the intensity of emissions that result from port activities (i.e.
        reducing the amount of emissions per metric ton of goods that are moved), relative to the baseline
        intensity of emissions in 2005. Tracking emissions intensity provides a mechanism for reporting
        progress even when the ports experience different rates of growth in economic activity.

        2005 Baseline
        In 2005, a total of 137.6 million metric tons of cargo1 were moved through the four ports, and port-
        related activities resulted in the emission of 2,002 metric tons of DPM and 1.67 million metric tons of
        GHG emissions in the airshed.2 The 2005 baseline intensity emissions were:

             •     0.15 metric tons of DPM emissions / 10,000 metric tons of cargo moved.

             •     121 metric tons of GHG emissions / 10,000 metric tons of cargo moved.3

        Progress Toward Goals (2005 to 2015/2016)
        Based on the 2015/16 inventories, a total of 174.8 million metric tons of cargo were moved through
        the four ports, and port-related activities resulted in the emission of 501 metric tons of DPM and 1.75
        million metric tons of GHG emissions.4 As a result, the ports met the DPM and GHG goals for 2020
        by the end of 2016. The average change in emission intensity for 2015/2016 across the four ports
        was (also shown in Figure 1, and by port in

        Table 2):

             •     DPM emissions / 10,000 metric ton of cargo moved: 80% lower in 2015/16, compared to 2005.

1
  2005 cargo volumes were updated for Port of Seattle to reflect the 2016 Puget Sound Air Emissions Inventory report
data. Past POT and NWSA cargo data were incorrectly reported due to unit conversion error.
2
  Emissions are estimated for the "airshed" scale, which includes all emissions related to port activity released in the
airshed (note that boundaries are defined differently in the Port of Vancouver inventory compared to the Puget Sound
inventory). Emissions were obtained from the 2016 Puget Sound Maritime Air Emission Inventory (Starcrest, October
2018) and the Port of Vancouver 2015 Port Emissions Inventory (VFPA, 2017). For the Port of Vancouver, fine
particulate matter is reported for DPM because DPM was not quantified separately in past inventories.
3
  The 2005 baseline intensity data in this report is different than previous reports, because the 2005 emissions were
adjusted with an updated methodology in the 2015 and 2016 emission inventories.
4
  2015 Port of Vancouver Emissions Inventory and 2016 Puget Sound Maritime Air Emission Inventory.

        January 2019                                                                                                   4
Northwest Ports Clean Air Strategy: 2017 Implementation Report
• GHG emissions / 10,000 metric ton of cargo moved: 17% lower in 2015/16, compared to 2005.
The significant reductions in DPM emissions are primarily the result of regulatory changes requiring
the use of low sulfur fuels for ships (starting in 2015), in addition to cleaner engine standards in new
vehicles and equipment. The reductions in the intensity of GHG emissions demonstrate an overall
increase in efficiency of vehicles, equipment and operations over time.
Figure 1: Changes in emission intensity between 2005 and 2015/16, relative to 2020 targets
0%
2005 2010/2011 2015/2016 2020
Percemt change in emissions per metric ton of cargo
-10%
-20%
-30%
-40%
-50%
-60%
-70%
-80%
-90%
-100%
DPM DPM 2020 Target GHGs GHG 2020 Target
Table 2. Changes in emissions intensity between 2005 and 2015/16, by port
Port Change in DPM emissions Change in GHG emissions
intensity in 2015/16, relative to intensity in 2015/16, relative to
2005 2005
Northwest Seaport -80% -19%
Alliance 5
Seattle -79% -8%
Tacoma -77% -22%
Vancouver -78% -10%
5
Prior to formation of the Northwest Seaport Alliance in 2015, emissions were assigned to the ports of Seattle and
Tacoma. The 2016 Puget Sound Maritime Emissions Inventory re-apportioned 2005 and 2011 emissions to align with
each port's current operating scope.
January 2019 5Northwest Ports Clean Air Strategy: 2017 Implementation Report
3. Ocean-Going Vessels
Ocean-going vessels (OGV) include container ships, cruise ships, tanker ships, bulk cargo ships and
breakbulk cargo ships. Performance reporting focuses on the types of engines and fuel being used,
and participation in Port-designed or third-party rating programs.
Context
Based on the 2015/16 emission inventories, OGVs produced approximately 46% of DPM emissions
and approximately 50% of GHG emissions from activities related to the ports within the airshed. Table
3 summarizes the number of unique vessels, and the total number of calls made by those vessels.
On August 1, 2012, the International Maritime Organization designated waters off North American
coasts as an Emissions Control Area (ECA), with increasingly stringent restrictions going into effect
between 2012 and 2015. These standards dramatically reduce air pollution from ships and deliver
substantial air quality and public health benefits that extend hundreds of miles inland. By 2020,
emissions from ships operating in the North American ECA are expected to be reduced by 90,000
metric tons for PM2.5 and 920,000 metric tons for SOx annually (74%, and 86%, respectively, below
predicted levels in 2020 absent the ECA).6 NOx emissions are also anticipated to reduce as the
number of Tier 3 vessels operating in the region increase over time.
6
https://westcoastcollaborative.org/files/sector-marine/the-north-american-eca-1.pdf
January 2019 6Northwest Ports Clean Air Strategy: 2017 Implementation Report
Table 3. Number of ocean-going vessels and vessel calls at the Ports in 2017
Port Number of vessels Number of vessel calls
Northwest Seaport Alliance 413 1,857
Seattle 81 287
Tacoma 69 71
Vancouver 1,675 3,278
Performance Targets
OGV-1: Vessels surpass Emission Control Area requirements
2015 Target Early compliance with 2015 ECA 0.1% fuel-sulfur level (or equivalent) while hoteling
[TARGET COMPLETE]
By 2020, Ports track number of vessel calls with Tier 3 marine engines, shore
2020 Target
power use, cleaner fuel, or other emission-reduction technologies7
What is This measure reports the number of vessel calls to the Ports that have Tier 3 marine
being engines, and/or use shore power, cleaner fuel (liquefied natural gas), or other
measured? emission-reduction technologies, to the best of the Ports' knowledge.
The Ports created this performance target to recognize the importance of
Why is this
supporting shipping lines in adopting fuels or technologies that reduce emissions
important?
beyond those required by the 2015 ECA.
In 2017, 3% of vessel calls had Tier 3 engines, used shore power, and/or used
How did we
cleaner alternative fuel, compared to 4% in 2016. The number of vessel calls that
do?
meet the standard declined from 221 calls in 2016 to 187 calls in 2017.
Emission Control Area (ECA): The North American ECA is a geographic boundary
that extends approximately 200 nautical miles off the coast of the Pacific and
Definition
Atlantic/Gulf coasts (excluding Mexico). Under the IMO rules, different standards
of terms
apply to ships while operating outside emission control areas versus those
operating in established ECAs.
7
The OGV-1 2020 target was first reported in the 2015 Report based on the number of vessels, rather than the number
of vessel calls. The 2016 report, and this report both present data based on vessel calls for all years, and includes vessel
calls that were known to use shore power, or vessels that have a “keel laid date” on or after January 1, 2016 (which are
presumed to have Tier 3 engines).
January 2019 7Northwest Ports Clean Air Strategy: 2017 Implementation Report
Figure 2. OGV-1: Percent of vessel calls with known Tier 3 marine engines, shore power use,
cleaner fuel, or other emission reduction technologies 2017
50%
45%
40%
35%
Percemt of vessel calls
30%
25%
20%
15%
10%
5%
0%
2015 2016 2017
Combined Ports Total Port of Vancouver Port of Seattle
Port of Tacoma Northwest Seaport Alliance
OGV-2: Ports and vessels participate in Port-designed or third-party programs that
promote continuous improvement
By 2015, Ports and 10% of vessel calls participate in Port-designed or third-party programs
2015 Target that promote continuous efficiency improvements
[TARGET COMPLETE]
By 2020, Ports and 40% of vessel calls participate in Port-designed or third-party
2020 Target programs that promote continuous efficiency improvements
[TARGET EXCEEDED]
This measure reports whether the Ports participated in third-party programs.
What is
being This measure also reports the percentage of calls to the four ports that are from
measured? vessels that participate in a Port-designed or a third-party program that promotes
continuous improvement, to the best of the Ports' knowledge.
The Ports have the greatest influence over vessels when they are in port, at anchor,
Why is this at dock, or maneuvering. Ports can encourage vessel operators to reduce
indicator emissions by incentivizing emission reductions through alternative fuels and
important? technologies, or through participation in continuous improvement programs. This
measure captures the level of participation in these programs.
How did we In 2017, 3 out of the 4 Ports participated in the Green Marine program as ports.
do? 69% of vessel calls to the ports were made by vessels participating in at least one
continuous improvement program, as listed below, compared to 54% in 2016, due
January 2019 8Northwest Ports Clean Air Strategy: 2017 Implementation Report
to an increase of participating vessels calling at the ports of Tacoma and
Vancouver.
Port-designed programs: For 2017, this includes the Port of Vancouver EcoAction
Program, which helps to promote continuous improvement.
Third-party programs: For 2017, programs included are the Environmental Ship
Index (ESI), Green Award, RightShip, Clean Shipping Index (Port of Vancouver
Definition ships only), or Green Marine. Note that only RightShip participants that have
of terms verified Existing Vessel Design Index data are included.
Port participation in third-party certification programs: For 2017, this included Ports
that participated in the Green Marine Program. For all other programs, Ports were
considered to participate if they incentivized participation in the program (e.g.
provided discounts to visiting vessels that participate in the program).
Figure 3. OGV-2: Percent of vessel calls participating in Port-designed or third-party
certification programs8
100%
90%
80%
70%
Percemt of vessel calls
60%
50%
40%
30%
20%
10%
0%
2015 2016 2017
Combined Ports Weighted Average Port of Vancouver
Port of Seattle Port of Tacoma
NWSA 2020 Target (40%)
8
Participating vessel calls at Port of Tacoma were updated for 2016 to include Rightship verified participants that were
not previously counted in the 2016 report.
January 2019 9Northwest Ports Clean Air Strategy: 2017 Implementation Report
Implementation Efforts in 2017 by Port: OGV
Port: Port of Vancouver
OGV-1: In 2017, 54 calls were made by eight cruise vessels that connected to
shore power, and two calls were made by vessels with Tier 3 engines, based on
keel laid date only. Combined, this represents 2% of calls, and 0.6% of vessels. In
2017, the use of shore power at the Canada Place Cruise Terminal reduced
How is the emissions of GHGs by 2,126 tonnes, and particulate matter by 0.9 tonnes.
Port of OGV-2: In 2017, VFPA participated in the Green Marine Program as a port. VFPA
Vancouver also participated in ESI, Green Award, RightShip, Clean Shipping Index and Green
doing? Marine by offering discounts to vessels that participate in the programs.
71% of calls were made by vessels participating in one or more of VFPA’s
EcoAction Program, ESI, Green Award, RightShip, Clean Shipping Index, or Green
Marine. This represents 2,341 out of 3,278 calls for the year.
EcoAction Program and Blue Circle Award
In 2017, these programs continued to recognize and reward vessels that go beyond
regulatory requirements to reduce air emissions (considering both air quality
Program pollutants and greenhouse gases). Eligible options for discount through the
for OGVs: EcoAction Program include acceptable scores in third-party environmental rating
systems, and cleaner fuels and technologies.
14 shipping lines received the Blue Circle Award for 2017. The award is given to
those lines with the greatest proportion of participation in the EcoAction Program.
In 2017, VFPA continued to develop shore power at two of the four container
terminals.
VFPA is leading the development of an international collaboration on vessel
Other
emission reductions. In partnership with other ports and industry stakeholders, the
initiatives:
intention is to develop an approach that aims to increase participation in vessel
incentive programs and use of environmental infrastructure such as shore power,
supporting further reduction of impacts from international shipping.
Port: Port of Seattle
OGV-1: The Port has two cruise terminals with a total of three berths. The two
berths at T91 are equipped with shore power. Of the homeport ships that are
capable of plugging in to shore power, 31% (31 of 101) of vessel calls connected
in 2017. Zero calls were made by vessels with Tier 3 engines or cleaner fuels.
How is the Looking at total POS vessel calls in 2017, this represents 11% of calls, and 1% of
Port of vessels that met this target. This figure is lower than in prior years, because POS
Seattle had more accurate data on actual shore power connections in 2016 and 2017.
doing? OGV-2: In 2017, POS continued participating in Green Marine as a port. In 2017,
35% of vessel calls were made by ships participating in at least one third-party
certification program, including ESI or RightShip (verified data only). This number
is lower than in previous years because POS discontinued the Green Gateway
Partners program in 2017, which most homeport cruise lines had joined in the past.
The Port discontinued its Green Gateway Partners program. In its place, the Port
Program initiated an “Environmental Excellence Awards” program, which was opened to all
for OGVs: maritime sectors.
Other None to report for 2017.
initiatives:
January 2019 10Northwest Ports Clean Air Strategy: 2017 Implementation Report
Port: Port of Tacoma
OGV-1: In 2017, none of the 71 ship calls to Port of Tacoma had Tier 3 engines,
used shore power or implemented other emission-reducing technologies.
How is the
Port of OGV-2: The Port of Tacoma is not participating in a third-party certification program.
Tacoma 58 of the 71 ship calls to POT (82%) participated in at least one third-party
doing? certification program, including ESI and RightShip (where data is verified only). This
is an increase from 66% in 2016.
Program None to report for 2017.
for OGVs:
Other None to report for 2017.
initiatives:
Port: The Northwest Seaport Alliance
OGV-1: In 2017, 5% of container ships calls to NWSA terminals used shore power.
How is the OGV-2: NWSA completed its first third-party verification of its Green Marine
Northwest performance in 2017.This was the second year the NWSA completed the Green
Seaport Marine program.
Alliance In 2017, 49% of vessel calls (916 out of 1,857) were from vessels participating in
doing? at least one third-party certification program, including ESI and RightShip (where
data is verified only).
Program TOTE Maritime Alaska continues to use shore power at berth for the Midnight Sun
for OGVs: and the Northern Star.
The NWSA continues to track calls by shore power equipped vessels for planning
Other future operations and shore power facilities. The NWSA is planning to expand
initiatives: shore power installation in both North and South Harbors.
January 2019 11Northwest Ports Clean Air Strategy: 2017 Implementation Report 4. Harbor Vessels Harbor vessels include harbor and ocean tugs; there are approximately 166 such vessels providing service at the ports. There are other types of harbor vessels operating near ports (e.g. ferry vessels, excursion vessels, and government vessels) but these are not directly related to port activity, and are not included in the scope of this report. Performance is tracked based on reporting best practices and engine upgrades, and participation in programs that promote continuous improvement. Context Port-related harbor vessels account for approximately 8% of DPM emissions and 8% of GHG emissions from activities related to the ports, based on the 2015/16 emission inventories. Since 2012, regulations have required the use of ultra-low sulfur diesel (ULSD) fuel, resulting in significant reductions in emissions from harbor vessels. Table 4 summarizes the number of harbor vessel companies and vessels at each port. Because the tug fleet for NWSA, POS and POT are the same companies operating in the same waters of Puget Sound, harbor vessel data for NWSA, POS and POT are reported together. Table 4. Number of harbor vessel companies and vessels at the ports in 2017 Port Number of harbor vessel companies Number of harbor vessels POS, POT & NWSA 3 37 Vancouver 17 129 January 2019 12
Northwest Ports Clean Air Strategy: 2017 Implementation Report

Performance Targets
Harbor-1: Strategy partners conduct annual outreach to port-related harbor vessel
companies and recognize best practices and engine upgrades
                        By 2015, partners conduct outreach and 50% of harbor vessel companies report best
   2015 Target          practices and engine upgrades
                        [WORKING TOWARDS TARGET]

                        By 2020, partners conduct outreach and 90% of harbor vessel companies report
   2020 Target
                        best practices and engine upgrades
                        In the 2013 Strategy, Ports and Strategy partners committed to identifying activities
                        that increase fuel efficiency and reduce emissions, and to share this information
                        with harbor vessel owners and operators. This measure reports whether partners
                        conducted outreach with these owners and operators during 2017, including
   What is              workshops, brown bag sessions, and meetings to discuss efficiency ideas,
   being                practices or projects.
   measured?
                        To support this measure, Ports and Strategy partners collect data directly from
                        harbor vessel companies, or from relevant continuous improvement programs. The
                        percentage of harbor vessel companies that reported and the percentage that
                        undertook engine upgrades and best practices during 2017 are also reported.
                        One way to reduce emissions from harbor vessels is to replace the vessels or
                        repower them (replace their engines), but these efforts are expensive and beyond
                        the control of the Ports. The Strategy partners believe promoting increased vessel
   Why is this          fuel efficiency and best practices is the best way to work with this sector. Through
   important?           annual outreach the Ports and Strategy partners will help keep harbor vessel
                        owners and operators informed of best practices that reduce emissions.
                        Tracking what companies are doing to incorporate best practices and upgrade or
                        replace their engines provides an annual snapshot of emission reduction activities.
                        Partners conduct outreach: In 2017, one Port hosted seven outreach sessions,
                        while the Clean Air Agency worked with harbor vessel companies to successfully
                        apply for and obtain an engine replacement grant from the EPA.
                        Harbor vessel companies report on best practices and engine upgrades: 45%
                        (nine) companies reported their progress through participation in EcoAction,
   How did we           through submissions to Green Marine or through communication with Strategy
   do?                  partners.
                        Companies undertook best practices and engine upgrades: 40% (eight of 20)
                        companies undertook best practices or engine upgrades – four through their
                        participation in the Green Marine program, seven through the use of shore power,
                        and one by replacing auxiliary engines on one vessel and retrofitting three tugs to
                        be shore power capable in order to plug in at two new plug-in pedestals.
                        Best practices: Participation in Green Marine or in EcoAction, or using shore power
                        are counted as following best practices.
                        Engine upgrades: This includes replacing the engine (also known as “repowering”
   Definition           the vessel), replacing the auxiliary engine, or installing a kit that reduces emissions
   of terms             by 25% (called a 1042 kit). Installing a 1042 kit is not counted as a best practice if
                        the harbor vessel owner is required to install it (i.e. in the U.S. a kit is required if the
                        owner is overhauling the engine, if the old engine was manufactured on or after
                        1973, and if the engine is greater than 800 horsepower).

January 2019                                                                                                     13
Northwest Ports Clean Air Strategy: 2017 Implementation Report
Harbor-2: Ports and harbor vessels participate in Port-designed or third-party
certification programs that promote continuous improvement
By 2015, Ports and 10% of harbor vessels participate in Port-designed or third-party
2015 Target certification programs that promote continuous improvement
[TARGET COMPLETE]
By 2020, Ports and 40% of harbor vessels participate in Port-designed or third-
2020 Target
party certification program that promote continuous improvement
This measure identifies whether the Ports participate in the Green Marine program
(currently the only third-party certification program available for tugs) with respect
What is to providing incentives to tug operators.
being
measured? This measure also reports the percentage of harbor vessels that participate in the
Port of Vancouver EcoAction Program or in the third-party Green Marine Program,
which both promote continuous improvement for harbor vessels.
Programs that promote continuous improvement provide a consistent framework
for companies to report progress on achieving various environmental measures.
Participants either get higher scores for or must go beyond regulatory compliance
Why is this in these programs.
important? Although the Ports have little to no control over harbor vessel engines and fuel-
efficiency practices, the Ports can influence these measures by providing incentives
to companies that join and annually participate in third party certification programs,
or by developing their own program to promote continuous improvement.
In 2017, three of the four Ports (Northwest Seaport Alliance, Seattle and
Vancouver) participated in the Green Marine program. The Vancouver Fraser Port
Authority also provided discounted harbor dues to those tugs operated by
How did we companies who are Green Marine certified, or that have shore power. POS, POT
do? and NWSA did not offer incentives to tug companies, and no tug companies in
Puget Sound were Green Marine certified.
34% of harbor vessels participated in third-party certification programs. One port-
related harbor vessel company reported engine upgrades.
Certification programs: Includes programs applicable to ports and harbor vessel
companies that promote continuous improvement, either Port-designed or by a
Definition third party. The Port of Vancouver currently offers the Port-designed EcoAction
of terms program for harbor vessels.
Third-Party Certification: Currently Green Marine offers the only third-party
environmental certification program for harbor vessels.
January 2019 14Northwest Ports Clean Air Strategy: 2017 Implementation Report
Implementation Efforts in 2017 by Port: Harbor Vessels
Port: Port of Vancouver
Harbor-1: VFPA hosted seven outreach events in 2017: two Port Environmental
Managers Breakfast Sessions for tenants, including tug companies, which were
forums for sharing information on environmental best practices and evolving
regulations, and five sessions for Climate Smart Program participants. 2017
marked the third year that VFPA partnered with Climate Smart to offer training to
tenants, including tug companies, on measuring, managing and communicating
How is the reductions in GHG emissions. Training was offered as a three-part series, with an
Port of additional information session and follow-up session also offered in 2017.
Vancouver Harbor-2: VFPA participated in Green Marine as a port, and with respect to harbor
doing? vessels by offering discounted fees to companies through its EcoAction Program.
The primary harbor vessel companies at VFPA reported on air emission and other
best practices in 2017 through Green Marine.
43% of tugs operating within the Port of Vancouver participated in Green Marine,
with 4 of 17 companies representing 56 of 129 tugs being members (Seaspan,
Saam Smit, North Arm Transportation and Ledcor Resources).
Two tug companies received the Blue Circle Award for 2017, for their continuous
Other
leadership in air emissions reduction and environmental performance. Seven tug
initiatives:
companies reported using shore power with their vessels.
Port: Port of Seattle
Port of Tacoma
The Northwest Seaport Alliance
Harbor-1: The Puget Sound Clean Air Agency worked with harbor craft companies
to apply for a $650,000 engine replacement grant from the EPA, which was
How are the awarded in fall of 2017.
ports
doing? Harbor-2: Two of the three ports participated in Green Marine. None of the U.S.
harbor companies participated in third-party continuous improvement programs,
however two of the three completed engine upgrades.
The Clean Air Agency obtained funding from Ecology to support the installation of
Other one shore power terminal with two-plug-ins and the retrofit of three tug boats with
initiatives: shore power capability in 2017. Another tug company purchased new clean vessels
including two vessels with Tier 3 engines and one vessel with Tier 4 engines.
January 2019 15Northwest Ports Clean Air Strategy: 2017 Implementation Report
5. Cargo-Handling Equipment
Cargo-handling equipment (CHE) moves goods on marine terminals between ships, railcars, and
trucks. Examples of CHE include: straddle carriers, rubber-tired gantry (RTG) cranes, reach stackers,
top and side picks, forklifts, skid loaders, yard tractors / yard trucks, etc. Performance targets focus
on achieving more stringent engine emission standards, recognizing the conversion of equipment to
cleaner engines and improving fuel-efficiency practices.
Context
The CHE sector contributes 8% of DPM emissions and 6% of GHGs from activities related to the four
ports, as summarized in the 2015/16 inventories. Table 5 summarizes the number of terminals
operating CHE, and the total number of equipment at each port. Note that all CHE that was previously
operated at POT is now accounted for under NWSA, as well as most POS CHE.
Table 5. Number of terminals with CHE, and number of units in 2017
Port Number of CHE9 Number of terminals with Total number of terminals
CHE
NWSA 741 13 15
Seattle 63 3 3
Tacoma 0 0 1
Vancouver 1,510 27 27 and other operations
9
Number of CHE excludes equipment that is exclusively electric (e.g. conveyor belts and ship-to-shore cranes), but
includes electric equipment that could operate on other fuels. Note that Vancouver data includes other non-road
equipment.
January 2019 16Northwest Ports Clean Air Strategy: 2017 Implementation Report
Performance Targets
CHE-1: CHE meets Tier 4 interim (T4i) emission standards or equivalent
By 2015, 50% of CHE meets Tier 4 Interim
2015 Target
[WORKING TOWARDS TARGET]
2020 Target By 2020, 80% of CHE meets Tier 4 Interim
This performance target tracks the percentage of CHE that has Tier 4i or better
engines on a port-wide basis, regardless of terminal size or type of operation. This
target recognizes engines with retrofits or repowers that result in Tier 4i equivalent
What is
PM emission rates and replacement of equipment (for example, replacing diesel
being
with electric, gasoline, propane or natural gas-fuelled equipment). Where emission
measured?
reduction technology has been installed that reduces emissions but does not
achieve Tier 4i emission levels, partial credit is given (for example, Diesel Oxidation
Catalysts or Diesel Particulate Filters on older equipment).
Older diesel equipment, especially non-road engines, generate significantly more
Why is this emissions per volume of fuel used. This target tracks the proportion of the fleet that
important? meets Tier 4 Interim emission levels or better. It includes emission reductions
achieved through retrofits or engine replacements.
How did we 44% of CHE met Tier 4 Interim across all ports (see chart below), which is 5% more
do? than 2016 (39%).10
Definition Tier 4 Interim or T4i: The Tier 4 Interim emissions standards required lower PM
of terms emissions prior to final Tier 4 standards that also required lower NOX/HC emissions.
Figure 4. CHE-1: Percent of CHE meeting Tier 4 interim emission standards or equivalent
100%
90%
80%
70%
60%
Percent of CHE
50%
40%
30%
20%
10%
0%
2015 2016 2017
Combined Ports Weighted Average Port of Vancouver
Northwest Seaport Alliance Port of Seattle
2020 Target (80%)
10
VFPA updated the numbers for 2015 as well as 2016 in this report (relative to previous reports) as a result of 1)
methodology change due to new data available through the NRDE; and 2) updated 2015 port emission inventory. The
latter includes a change in scope of tenants that are included or excluded resulting from a transition away from the port
authority managing lands on behalf of the Province.
January 2019 17Northwest Ports Clean Air Strategy: 2017 Implementation Report
CHE-2: Ports and terminals have fuel-efficiency plans in place that promote
continuous improvement
By 2015, Ports and 50% of terminals have fuel-efficiency plans
2015 Target
[WORKING TOWARDS TARGET]
2020 Target By 2020, Ports and 100% of terminals have fuel-efficiency plans
What is This measure reports on whether each of the Ports had plans in place to address
being fuel efficiency of CHE.
measured? The measure also reports the percent of terminals that had fuel-efficiency plans for
CHE, to the best of the Ports' knowledge.
Significant emission reductions come from replacement, repowering or exhaust
Why is this retrofits, however these can be expensive, have limited available options, and can
important? increase other operating and maintenance costs. Implementing fuel-efficiency
plans promotes emission reductions in all equipment, including older equipment.
How did we In 2017, three of four ports with CHE had fuel-efficiency plans in place. The Ports
do? facilitated fuel efficiency in relation to CHE in the following ways: the Vancouver
Fraser Port Authority runs a program that requires tenants to have fuel-efficiency
plans in order to be eligible for fee rebates; NWSA aims to reduce fuel consumption
under their CHE idle-reduction plans.
23% of terminals (10 out of 43) had a known fuel-efficiency plan for CHE in place,
which represents no change from 2016.
Definition Fuel-efficiency plans: A fuel-efficiency plan sets out goals or objectives to increase
of terms operational efficiency, reduce use of fuels, and/or seek alternative sources of fuel
that improve efficiency and reduce emissions from equipment operating on port
land. The plan may also identify policies or actions that will be put into place to
achieve the goals or objectives.
January 2019 18Northwest Ports Clean Air Strategy: 2017 Implementation Report
Figure 5. CHE-2: Percent of CHE terminals with fuel-efficiency plans11
100%
90%
Percent of CHE terminals with fuel-efficiency plans 80%
70%
60%
50%
40%
30%
20%
10%
0%
2015 2016 2017
Combined Ports Weighted Average Port of Vancouver Northwest Seaport Alliance
Port of Seattle Port of Tacoma 2020 Target (100%)
11
Since 2015, POT has not operated any terminals with CHE. POS has three terminals with CHE, but these do not have
fuel-efficiency plans and therefore are not visible on the graph.
January 2019 19Northwest Ports Clean Air Strategy: 2017 Implementation Report
Implementation Efforts in 2017 by Port: CHE
Port: Port of Vancouver
CHE-1: In 2017, 42% of non-road equipment within the Port of Vancouver met
Tier 4i equivalent standards or better.
CHE-2: VFPA does not have operational control over CHE. As a result, its
approach is to address fuel efficiency in this sector through the Non-Road Diesel
How is the Emissions (NRDE) Program.
Port of
Vancouver 30% (8 of 27 terminals) plus 1 shipyard and 1 stevedoring company had known
doing? fuel-efficiency plans in place, based on participation in Green Marine.
DP World Centerm, with the support of VFPA has been trialing the effectiveness of
the Effenco Active Stop Start technology on their terminal tractors. Preliminary
results are positive, more information on this project can be found in the pilot studies
and demonstrations projects section later in this report.
Non-Road Diesel Emissions (NRDE) Program
VFPA’s NRDE Program, in place since 2015, requires tenants to pay fees for
Program operating Tier 1 and older non-road diesel equipment. The program also includes
for CHE: requirements around reporting, labelling, opacity and auditing. In order to be eligible
for fee rebates of up to 80% when the equipment is upgraded, retired and/or
replaced with a Tier 2 or newer or equivalent engine, tenants are also required to
maintain a fuel efficiency plan.
For the third year in a row, VFPA partnered with Climate Smart Businesses Inc. to
offer training to tenants on measuring, managing and communicating reductions in
GHG emissions. Training is offered as a three-part series, with an additional
information session and follow-up session. Since VFPA started offering the
Other program in 2015, 22 tenants have participated and have recorded a reduction of
initiatives: 4,341 tonnes of carbon dioxide equivalent and a $1,277,897 in annual cost
savings.
Two terminals received the Blue Circle Award for 2017. The award is given to those
companies that demonstrate leadership and achievements in energy conservation.
Port: Port of Seattle
How is the CHE-1: In 2017, 87% of CHE at POS terminals met Tier 4i equivalent standards or
Port of better.
Seattle
doing? CHE-2: POS terminal operators did not have fuel efficiency plans in place for CHE.
Program
None to report for 2017
for CHE:
Other
None to report for 2017
initiatives:
Port: Port of Tacoma
How is the
Port of CHE is accounted for under NWSA below. The only terminal remaining under the
Tacoma POT umbrella is a grain terminal, which has no CHE.
doing?
January 2019 20Northwest Ports Clean Air Strategy: 2017 Implementation Report
Port: The Northwest Seaport Alliance
How is the
Northwest CHE-1: In 2017, 45% of CHE at NWSA terminals met Tier 4i equivalent standards
Seaport or better.
Alliance CHE-2: Two of 13 terminals have a fuel efficiency plan in place.
doing?
Program None to report for 2017.
for CHE:
NWSA scrapped and replaced one Tier 1 yard truck, with a Tier 4 version in 2017,
with partial funding assistance provided by EPA DERA and Ecology.
Other
initiatives: Ecology continued to provide Diesel Particulate Filter cleaning services to CHE
owners.
January 2019 21Northwest Ports Clean Air Strategy: 2017 Implementation Report
6. Trucks
The truck sector covers on-road heavy-duty container trucks that move cargo to and from marine
terminals. Performance is reported through the age of the fleet of container trucks serving port
activities, and the prevalence of fuel-efficiency plans. Since 2015, trucks hauling containers are
reported for the Port of Vancouver and the Northwest Seaport Alliance only (containerized cargo of
Ports of Seattle and Tacoma is now managed by the NWSA).
Context
Trucks account for 17% of DPM emissions and 20% of GHGs from activities related to the four ports,
as summarized in the 2015/16 inventories. Table 6 summarizes the number of container terminals,
and the total number of container truck companies and trucks operating at the Port of Vancouver and
the Northwest Seaport Alliance terminals.
Table 6. Number of container terminals, truck companies, trucks in 2017
Number of container Number of truck
Port Number of trucks
terminals companies
Northwest
Seaport 10 129 4,149
Alliance
Seattle n/a n/a n/a
Tacoma n/a n/a n/a
Vancouver 4 123 1,847
January 2019 22Northwest Ports Clean Air Strategy: 2017 Implementation Report
Performance Targets
Truck-1: Trucks meet or surpass EPA emission standards or equivalent for model
year 2007
2017 Target By 2017, 100% of trucks meet or surpass 2007 EPA emission standards
What is This measure tracks the percentage of trucks that have engines that meet the
being equivalent PM emission standard of a 2007 or newer engine, including engines with
measured? retrofits or repowers that result in equivalent emission rates or lower.
Newer truck engines generate significantly lower emissions due to more stringent
federal vehicle standards. Model year 2007 engines are 10 times cleaner than 1994
Why is this to 2006 truck engines for PM emissions. This measure tracks how many trucks are
important? being replaced with those that have newer, low-emission engines and associated
emission controls. It also recognizes emission reductions achieved through retrofits
or engine replacements.
How did we The combined ports' average in 2017 is 54% (see chart below), which has
do? increased annually since 2011 (when it was 15%).
2007 emission requirements: The U.S. and Canadian federal governments set
Definition emission standards for heavy-duty diesel engines. In 2007, the allowed PM
of terms emissions dropped to 0.01 grams/brake horsepower-hour, 1/10th of the 1994 to
2006 standard for PM emissions.
Figure 6. Truck-1: Percent of trucks that meet or surpass U.S. EPA emission standards or
equivalent for model year 2007
100%
90%
80%
70%
Percent of trucks
60%
50%
40%
30%
20%
10%
0%
2015 2016 2017
Combined Ports Average Port of Vancouver Northwest Seaport Alliance
Port of Seattle Port of Tacoma 2017 Target (100%)
January 2019 23Northwest Ports Clean Air Strategy: 2017 Implementation Report
Truck-2: Ports, terminals, and truck companies have fuel-efficiency plans in place that
promote continuous improvement12
By 2015, Ports have fuel-efficiency plans
2015 Target
[WORKING TOWARDS TARGET]
2020 Target By 2020, Ports, terminals, and 50% of truck companies have fuel-efficiency plans
What is This measure reports on whether each of the Ports and truck companies has
being adopted fuel-efficiency plans, based on participation in the EPA SmartWay
measured? Program. Port programs that facilitate fuel efficiency in trucks are also highlighted.
Effective methods of reducing DPM emissions are to replace vehicles or repower
them with engines (and corresponding emission controls) that are model year 2007
Why is this or newer, or to install exhaust retrofits. However, emission standards addressing
important? GHGs did not take effect for new vehicles until 2014. Since trucks contribute almost
20% of the port-related GHG emissions, another way of reducing these emissions
is to adopt fuel-efficiency practices.
In 2017, none of the Ports had fuel-efficiency plans in place. However, the Ports
facilitated fuel efficiency in trucks through the following initiatives: the Truck
How did we Licensing System and Smart Fleet Initiative at the Port of Vancouver, and the
do? Northwest Seaport Alliance FRATIS project.
In 2017, 21% of trucking companies that service NWSA terminals participated in
EPA’s SmartWay Program, which has a focus on fuel efficiency.
Fuel-efficiency plan: A fuel-efficiency plan sets out goals or objectives to increase
operational efficiency, reduce use of fuels, and/or seek alternative sources of fuel
Definition
that improve efficiency and reduce emissions from equipment operating on port or
of Terms
terminal land. The plan may also identify policies or actions that will be put into
place to achieve the goals or objectives.
12
In the 2013 Strategy, Truck-2 states that the number of trucks with fuel-efficiency plans will be tracked. Due to the
difficulty of tracking individual trucks, the Ports will track the number of truck companies that have fuel-efficiency plans.
January 2019 24Northwest Ports Clean Air Strategy: 2017 Implementation Report
Implementation Efforts in 2017 by Port: Trucks
Port: Port of Vancouver
Truck-1: At the end of 2017, 55% of the entire drayage fleet met particulate
matter engine emission limits of a 2007 or newer engine, based on trucks of
How is the Port model year 2008 or newer.
of Vancouver Truck-2: VFPA does not have operational control over container trucks. Its
doing? approach to addressing fuel efficiency in this sector is to continue to implement
a program that moves the fleet toward newer, cleaner models, coupled with
good maintenance and idling limits.
Truck Licensing System (TLS)
VFPA continued to implement increasingly stringent environmental
requirements on drayage trucks accessing the port through the TLS Program.
Requirements in 2017 included:
• 2006 and older model year trucks and 2007 model year trucks with
2006 engines need to have an eligible emission reduction measure
Program for (e.g. diesel oxidation catalyst) installed, applicable to those trucks
Trucks: already in the TLS. 2005 and older trucks were previously required to
install similar measures.
• Trucks new to the TLS to be 2010 or newer.
• 10-year and older trucks to be tested and pass 20% opacity limit.
• All trucks not to exceed maximum three consecutive minutes idling in
any 60-minute period.
Port: The Northwest Seaport Alliance
Truck-1: At the end of 2017, 53% of approximately 4,400 trucks had 2007 or
newer engines, or equivalent. In order to give drivers additional time to purchase
compliant trucks beyond the original deadline of Jan 1, 2018, and ensure
efficient movement of cargo through the gateway, the NWSA Managing
Members took the following action in 2018:
• Effective April 1, 2018, all drayage trucks entering NWSA international
container terminals must have a 2007 engine or newer or equivalent
emissions control retrofits to be considered compliant (“2007 Emission
Standard”). To continue to access the terminals after April 1, 2018, a
driver with a non-compliant truck may apply for a Temporary Access
Pass. This pass requires a commitment from the trucker to become
How is the compliant by the end of 2018.
Northwest • Effective January 1, 2019, all non-compliant trucks will be turned away
Seaport from NWSA international container terminals.
Alliance
Managing Members also authorized for the NWSA to spend $1 million to
doing?
establish a Clean Truck Fund Program and to partner with certified Community
Development Financial Institutions to ensure all drivers have access to fair and
affordable financing.
This additional time to meet the Truck-1 goal of the Strategy will allow drivers
extra time to procure financing and secure an appropriate compliant truck; allow
the NWSA to negotiate lease amendments with international container terminal
operators and users to contractually obligate them to only allow compliant trucks
onto their cargo terminals after April 1, 2018; allow the NWSA to offer additional
resources, workshops and support to drivers to help them become compliant;
and install a unified truck tracking technology across both Harbors.
January 2019 25Northwest Ports Clean Air Strategy: 2017 Implementation Report
Port: The Northwest Seaport Alliance
Truck-2: NWSA did not have a fuel-efficiency plan in place for trucks in 2017.
Two of the 13 terminals have fuel efficiency plans that include drayage trucks.
21% of listed NWSA drayage providers participate in EPA’s SmartWay program
as truck carrier partners.
Drayage truck registry
The NWSA continues to register drayage trucks serving the international
container terminals at both the ports of Seattle and Tacoma. The drayage truck
registry is the reference database to verify the age of a truck. In 2017, NWSA’s
South Harbor continued to issue stickers to trucks, and the North Harbor issued
RFID (radio frequency identification) tags. [Note: during 2018, RFID technology
has been installed at international container terminals in the South Harbor, and
all trucks serving NWSA will utilize a unified RFID system by the end of 2018.]
ScRAPS
NWSA continued to support the ScRAPS (Seaport Scrappage and
Program for Replacements for Air in Puget Sound) program in 2017. The program was
Trucks: funded from several sources including a U.S. Department of Transportation
Congestion Mitigation and Air Quality (CMAQ) grant, a Washington State
Department of Ecology grant, an EPA Diesel Emission Reduction Act (DERA)
grant, and a CMAQ supplemental grant, alongside matching funds from NWSA.
This program provided financial incentives of $20,000 to $27,000 per truck to
eligible owners who scrap old trucks. The program, administered by Puget
Sound Clean Air Agency, replaced and scrapped a total of 413 trucks over the
lifetime of the program, which ended in mid-2017.
Puget Sound Clean Air Agency administered funds from EPA CMAQ and
Ecology for scrapping and replacing 73 drayage trucks in 2017. Truck owners
also made significant investments.
Over a 12-month pilot period in 2017, the NWSA conducted a study of a Vehicle
Wait Time Awareness System at 8 of its marine terminals to monitor queuing
times outside the terminal gates and on terminals. The goal was to improve
operational efficiency by providing drivers, terminals and the port with real-time
data that could inform their activities. Data was collected through Bluetooth
signals from cellphones in the trucks.
Other
Although Bluetooth has been used successfully in highway applications to
Initiatives:
collect data for traffic planning studies, it struggled to provide real time reliability
in the dynamic port environment where a smaller volume of vehicles move at
slower speeds. Due to a lack of reliability, the app used by the drivers declined
in use. Next steps include employing RFID technology to assess on-terminal
turn times and looking for alternate methods to assess the length of the queue
outside the gates.
January 2019 26You can also read