Implication of tropical lower stratospheric cooling in recent trends in tropical circulation and deep convective activity - Atmos. Chem. Phys
←
→
Page content transcription
If your browser does not render page correctly, please read the page content below
Atmos. Chem. Phys., 19, 2655–2669, 2019
https://doi.org/10.5194/acp-19-2655-2019
© Author(s) 2019. This work is distributed under
the Creative Commons Attribution 4.0 License.

Implication of tropical lower stratospheric cooling in recent trends
in tropical circulation and deep convective activity
Kunihiko Kodera1 , Nawo Eguchi2 , Rei Ueyama3 , Yuhji Kuroda1,4 , Chiaki Kobayashi1 , Beatriz M. Funatsu5 , and
Chantal Claud6
1 Climate Research Department, Meteorological Research Institute, Tsukuba, 305-0052, Japan
2 Research Institute for Applied Mechanics, Kyushu University, Kasuga, 816-8580, Japan
3 Earth Science Division, Atmospheric Science Branch, NASA Ames Research Center, Moffett Field, CA 94035-0001, USA
4 Meteorological College, Japan Meteorological Agency, Kashiwa, 277-0852, Japan
5 CNRS, Université de Nantes, UMR 6554 LETG, Campus du Tertre, Nantes, 44312, France
6 Laboratoire de Météorologie Dynamique, Ecole Polytechnique, Palaiseau, 91128, France

Correspondence: Kunihiko Kodera (kodera.kk@gmail.com)

Received: 4 February 2018 – Discussion started: 16 February 2018
Revised: 5 January 2019 – Accepted: 2 February 2019 – Published: 28 February 2019

Abstract. Large changes in tropical circulation from the          1   Introduction
mid-to-late 1990s to the present, in particular changes re-
lated to the summer monsoon and cooling of the sea sur-
face in the equatorial eastern Pacific, are noted. The cause      Large changes in tropical circulation occurred from the mid-
of such recent decadal variations in the tropics was stud-        to-late 1990s to the present, in particular changes related to
ied using a meteorological reanalysis dataset. Cooling of the     the summer monsoon and cooling of the sea surface in the
equatorial southeastern Pacific Ocean occurred in association     equatorial eastern Pacific. Such a decrease in the tropical
with enhanced cross-equatorial southerlies that were associ-      east Pacific sea surface temperature (SST) has been associ-
ated with a strengthening of the deep ascending branch of the     ated with a slowdown, or hiatus, of global warming (Kosaka
boreal summer Hadley circulation over the continental sector      and Xie, 2013; England et al., 2014; Trenberth et al., 2014;
connected to stratospheric circulation. From boreal summer        Watanabe et al., 2014). Changes were also found in the ad-
to winter, the anomalous convective activity center moves         vancement of the onset of the Asian summer monsoon (Ka-
southward following the seasonal march to the equatorial In-      jikawa et al., 2012; Gautam and Regmi, 2013; Xiang and
dian Ocean–Maritime Continent region, which strengthens           Wang, 2013; Yun et al., 2014) and an increase in precipitation
the surface easterlies over the equatorial central Pacific. Ac-   over the Sahel in West Africa (Fontaine et al., 2011; Brandt
cordingly, ocean surface cooling extends over the equatorial      et al., 2014; Maidment et al., 2015; Diawara et al., 2016). An
central Pacific. We suggest that the fundamental cause of the     increase in precipitation in southern Africa was also observed
recent decadal change in the tropical troposphere and the         during austral summer (Vizy and Cook, 2016). In addition to
ocean is a poleward shift of convective activity that resulted    these large-scale circulation changes, variations occurred in
from a strengthening of extreme deep convection penetrat-         mesoscale phenomena such as an increase in mesoscale con-
ing into the tropical tropopause layer, particularly over the     vective systems (MCSs) over the Sahel (Taylor et al., 2017).
African and Asian continents and adjacent oceans. We con-         A relationship between tropopause layer cooling and tropi-
jecture that the increase in extreme deep convection is pro-      cal cyclone activity in the Atlantic has also been suggested
duced by a combination of land surface warming due to in-         (Emanuel et al., 2013). Indeed, recent numerical model stud-
creased CO2 and a reduction of static stability in the tropical   ies show that cooling of the tropopause, as well as SSTs, im-
tropopause layer due to tropical stratospheric cooling.           pacts the intensity of tropical storms (Ramsay, 2013; Wang
                                                                  et al., 2014). In this respect, the recent cooling of the tropical
                                                                  tropopause and lower stratosphere from around 2000 (Randel

Published by Copernicus Publications on behalf of the European Geosciences Union.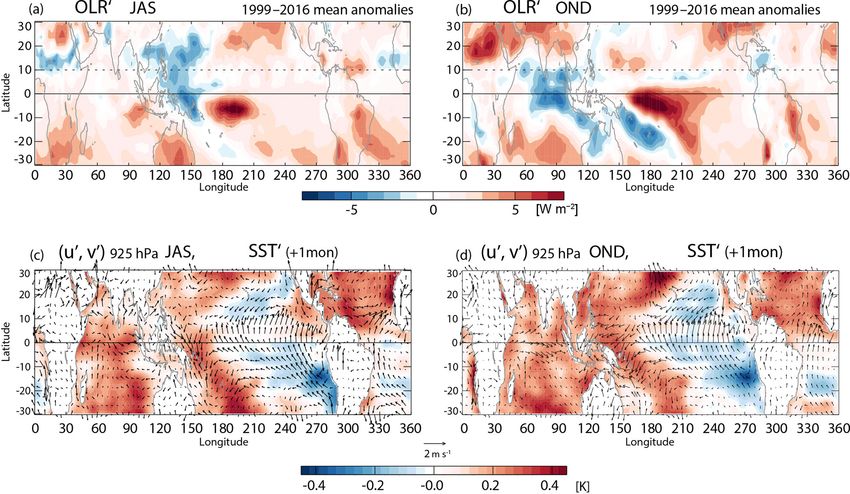
2656                                                                 K. Kodera et al.: Stratospheric cooling trend and convection

et al., 2006; Randel and Jensen, 2013) should be investigated           fundamental factor which produces recent decadal trends in
together with tropical tropospheric change.                             boreal summer. For the purposes of this paper we assume that
   The importance of the Pacific Decadal Oscillation (PDO)              the changes that we discuss are not directly related to those
to decadal changes in global temperature and precipitation              associated with tropical expansion.
has been noted previously (Meehl et al., 2013; Dong and                    Global climate change involves diverse aspects from the
Dai, 2015; Trenberth, 2015). The most recent hiatus in global           stratosphere to the ocean, from the polar region to the tropics,
warming ended around 2013 followed by a strong warming                  and from monsoons to severe storms. Each of these elements,
due to an El Niño event in 2015 (Hu and Fedorov, 2017;                  as well as their relationships to each other and their roles in
Liu and Zhou, 2017; Urabe et al., 2017; Xie and Kosaka,                 global climate change, should be investigated independently
2017). However, the El Niño of 2015/16 differed from the                in great detail. Without the latter, we will be unable to see
large 1997/98 El Niño, which involved less warming in the               the “big picture”. Stratospheric variation has generally been
eastern Pacific (Paek et al., 2017), conforming to a trend in           treated as a problem separate from recent surface climate
increasing intensity of central Pacific-type El Niños (Kao and          change. The goal of this study is to provide a framework for
Yu, 2009; Johnson, 2013). In this sense, the anomalous trop-            assembling these diverse pieces of the climate-change puzzle
ical circulation from the mid-1990s to late 1990s did not ter-          by investigating the connection between the atmosphere and
minate with the hiatus around 2013 but still persists today.            ocean in the tropics.
Similarly, the northward shift of the convective zone in bo-               The remainder of this paper is organized as follows. The
real summer continues, as shown below.                                  data used in this study are presented in Sect. 2, and the results
   Multidecadal variations in the atmosphere–ocean coupled              of our analysis are given in Sect. 3. A summary and discus-
mode, such as the Atlantic Multidecadal Oscillation, have               sion of the causes of recent climate changes in the tropics are
also been proposed as a cause of recent changes in the tropics          presented in Sect. 4.
(Wang et al., 2013; Kamae et al., 2017). Kamae et al. (2017)
studied the impact of SSTs in various oceanic basins on re-
cent trends in monsoon precipitation using a coupled ocean              2   Data
model. They were able to reproduce the recent increasing
trend in monsoon rainfall in the Northern Hemisphere (NH),              We use meteorological reanalysis data produced by the
except for the Asian monsoon, with changes in Atlantic SST.             Japan Meteorological Agency (JMA), JRA-55 (Kobayashi et
Atlantic SSTs, however, have practically no effect on the               al., 2015). A large discontinuity was found at the end of the
African or Australian monsoons in the Southern Hemisphere               1990s in a previous reanalysis product, JRA-25, when the
(SH). Another difference from observations is that the simu-            TIROS Operational Vertical Sounder (TOVS) on board the
lated increase in rainfall occurs mainly over the oceans and            National Oceanic and Atmospheric Administration (NOAA)
at low latitudes between the Equator and 15◦ N rather than              satellite was switched to Advanced TOVS (ATOVS; Li et
the observed increase over continents between around 10 and             al., 2000). This discontinuity has largely been removed in
20◦ N (see Fig. 3 of Kamae et al., 2017). Thus, it is difficult to      the JRA-55 reanalysis (Kobayashi et al., 2015).
attribute recent global trends to a regional mode of decadal               Outgoing longwave radiation (OLR) data provided by
oceanic variation alone. In this paper, we suggest that the             NOAA are widely used in analyses of convective activity in
fundamental cause of the recent decadal trend in the tropics            the tropics. In the present study, we use monthly mean OLR
from around 1999 is not the PDO but rather a strengthening              data (1◦ × 1◦ latitude–longitude resolution) derived from the
of the deep ascending branch of the summertime Hadley cir-              High-Resolution Infrared Radiation Sounder (HIRS) (Lee et
culation associated with a cooling in the lower stratosphere            al., 2007). An analysis of the precipitation is performed using
and a warming in the troposphere.                                       Global Precipitation Climatology Project (GPCP) monthly
   One of the components of the recent tropical circula-                mean data version 2.3 (Adler et al., 2003). Monthly mean
tion change is an expansion of the tropics (e.g., Davis and             gridded SST data from COBE with 1◦ × 1◦ grid cells com-
Rosenlof, 2012; Lucas et al., 2013; Hu et al., 2018; Byrne              piled by the JMA (Ishii et al., 2005) are used for the study of
et al., 2018). Tropical expansion has been linked to changes            ocean surface change.
in the descending branch of the Hadley cell in the subtropics              In the case of extreme deep convection, a strong updraft
(Kang and Polvani, 2011), but other potential mechanisms                further penetrates beyond the level of neutral buoyancy and
include changes in SST and in the vertical temperature struc-           overshoots into the tropical tropopause layer (TTL). Such
ture of the troposphere, an overall increase in tropopause              tropical overshooting clouds (COV) were identified using
height, the internal variability in the climate system, and             the diagnostics developed by Hong et al. (2005), which are
possibly stratospheric climate change (Seidel et al., 2007).            based on brightness temperature differences measured by
Among the studies on tropical expansion those on the role of            three high-frequency channels of the Advanced Microwave
the tropical SST (Allen et al., 2014; Amaya et al., 2018) may           Sensing Unit (AMSU) module B or the Microwave Humidity
be relevant to the present study. However, as will be shown             Sensor (MHS). Data are from NOAA and MetOp satellites
later, a decadal ocean variability such as PDO may not be a             with periods of 2007–2013 for MetOp-A and 2014–2017 for

Atmos. Chem. Phys., 19, 2655–2669, 2019                                                  www.atmos-chem-phys.net/19/2655/2019/
K. Kodera et al.: Stratospheric cooling trend and convection                                                                 2657

MetOp-B. Their equatorial crossing times are nearly identi-         tongues in the oceans. Convective activity shifts northward
cal (see Fig. 1 of Funatsu et al., 2016). The original data cal-    during boreal summer. Accordingly, cross-equatorial winds
culated on a 0.25◦ × 0.25◦ grid were resampled to a coarse          west of the American and African continents increase, which
one of 2.25◦ × 2.25◦ grid for plotting. The number density          leads to a decrease in SSTs along coastal regions during bo-
of COVs is defined as the total number of COVs detected             real summer as a part of a seasonal cycle. The primary cause
in each 2.25◦ × 2.25◦ bin divided by the MetOp–MHS total            of cold tongues in tropical SSTs is the shape of the conti-
pixel number to remove sampling bias, with units of parts per       nents, the air–sea interaction, and the location of the rising
thousand.                                                           branch of the Hadley circulation, as described by Xie and
   The climatology is defined here as the 30-year mean from         Philander (1994) and Xie (2004). We suggest in this paper
1981 to 2010. The exact starting dates of the recent decadal        that changes in the meridional circulation can similarly af-
change are difficult to determine, on the one hand, due to          fect equatorial eastern Pacific SSTs by modulating the cross-
the interannual variability (such as the El Niño events) and        equatorial winds, as depicted in Fig. 2.
variable-dependent characteristics of change. For example,             In order to investigate whether the northward shift in the
while some variables show a stepwise transition, others show        convective zone is driven by the PDO, anomalous OLR dur-
a more gradual change. In the present study, we define the re-      ing the two periods of neutral and negative phases of the PDO
cent decadal change as the 1999–2016 mean anomalies from            is shown in Fig. 1c and d with anomalous SSTs during those
the 30-year (1981–2010) mean unless otherwise specified.            periods (Fig. 1e and f). A characteristic horseshoe pattern
By selecting the year 1999 as the starting year, we excluded        in northern Pacific SST is evident during the negative phase
the extremely large 1997/98 El Niño event from the recent           of the PDO. Anomalous OLR indicates that convective ac-
period.                                                             tivity is enhanced along 15–20◦ N irrespective of the phase
   Seven El Niño events after 1979 are identified by the            of the PDO, except for the sector under the direct influence
JMA based on 6-monthly mean SSTs in the Niño 3 sector               of the PDO in the eastern Pacific, where cooling is greater
(5◦ S–5◦ N, 150–90◦ W; available at http://ds.data.jma.go.jp/       during the negative phase. However, even during the neutral
gmd/tcc/tcc/products/elnino/ensoevents.html). In this study,        phase of the PDO, negative anomalies in SST exist in the
we define the NH cold seasons of 1982/83, 1986/87, 1991/92,         tropics west of South America. This suggests that SST cool-
1997/98, 2002/03, 2009/10, and 2015/16 as El Niño winters.          ing west of South America is not driven solely by the PDO
                                                                    but is related to stronger cross-equatorial winds that we hy-
                                                                    pothesize are connected to an enhanced convective activity
3     Results                                                       over the African–Asian sector.
                                                                       The atmospheric circulation and SST changes associated
3.1    Recent decadal change                                        with the convective activity are depicted in Fig. 2. The spa-
                                                                    tial structure of the recent decadal trend varies with the sea-
The recent change of tropical convective activity is identified     son. The top panels show the 1999–2016 mean anomalous
from the July–August–September (JAS) 1999–2016 mean                 OLR during (a) JAS and (b) October, November, and De-
anomalous OLR relative to the 30-year climatology (1981–            cember (OND). Because the response of SST follows the at-
2010; Fig. 1a). Increase in convective activity occurs over         mospheric circulation, anomalous SSTs during the follow-
the African and Asian summer monsoon regions. Deep con-             ing month (i.e., August, September, and October, ASO, and
vective activity reaching the TTL in boreal summer is lo-           November, December, and January, NDJ) are displayed in
cated primarily over the continents and their adjacent ocean        Fig. 2c and d. During JAS, the anomalous cross-equatorial
north of 10◦ N (see, e.g., Fig. 2 in Liu and Zipser, 2005).         flow west of South America intensifies following a poleward
It should be noted that the climatological mean streamlines         shift in convectively active regions. The cross-equatorial
around 15◦ N are connected to the stratosphere by crossing          flow changes from westward to eastward when it crosses
the tropopause (100 hPa) in boreal summer (see, e.g., Fig. 3        the Equator, following the change in sign of the Coriolis
of Seviour et al., 2012). In the present study, we call this part   force. This results in a strengthening of the climatologi-
of the ascending branch of the Hadley circulation that pen-         cal easterlies in the SH and enhances anomalous conver-
etrates the lower stratosphere the “deep ascending branch”.         gence near New Guinea. In contrast, easterlies are weak-
Because the latitudinal location of the extreme deep convec-        ened in the NH, which explains the warming (cooling) north
tive zone is higher than that of the oceanic Intertropical Con-     (south) of the Equator. Such a meridional seesaw of anoma-
vergence Zone (ITCZ), enhancement of convective activity            lous SSTs and cross-equatorial flow suggests an important
of this continental sector appears as a poleward shift in con-      role for wind–evaporation–SST (WES) feedback (Xie and
vective activity in the zonal-mean field (Fig. 1b): whereas         Philander, 1994) in recent trends. The center of anomalous
the climatological OLR peaks around 10◦ N, the anomalous            negative OLR moves to the equatorial eastern Indian Ocean
OLR of the recent period has a maximum around 15◦ N.                from boreal summer to autumn, which results in a strengthen-
   There is a close relationship between the location of the        ing of anomalous easterlies over the equatorial central Pacific
seasonally varying tropical convective active zone and cold         and a westward extension of low SSTs over the Equator.

www.atmos-chem-phys.net/19/2655/2019/                                                Atmos. Chem. Phys., 19, 2655–2669, 2019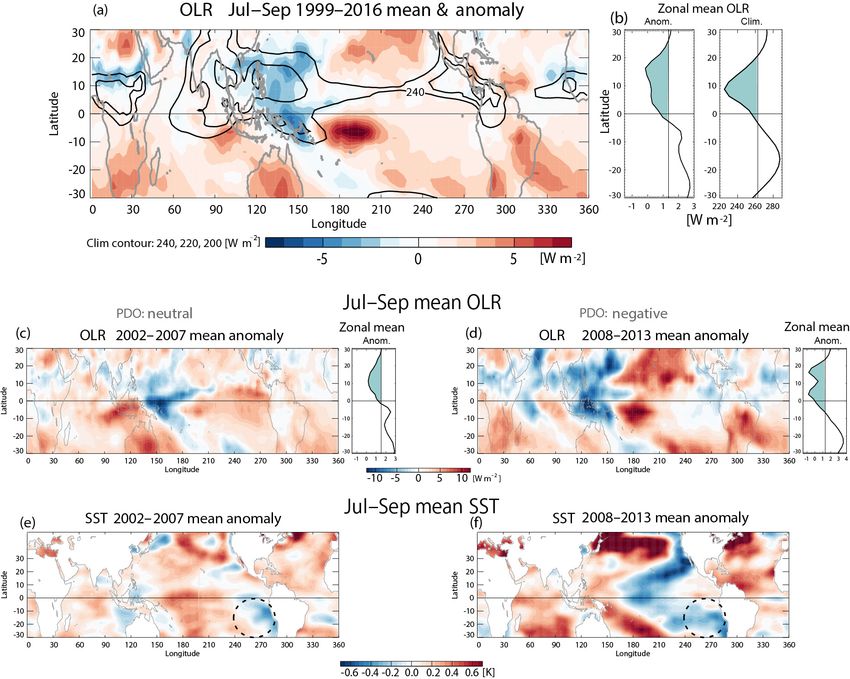
2658                                                               K. Kodera et al.: Stratospheric cooling trend and convection

Figure 1. (a) Climatological (1981–2010) JAS mean OLR (contours: 240, 220, and 200 W m−2 ) and anomalous JAS OLR (departures from
climatology) during 1999–2016 (color shading); (b) zonal-mean profiles of (a): anomalies from climatology (left) and climatology (right);
(c) anomalous OLR as in (a) and (b, left) but for 2002–2007; (d) anomalous OLR as in (a) and (b, left) but for 2008–2013, and anomalous
July–September SST (departures from climatology) for (e) 2002–2007 and (f) 2008–2013.

Figure 2. (a) JAS and (b) OND mean anomalous OLR for 1999–2016; (c) JAS and (d) OND mean anomalous horizontal winds at 925 hPa
(arrows) for 1999–2016 superimposed on anomalous SSTs (color shading) with a 1-month lag (i.e., ASO and NDJ, respectively).

Atmos. Chem. Phys., 19, 2655–2669, 2019                                                  www.atmos-chem-phys.net/19/2655/2019/
K. Kodera et al.: Stratospheric cooling trend and convection 2659
3.2 Ascending branch of the Hadley circulation to-year variation. In addition, the amplitude of the interan-
nual variation in the time series of SVD 1 and 3 shows a
The Hadley circulation is usually represented by a pair of decadal change. In the case of SVD 1, negative values be-
thermally direct cells, symmetric about the Equator, with came smaller from the beginning of the 2000s, whereas in the
rising motion over the equatorial belt and sinking motion case of SVD 3 negative values become larger from the end of
over the subtropics, with noticeable seasonal variability (e.g., the 1990s. This almost simultaneous change in the amplitude
Dima and Wallace, 2003). The mean meridional circulation and a similarity in spatial structure suggest the possibility
driven by extreme deep convection further penetrates up to that a decadal variation in the spatial structure of the same
the tropical tropopause (Liu and Zipser, 2005). Here we first phenomenon is represented by two SVD modes.
investigate the different modes of variability in mean merid- Correlation coefficients between the time coefficients of
ional circulation and their relationship with Hadley cells dur- the divergence component of each SVD mode and the OLR,
ing the boreal summer, focusing on the vertical structure in- divergence at 925 hPa, and surface (2 m) air temperature
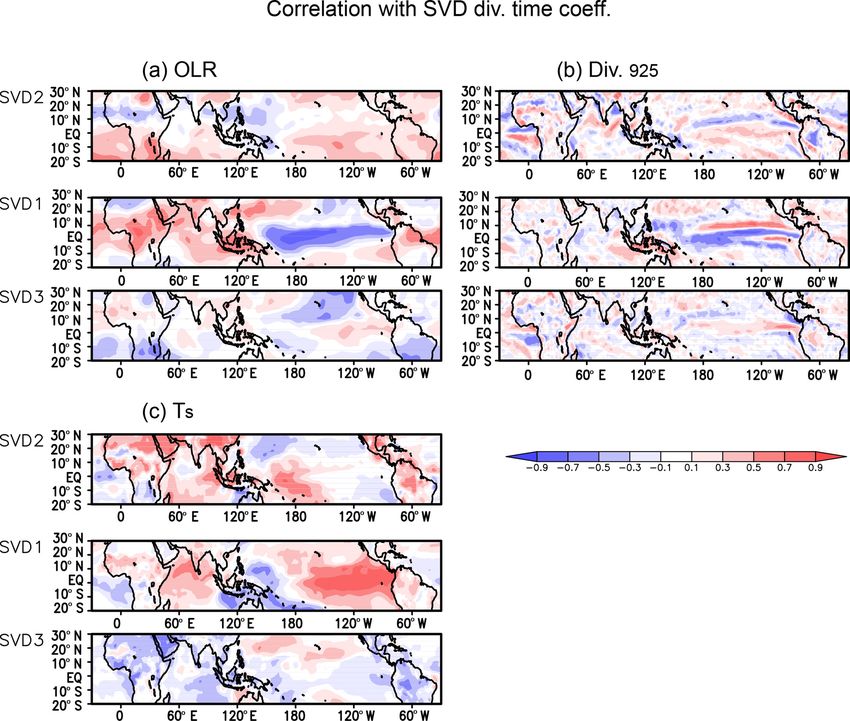
cluding the lower stratosphere. are shown in Fig. 4. (For easier comparison correlation
Because large detrainment occurs from deep convective with SVD 1 time coefficients are displayed above those of
clouds near the cloud top, a combination of the vertical veloc- SVD 3.) SVD 2 has quite different characteristics compared
ity and horizontal divergence may indicate large-scale circu- to SVD 1 and 3: reinforced negative OLR (that is, of con-
lation related with deep convective activity. Therefore, a sin- vective activity) does not coincide with the region of higher
gular value decomposition (SVD) analysis (Kuroda, 1998) surface temperature as in SVD 1 and 3. Surface tempera-
was conducted using the normalized covariance matrix be- ture does not change or even decrease in some part over the
tween zonal-mean pressure vertical velocity (ω) and horizon- African–Asian continental sector. It is also noted that the en-
tal air divergence for July–August–September (JAS) 1979– hanced convective zone over the continental sector shows lit-
2016. The value at each grid point was weighted by the tle relationship with the convergence near the surface. SVD 1
vertical-layer thickness and the cosine of the latitude in the is easily identified as a phenomenon related to the El Niño–
meridional direction. The SVD calculations were performed Southern Oscillation (ENSO) with large amplitude in the sur-
from 700 to 30 hPa levels, but to obtain a general view of face temperature and OLR over the equatorial eastern Pacific.
the entire troposphere the heterogeneous correlation was ex- This is in agreement with results from the times series shown
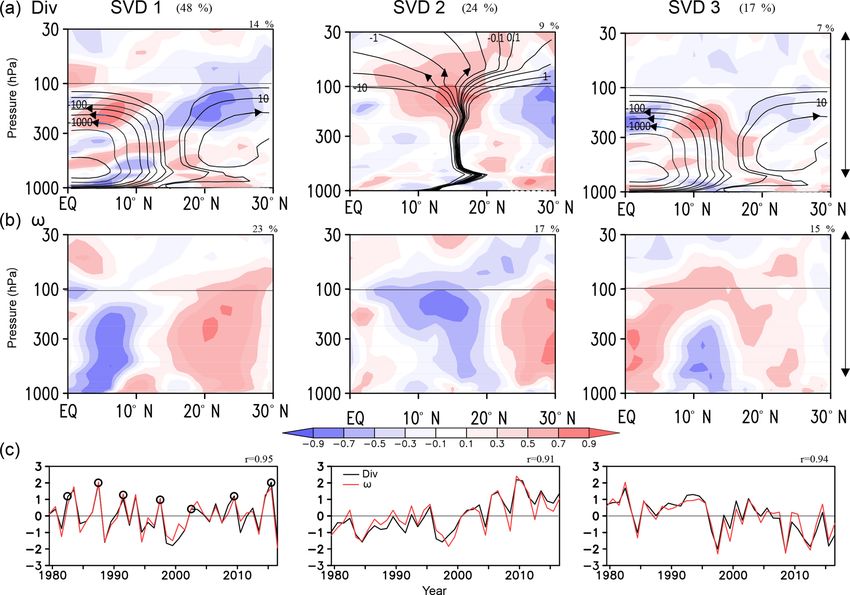
tended down to 1000 hPa. Results for the three SVD leading in Fig. 3c for SVD 1, which shows that peaks in the time
modes are presented in Fig. 3. series coincide with the occurrence of the El Niño (dots).
Figure 3a shows that the centers of actions in the di- Surface temperature and divergence maps of SVD 3 show a
vergence field are located in the upper troposphere around meridional seesaw in the tropical northeastern Pacific. Such a
200 hPa for SVD 1 and 3, whereas in the case of SVD 2 it is pattern suggests that SVD 3 is related with the Pacific merid-
located around the tropopause at 100 hPa. Accordingly, the ional mode (PMM) (Chiang and Vimont, 2004) or the cen-
vertical velocity fields of SVD 1 and 3 are confined within tral Pacific ENSO (Stuecker, 2018). The above results sup-
the troposphere, but that of SVD 2 is extended from the TTL port the rationale that the decadal evolution of ENSO-related
to the lower stratosphere. It is also noticeable that SVD 1 and variation is represented by two SVD modes 1 and 3.
3 show a similar structure of a meridional seesaw in diver- The present analysis suggests that the variability in the
gence and vertical velocity fields, except that the horizontal deep ascending zone represented by SVD 2 is a linearly in-
scale of SVD 3 is about half of SVD 1. dependent mode from that related to the oceanic ITCZ, rep-
The mass stream function of the climatological residual resented by SVD 1 and 3. However, the climate system is
mean meridional circulation (Kobayashi and Iwasaki, 2016) highly nonlinear. Therefore, changes in the deep ascending
was examined (Fig. 3a) in order to investigate the corre- branch of the Hadley circulation such as those represented
spondence between the climatological Hadley circulation. in SVD2 could modulate the ITCZ over the oceanic sector
For convenience, streamlines related to the closed cells in through induced changes in cross-equatorial winds as sug-
the troposphere, and those extending to the stratosphere (i.e., gested in Fig. 2.
deep ascending branch), are displayed separately. The results
suggest that SVD 1 and 3 represent changes in the strength 3.3 Variations over continents and oceans
and meridional shift of the rising branch of Hadley cells. For
SVD 2, however, the picture is different: negative values of In the analysis above, two different features of decadal vari-
vertical velocity field in SVD 2 are located along the climato- ability are evident, over oceanic and continental sectors. Ac-
logical streamlines connected to the stratosphere, suggesting cording to our hypothesis the former corresponds to the
a strengthening of vertical velocity around the climatologi- variability in oceanic ITCZ constituting the main ascending
cal deep ascending branch of the Hadley cell. The different branch of the Hadley cells, and the latter is related to the
nature of SVD 2 from that of SVD 1 and 3 is also appar- deep ascending branches of the Hadley circulation connected
ent in their time coefficients: an increasing trend is promi- to the stratosphere. Here we examine variations over the
nent for SVD 2, while for SVD 1 and 3 there is large year- African continental (10◦ W–40◦ E) and Pacific Ocean (170–
www.atmos-chem-phys.net/19/2655/2019/ Atmos. Chem. Phys., 19, 2655–2669, 2019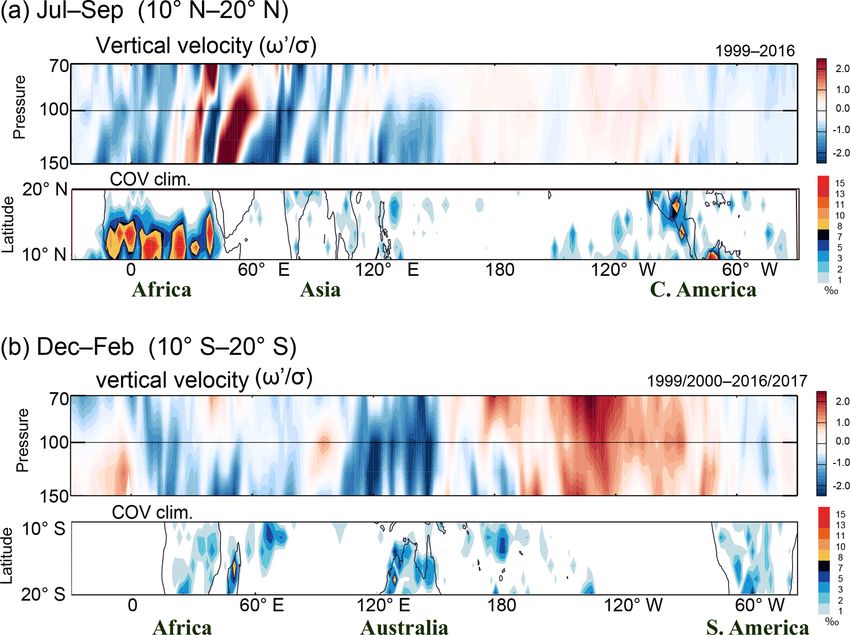
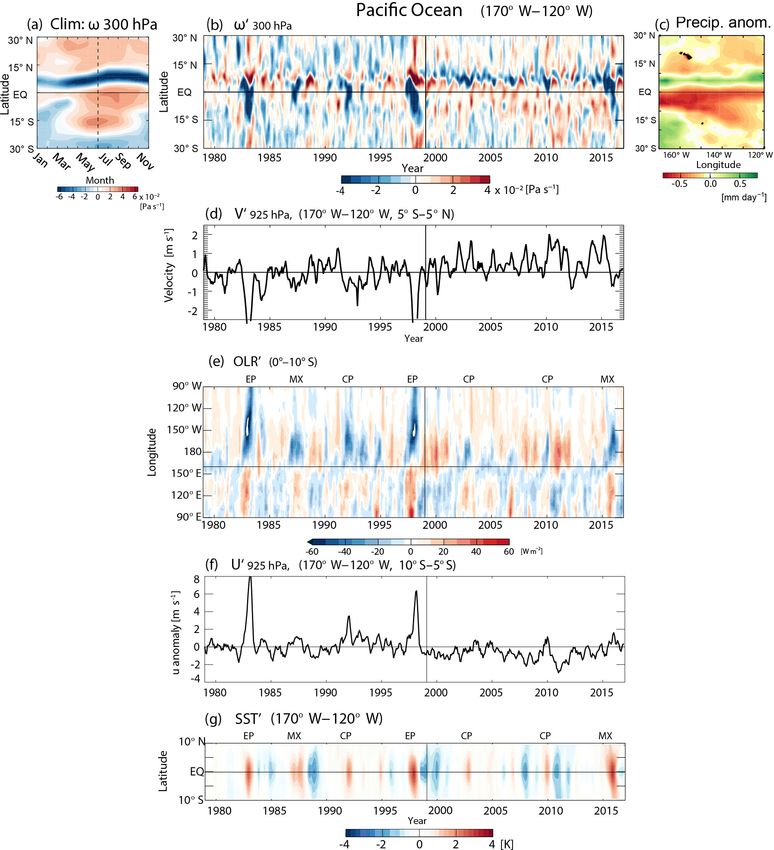
2660                                                                K. Kodera et al.: Stratospheric cooling trend and convection

Figure 3. Singular value decomposition analysis of the zonal-mean anomalous horizontal divergence and anomalous pressure vertical ve-
locity in the tropics (Equator–30◦ N) during JAS from 1979 to 2016: from left to right, SVD 1, SVD 2, and SVD 3. (a) Heterogeneous
correlation map of horizontal divergence. (b) Same as (a), except for the pressure vertical velocity map. (c) Time coefficients (black: di-
vergence; red: pressure vertical velocity). Right-hand-side arrows indicate the levels used in the SVD calculations. Streamlines in (a) in-
dicate mass stream function of the climatological residual mean meridional circulation (streamlines are plotted with logarithmic scaling:
±0.1, 0.2, 0.5, 1, 2, 5, 10, 20, 50, 100 . . . × 1010 kg s−1 ). Open circles in (c) indicate an El Niño event.

120◦ W) sectors to reveal the most prominent characteristics            gion of upward motion, however, tends to remain north of the
in each region. The climatological annual cycle in zonal-               Equator after 1999. Accordingly, the annual mean anomalous
mean pressure vertical velocity at 300 hPa for each region is           precipitation during the recent period shows a large increase
depicted in Figs. 5a and 6a. A region of enhanced convective            near 5–10◦ N, the mean position of the ITCZ over the ocean,
activity migrates north and south over the African continent            but decreases over the Equator and the SH (Fig. 6c). This
following the seasonal variation in solar heating (Fig. 5a).            manifests as a narrowing and intensification of the ITCZ in
It should be noted that the evolution of the convective zone            recent decades, with little change in its latitudinal position
includes a jump during the summer monsoon season (Ha-                   (Lucas et al., 2013; Wodzicki and Rapp, 2016). The change
gos and Cook, 2007). Over the Pacific Ocean, the convective             over the ocean sector is related to the varying strength of the
zone shows only a small latitudinal displacement and is lo-             cross-equatorial winds (Fig. 6d). After 1999, although SSTs
cated in the NH near 5–10◦ N throughout the year (Fig. 6a).             increased over the Equator during El Niño events, anoma-
Latitude–time cross sections of the 3-monthly mean anoma-               lous northward winds remained strong and convective activ-
lous (departures from the 1981–2010 climatology) 300 hPa                ity tended to remain in the NH.
vertical velocities are shown for February 1979 to Novem-                  Figure 6e shows the longitude–time section of the anoma-
ber 2016 over the African sector in Fig. 5b. The vertical               lous OLR over the equatorial SH (0–10◦ S). The effects of
velocity increases from the mid-1990s in both hemispheres               cooling of the eastern equatorial Pacific in the SH can also
around 10–20◦ in latitude, which according to our hypothe-              be seen in structural changes in El Niño–Southern Oscil-
sis corresponds to the location of the deep ascending branch            lation (ENSO) phenomena after 1999. Convective activity
in summertime Hadley circulation. Accordingly, the annual               greatly increases over the Pacific during El Niño events be-
mean precipitation over Africa has increased during the re-             fore 1999. However, after 1999, Pacific convective activity
cent period (1999–2016) in both hemispheres over the Sahel              is suppressed and an increase in convective activity during
and Namibia (Fig. 5c).                                                  El Niño is apparent only over the central Pacific. In con-
   Over the Pacific Ocean sector (Fig. 6b), strong upward               trast, convective activity west of 160◦ E over the Maritime
motion appears over the Equator when El Niño events oc-                 Continent generally increases after 1999. Such changes are
cur. This has been identified as an effect of the ENSO on               likely related to a decadal change in anomalous zonal winds
the ITCZ (Waliser and Gautier, 1993). The anomalous re-                 over the tropical SH (10◦ S–5◦ N; Fig. 6f), which in turn is

Atmos. Chem. Phys., 19, 2655–2669, 2019                                                   www.atmos-chem-phys.net/19/2655/2019/
K. Kodera et al.: Stratospheric cooling trend and convection                                                                         2661

Figure 4. Correlation coefficient between time series of divergence component of each SVD mode and (a) OLR, (b) horizontal divergence
at 925 hPa, and (c) surface temperature, at each grid. Each panel in (a, b, c) shows a correlation map of SVD 2, SVD 1, and SVD 3, from top
to bottom.

Figure 5. (a) Latitude–time section of the climatological zonal-mean pressure vertical velocity at 300 hPa averaged over the African sector
(10◦ W–40◦ E), (b) latitude–time section of monthly mean anomalous pressure vertical velocity from February 1979 to November 2016, and
(c) latitude–longitude map of annual mean anomalous precipitation during 1999–2016 over the African sector. A 3-month running mean is
applied in (b).

connected to increased cross-equatorial southerlies through             Therefore, meridional sections of standardized mean JAS
Coriolis-force effects. Latitude–time sections of 3-monthly             1999–2016 anomalous pressure vertical velocity were calcu-
anomalous SSTs in the Niño 3.4 sector (Fig. 6g) indicate                lated for several sectors instead of zonal means (Fig. 7). The
little change in latitudinal structure; thus changes in spatial         top panel in Fig. 7a shows the anomalous zonal-mean field
structure related to the ENSO around 1999 support our inter-            (shaded), which is comparable to that extracted by SVD 2
pretation of the relationship between SVD 1 and 3 above.                in Fig. 3b, along with contours indicating the 30-year cli-
    We next take a closer look into tropospheric vertical veloc-        matology for reference. The middle panels are the same as
ity variations. The tropospheric zonal-mean vertical veloc-             the top panel but divided into two parts: (b) an African–
ity has a relatively weak connection with the horizontal dis-           Asian continental sector (30◦ W–130◦ E) and (c) a Pacific–
tribution of OLR possibly because regional-scale variations             Atlantic oceanic sector (130–330◦ E). A strengthening of up-
dominate in the lower troposphere due to surface topography.            ward velocity in the TTL and lower stratosphere occurs in

www.atmos-chem-phys.net/19/2655/2019/                                                     Atmos. Chem. Phys., 19, 2655–2669, 2019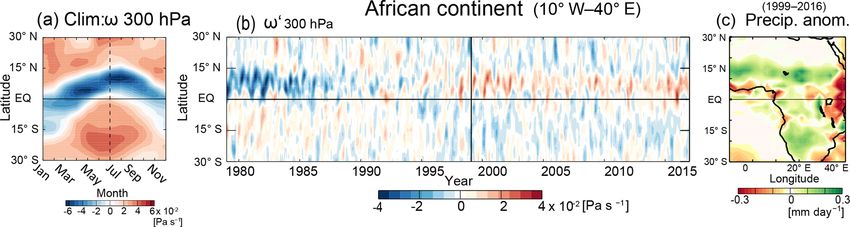
2662                                                               K. Kodera et al.: Stratospheric cooling trend and convection

Figure 6. (a–c) Same as Fig. 5 but for the eastern Pacific Niño 3.4 (170–120◦ W) sector; (d) monthly mean anomalous meridional wind
component around the Equator (5◦ S–5◦ N) over the Niño 3.4 sector; (e) similar to (a) but for the time–longitude section of OLR around the
Equator (5◦ S–5◦ N) over the Indian Ocean–Pacific sector; (f) same as (d) but for the zonal wind component in the tropical SH (10–5◦ S);
(g) monthly mean anomalous SST over the Niño 3.4 sector. Eastern Pacific (EP), central Pacific (CP), and mixed-type (MX) El Niño events
are indicated (Paek et al., 2017).

the continental sector, together with a northward shift in the         servation can be attributed to the fact that convergence oc-
troposphere, whereas in the oceanic sector a strengthening             curs over the warm ocean east of New Guinea (Fig. 2c). This
in vertical velocity occurs around 5–10◦ N without a latitu-           result indicates that despite a variety of profiles among the
dinal shift. If we limit the continental sector to the African         sectors, the zonal-mean vertical field in the TTL primarily
continent (20◦ W–20◦ E) to exclude the influence of the In-            follows variations over the African–Asian continental sector.
dian Ocean, the abovementioned continental characteristics
become even clearer (Fig. 7d). Over the oceanic sector, an             3.4   Stratosphere–troposphere coupling
increase in vertical velocity occurs around 7.5◦ N (Fig. 7f),
but in the western Pacific sector (130–170◦ E) the upward              Continuity in a zonally averaged field does not necessarily
velocity develops primarily south of the Equator (0–10◦ S;             mean actual continuity at each location, as is evident from
Fig. 7e). We also note that the climatological vertical veloc-         the above analysis. To investigate continuity within the deep
ity in the western Pacific sector is essentially confined to the       ascending branch of the Hadley circulation from the upper
lower troposphere over the equatorial SH (10–0◦ S). This ob-           troposphere to the stratosphere in more detail, longitude–
                                                                       height sections of the normalized anomalous pressure ver-

Atmos. Chem. Phys., 19, 2655–2669, 2019                                                  www.atmos-chem-phys.net/19/2655/2019/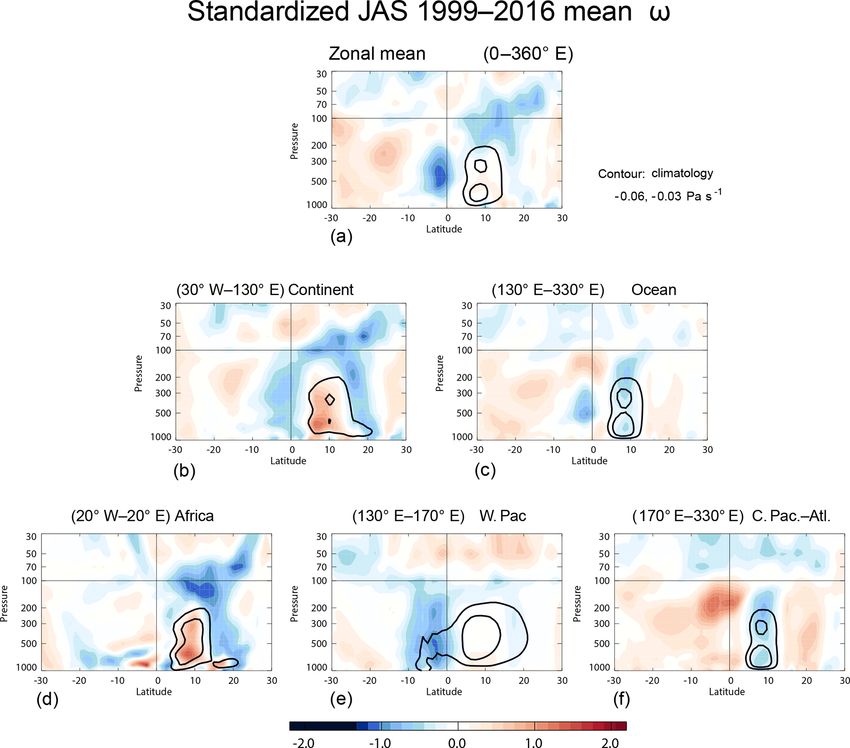
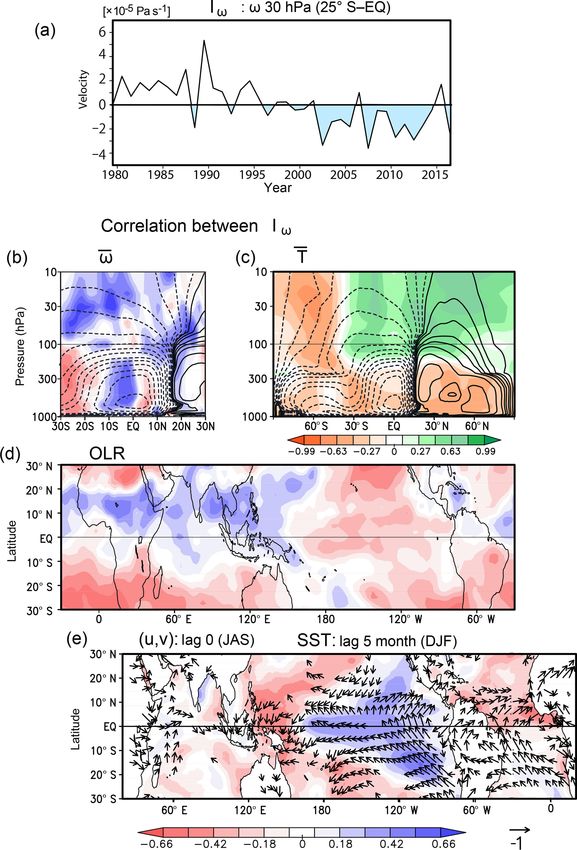
K. Kodera et al.: Stratospheric cooling trend and convection                                                                            2663

Figure 7. (a) Standardized anomalous pressure vertical velocity (departures from 1981–2010 climatology) – the climatological JAS mean
zonal-mean pressure vertical velocity is indicated by contours (−0.06 and −0.03 Pa s−1 ); (middle panels) same as (a) but for (b) the African–
Asian continental sector (30◦ W–130◦ E) and (c) the Pacific–Atlantic oceanic sector (130–330◦ E); (bottom panels) same as (a) but for
(d) the African continental sector (20◦ W–20◦ E), (e) the western Pacific sector (130–170◦ E), and (f) the central Pacific–Atlantic sector
(170–330◦ E).

tical velocities averaged over latitudes of 10–20◦ in the sum-           30 hPa averaged over the tropical SH (0–25◦ S) is chosen as
mer hemisphere are displayed in the top panels of Fig. 8a                the index of stratospheric mean meridional circulation (Iω ;
and b. The bottom panels show the distributions of climato-              Fig. 9a). The correlation coefficient between Iω and zonal-
logical (2007–2017) COV occurrence frequency in the same                 mean ω at each grid point (Fig. 9b) shows a correlation pat-
latitudinal zone. If a normal distribution is assumed, abso-             tern similar to the SVD 2 in Fig. 1. To highlight the rela-
lute values of 17-year mean standardized anomalies that are              tionship between the interannual variation and climatology,
larger than 0.5 are statistically different from 0 at the 95 %           the stream function from Fig. 3 is displayed as contours in
confidence level. An increasing trend in upwelling occurs                Fig. 9b and c. It is clearly seen that the variation in strato-
over the continental sector, particularly where COVs are fre-            spheric upwelling (Brewer–Dobson circulation) is connected
quent. These characteristics are commonly seen in both sum-              to the upwelling of the deep ascending branch of the Hadley
mer hemispheres. The contrast between the continental and                circulation, similar to that in climatology.
oceanic sectors is clearer in the SH (Fig. 8b) where the distri-            The correlation between Iω and zonal-mean temperature at
bution of land is simpler. Because COV occurs in deep con-               each grid point from 90◦ S to 90◦ N is shown in Fig. 9c. Trop-
vective clouds penetrating into the TTL beyond the level of              ical upwelling is not only related to cooling in the tropics and
neutral buoyancy, such increased vertical velocity in the TTL            the summer hemisphere but to warming in the downwelling
over the region of frequent COV seems reasonable. It should              region around the winter polar stratosphere. This suggests
also be noted that a connection between COV and vertical                 the dynamic nature of recent tropical stratospheric cooling.
velocity in the tropical lower stratosphere on a daily scale             Stratospheric upwelling is also connected with convective ac-
has been identified in previous studies (Eguchi et al., 2015;            tivity along 15–20◦ N (Fig. 9d), as discussed above. Correla-
Kodera et al., 2015).                                                    tion coefficients between Iω and 925 hPa zonal and merid-
   To investigate stratosphere-related variations in the tro-            ional winds at each grid point are shown as arrows in Fig. 9e.
posphere, the JAS mean pressure vertical velocity (ω) at                 An increase in cross-equatorial winds in the eastern Pacific

www.atmos-chem-phys.net/19/2655/2019/                                                       Atmos. Chem. Phys., 19, 2655–2669, 2019
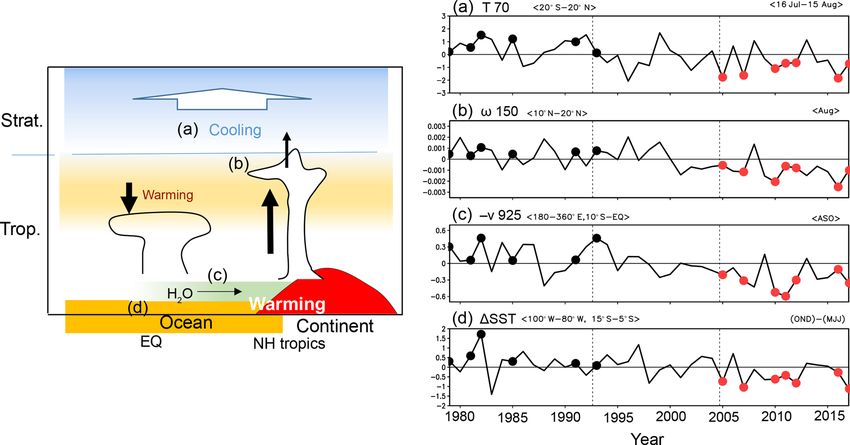
2664                                                              K. Kodera et al.: Stratospheric cooling trend and convection

Figure 8. (a) (top) Height–longitude section of the standardized (with respect to the interannual variation) anomalous pressure vertical
velocity averaged over 10–20◦ N during boreal summer (JAS) 1999–2016; (bottom) climatological (2007–2017) occurrence frequency of
convective overshooting (COV) in the same latitudinal zone (units of parts per thousand); (b) as in (a) but for 10–20◦ S during austral
summer (DJF).

and Atlantic is observed. The impact of near-surface wind             tendency of SST from early summer (May–July) to late au-
variations on SST can be seen in the lagged correlation with          tumn (October–December) in the tropical Pacific west of the
SST in Fig. 9e. Cooling in the equatorial eastern Pacific is          South American continent (15–5◦ S, 100–80◦ W). Time se-
largest with a time lag of 5 months (i.e., during December,           ries of these four variables (a–d) are displayed in Fig. 10
January, and February, DJF), consistent with the develop-             (right). When all four variables are negative (red dots), we
ment of La Niña-like SSTs during boreal autumn (Fig. 2).              define this as a negative event. Similarly, when all variables
   On the basis of the results presented in the previous sec-         are positive (black dots), it is defined as a positive event. All
tions we suggest the mechanism depicted in Fig. 10. (a) Cool-         six positive events occurred within the first 14 years, whereas
ing of the lower stratosphere occurred due to the direct ra-          all seven negative events occurred during the last 13 years.
diative effect and dynamic effect of the stratospheric mean           A chi-squared test was conducted to examine whether such
meridional circulation. (b) A decrease in the lower strato-           distributions of events can occur by chance, by dividing the
spheric temperature produced favorable conditions for the             whole 39 years into three equal 13-year periods. The result
development of extreme deep convection. A stratospheric               (χ 2 = 23) indicates that the probability of such distributions
cooling effect is felt by convections reaching the TTL, pri-          occurring by chance is less than 0.1 %. Therefore, there is a
marily over the continental sector. (c) An enhancement of             statistically significant trend towards negative events in re-
the extreme deep convection off-equatorial region produces            cent decades.
stronger cross-equatorial flow near the surface. (d) Strength-           However, the key question here is whether there is a causal
ening of surface winds cools the ocean through increased              relationship among the variables. We introduced a seasonal
evaporation.                                                          variation in the selection of the variable from the period of
   Accordingly, we selected four variables that can be con-           stratospheric cooling at the end of July and to the cooling of
sidered fundamental to the recent tropical trends: (a) tropical       the ocean from summer to autumn; that is, change in Pacific
lower stratospheric temperatures in early summer (tempera-            SST occurred following a change in cross-equatorial winds,
ture at 70 hPa averaged over 20◦ S–20◦ N at the bottom of the         increased upwelling in the TTL, and stratospheric cooling
TTL from 16 July to 16 August), (b) pressure vertical veloc-          in early summer. This time evolution tentatively suggests a
ity at the bottom of the TTL (150 hPa) in August, (c) August–         causality among the variables.
October mean southward winds south of the Equator (0–
10◦ S) in the western hemisphere (0–180◦ W), and (d) time

Atmos. Chem. Phys., 19, 2655–2669, 2019                                                 www.atmos-chem-phys.net/19/2655/2019/
K. Kodera et al.: Stratospheric cooling trend and convection                                                                            2665

Figure 9. (a) Time series of JAS mean pressure vertical velocity (ω) at 30 hPa averaged over 0–25◦ S as an index for tropical stratospheric
vertical velocity (Iω ); correlation coefficients between Iω and (b) zonal-mean ω, (c) zonal-mean temperature T at each grid, (d) OLR, and
(e) horizontal winds at 925 hPa (arrows). A lagged correlation with DJF mean SST is also presented by color shading in (e). Contours in (b, c)
indicate the climatological residual mean meridional circulation in JAS. Solid and dashed lines indicate clockwise and counterclockwise
directions, respectively.

4   Summary and discussion                                               trast, over the oceanic sector the decadal change manifested
                                                                         as changes in the spatial structure of the ENSO-related phe-
                                                                         nomenon (Fig. 4, SVD 1). It is suggested that the observed
Convective activity around the deep ascending branch of the              1999–2016 decadal SST cooling in the eastern Pacific is re-
boreal summer Hadley circulation (Fig. 3, SVD 2) shows an                lated to an increase in cross-equatorial winds and easterlies in
increasing trend over the continental sector (Fig. 4). In con-

www.atmos-chem-phys.net/19/2655/2019/                                                       Atmos. Chem. Phys., 19, 2655–2669, 2019
2666 K. Kodera et al.: Stratospheric cooling trend and convection Figure 10. On the left is a schematic of recent changes in the tropics (see text), in which the labels (a–d) indicate the location of the variable shown in the right panels; (right) time series of four key variables as departures from the climatology: (a) lower stratospheric temperature, (b) upwelling in the TTL, (c) cross-equatorial near-surface winds, and (d) time tendency of SST from summer to autumn. Black and red dots indicate years when the four variables are of the same polarity (positive and negative, respectively). the tropical SH, which are themselves related to a strengthen- al. (2017) showed that intense mesoscale convective systems ing of convective activity around the climatological deep as- in which cloud-top temperatures were lower than −70 ◦ C cending branch of the Hadley circulation during boreal sum- have largely increased over the Sahel since 1982. A tem- mer over the African–Asian sector (Fig. 2). In addition, a perature of −70 ◦ C corresponds to the air temperature at correlation analysis (Fig. 9) indicates that these variations ∼ 150 hPa. This means that extreme deep convection pene- in convective activity and SST are related to vertical veloc- trating into the TTL largely increased over the African con- ity near the tropopause. The relationship between convective tinent, consistent with the analysis presented here. activity and cooling of the tropical eastern Pacific can be ex- In the present study, a poleward shift in the convective plained through changes in cross-equatorial winds involved zone corresponds to enhanced convective activity in the deep in a wind–evaporation–SST (WES) feedback (Xie, 2004). ascending branch in the summertime Hadley circulation, lo- Accordingly, a combination of these two processes can be cated at a higher latitude (around 15◦ N) than the main as- used as a working hypothesis for the recent tropical changes, cending branch over the ocean (around 7.5◦ N). For the pur- as shown in Fig. 10. poses of this paper we assume that the changes that we It is difficult to statistically demonstrate a causal re- discuss are independent from those associated with tropical lationship among variables having large trends, such as expansion. This paper is based on the hypothesis that re- (a) lower stratospheric temperature, (b) upwelling in the cent increase in the convective activity in the deep branch TTL, (c) cross-equatorial near-surface winds, and (d) time of the Hadley circulation over the continental sector can be tendency of SST from boreal summer to autumn. Neverthe- considered independent of the shift in the ITCZ studied by less, time lags introduced in selected variables from sum- many other authors such as Schneider (2017) and Byrne et mer to autumn suggest that the above processes are related, al. (2018), who are primarily relevant to the oceanic sector. as shown schematically in the left panel of Fig. 10. Current The increasing trend in Earth’s surface temperature is gen- global models have difficulty accurately simulating the effect erally attributed to an increase in greenhouse gases, such as of extreme deep convection on the TTL. Suitably designed CO2 (IPCC, 2013). Such a change in radiative forcing may numerical experiments using global models with improved explain the global characteristics of recent changes. The ef- convective parameterizations will be needed to add further fect of increased CO2 can be divided into a direct radiative ef- support to these ideas. fect and an indirect effect through changes in SST. Model ex- Although their period of observation may be too short periments have shown that the direct radiative effect of CO2 (10 years of Atmospheric Infrared Sounder data), Aumann increases tropical upward motion, particularly over the Sahe- and Ruzmaikin (2013) reported that tropical deep convec- lian sector, whereas it suppresses upwelling over the oceanic tion over land shows an increasing trend, whereas that over sector in the Pacific (see Fig. 8 of Gaetani et al., 2016). An oceans shows a decreasing trend. Furthermore, Taylor et increase in CO2 raises the Earth’s surface temperature but Atmos. Chem. Phys., 19, 2655–2669, 2019 www.atmos-chem-phys.net/19/2655/2019/
K. Kodera et al.: Stratospheric cooling trend and convection                                                                         2667

decreases stratospheric temperatures. Note, however, that re-         References
cent cooling in the lower stratosphere–tropopause region is
also due to a dynamic effect (Abalos et al., 2015). Further in-       Abalos, M., Legras, B., Ploeger, F., and Randel, W. J.: Evaluat-
vestigation is needed to determine whether the stratosphere             ing the advective Brewer-Dobson circulation in three reanalyses
                                                                        for the period 1979–2012, J. Geophys. Res.-Atmos., 120, 7534–
is merely passively responding to or playing an active role
                                                                        7554, https://doi.org/10.1002/2015JD023182, 2015.
in tropospheric circulation change. Here we emphasized that           Adler, R. F., Huffman, G. J., Chang, A., Ferraro, R., Xie, P.,
stratospheric change should be considered together with tro-            Janowiak, J. E., Rudolf, B., Schneider, U., Curtis, S., Bolvin,
pospheric change.                                                       D. T., Gruber, A., Susskind, J., Arkin, P. A., and Nelkin, E. J.:
                                                                        The Version 2 Global Precipitation Climatology Project (GPCP)
                                                                        monthly precipitation analysis (1979–present), J. Hydrometeo-
Data availability. Datasets used in this paper are all publicly         rol., 4, 1147–1167, 2003.
available. Meteorological reanalysis datasets created by JMA          Allen, R. J., Norris, J. R., and Kovilakam, M.: Influence
(JRA-55) are available from http://search.diasjp.net/en/dataset/        of anthropogenic aerosols and the Pacific Decadal Oscil-
JRA55 (Kobayshi et al., 2015; last access: 15 February 2019).           lation on tropical belt width, Nat. Geosci., 7, 270–274,
The COBE monthly mean SST dataset can be obtained from                  https://doi.org/10.1038/ngeo2091, 2014.
the JMA website http://ds.data.jma.go.jp/tcc/tcc/products/elnino/     Aumann, H. H. and Ruzmaikin, A.: Frequency of deep convective
cobesst/cobe-sst.html (Ishii et al., 2013; last access: 15 Febru-       clouds in the tropical zone from 10 years of AIRS data, Atmos.
ary 2019). Monthly mean HIRS OLR data can be obtained                   Chem. Phys., 13, 10795–10806, https://doi.org/10.5194/acp-13-
from NOAA website https://www.ncdc.noaa.gov/cdr/atmospheric/            10795-2013, 2013.
outgoing-longwave-radiation-monthly (Lee and NOAA CDR Pro-            Amaya, D. J., Siler, N., Xie, S.-P., and Miller, A. J.: The interplay
gram, 2018; last access: 16 February 2019). The GPCP monthly            of internal and forced modes of Hadley Cell expansion: Lessons
mean precipitation dataset can be obtained from the NOAA website        from the global warming hiatus, Clim. Dynam., 51, 305–319,
https://www.esrl.noaa.gov/psd/data/gridded/data.gpcp.html (Adler        https://doi.org/10.1007/s00382-017-3921-5, 2018.
et al., 2003; last access: 16 February 2019). The AMSU/MHS data       Brandt, M., Mbow, C., Diouf, A. A., Verger, A., Samimi, C., and
are available at NOAA’s Comprehensive Large Array Data Stew-            Fensholt, R.: Ground and satellite based evidence of the biophys-
ardship System. In this work, AMSU/MHS raw data were ob-                ical mechanisms behind the greening Sahel, Glob. Change Biol.,
tained with support from the INSU-CNES French Mixed Service             21, 1–11, https://doi.org/10.1111/gcb.12807, 2014.
Unit ICARE/climserv/AERIS and accessed with the help of ES-           Byrne, M. P., Pendergrass, A. G., Rapp, A. D., and Wodzicki, K.
PRI/IPSL.                                                               R.: Response of the intertropical convergence zone to climate
                                                                        change: Location, width, and strength, Curr. Clim. Change Rep.,
                                                                        4, 355–370, https://doi.org/10.1007/s40641-018-0110-5, 2018.
Author contributions. The text was written by KK and RU, and the      Chiang, J. C. and Vimont, D. J: Analogous Pacific and Atlantic
figures were produced by NE, BMF, YK, and CK. CC contributed            meridional modes of tropical atmosphere–ocean variability, J.
to the interpretation of the results.                                   Climate, 17, 4143–4158, 2004.
                                                                      Davis, S. M. and Rosenlof, K. H.: A multidiagnostic intercompar-
                                                                        ison of tropical-width time series using reanalyses and satellite
Competing interests. The authors declare that they have no conflict     observations, J. Climate, 25, 1061–1078, 2012.
of interest.                                                          Diawara, A., Tachibana, Y., Oshima, K., Nishikawa, H., and Ando,
                                                                        Y.: Synchrony of trend shifts in Sahel boreal summer rainfall
                                                                        and global oceanic evaporation, 1950–2012, Hydrol. Earth Syst.
                                                                        Sci., 20, 3789–3798, https://doi.org/10.5194/hess-20-3789-2016,
Acknowledgements. The authors wish to express their thanks to
                                                                        2016.
Leonhard Pfister and Shigeo Yoden for valuable discussions and
                                                                      Dima, I. and Wallace, J. M.: On the seasonality of the Hadley Cell,
comments. This work was supported in part by Grants-in-Aid
                                                                        J. Atmos. Sci., 60, 1522–1527, 2003.
for Scientific Research (25340010, 26281016, and 16H01184)
                                                                      Dong, B. and Dai, A.: The influence of the interdecadal Pacific os-
from the Japan Society for the Promotion of Science. Preliminary
                                                                        cillation on temperature and precipitation over the globe, Clim.
analysis of this study was carried out using Interactive Tool
                                                                        Dynam., 45, 2667–2681, 2015.
for Analysis of Climate System, ITACS, provided by the Japan
                                                                      Eguchi, N., Kodera, K., and Nasuno, T.: A global non-hydrostatic
Meteorological Agency.
                                                                        model study of a downward coupling through the tropical
                                                                        tropopause layer during a stratospheric sudden warming, Atmos.
Edited by: Peter Haynes
                                                                        Chem. Phys., 15, 297–304, https://doi.org/10.5194/acp-15-297-
Reviewed by: two anonymous referees
                                                                        2015, 2015.
                                                                      Emanuel, K., Solomon, S., Folini, D., Davis, S., and Cagnazzo,
                                                                        C.: Influence of tropical tropopause layer cooling on
                                                                        Atlantic hurricane activity, J. Climate, 26, 2288–2301,
                                                                        https://doi.org/10.1175/JCLI-D-12-00242.1, 2013.
                                                                      England, M. H., McGregor, S., Spence, P., Meehl, G. A.,
                                                                        Timmermann, A., Cai, W., Gupta, A. S., McPhaden, M.
                                                                        J., Purich, A., and Santoso, A.: Recent intensification

www.atmos-chem-phys.net/19/2655/2019/                                                   Atmos. Chem. Phys., 19, 2655–2669, 2019
2668 K. Kodera et al.: Stratospheric cooling trend and convection
of wind-driven circulation in the Pacific and the on- Kao, H.-Y. and Yu, J.-Y.: Contrasting eastern-Pacific and
going warming hiatus, Nat. Clim. Change, 4, 222–227, central-Pacific types of ENSO, J. Climate, 22, 615– 632,
https://doi.org/10.1038/nclimate2106, 2014. https://doi.org/10.1175/2008JCLI2309.1, 2009.
Fontaine, B., Roucou, P., Gaetani, M., and Marteau, R.: Recent Kobayashi, C. and Iwasaki, T.: Brewer-Dobson circulation diag-
changes in precipitation, ITCZ convection and northern tropical nosed from JRA-55, J. Geophys. Res.-Atmos., 121, 1493–1510,
circulation over North Africa (1979–2007), Int. J. Climatol., 31, https://doi.org/10.1002/2015JD023476, 2016.
633–648, https://doi.org/10.1002/joc.2108, 2011. Kobayashi, S., Ota, Y., Harada, Y., Ebita, A., Moriya, M., Onoda,
Funatsu, B. M., Claud, C., Keckhut, P., Hauchecorne, A., and H., Onogi, K., Kamahori, H., Kobayashi, C., Endo, H., Miyaoka,
Leblanc, T.: Regional and seasonal stratospheric tempera- K., and Takahashi, K.: The JRA-55 Reanalysis: general specifi-
ture trends in the last decade (2002–2014) from AMSU cations and basic characteristics, J. Meteorol. Soc. Jpn., 93, 5–48,
observations, J. Geophys. Res.-Atmos., 121, 8172–8185, https://doi.org/10.2151/jmsj.2015-001, 2015.
https://doi.org/10.1002/2015JD024305, 2016. Kodera, K., Funatsu, B. M., Claud, C., and Eguchi, N.: The
Gaetani, M., Flamant, C., Bastin, S., Janicot, S., Lavaysse, C., role of convective overshooting clouds in tropical stratosphere–
Hourdin, F., Braconnot, P., and Bony, S.: West African mon- troposphere dynamical coupling, Atmos. Chem. Phys., 15, 6767–
soon dynamics and precipitation: the competition between global 6774, https://doi.org/10.5194/acp-15-6767-2015, 2015.
SST warming and CO2 increase in CMIP5 idealized simulations, Kosaka, Y. and Xie, S.-P.: Recent global-warming hiatus tied
Clim. Dynam., 48, 1353–1387, https://doi.org/10.1007/s00382- to equatorial Pacific surface cooling, Nature, 501, 403–407,
016-3146-z, 2016. https://doi.org/10.1038/nature12534, 2013.
Gautam, D. K. and Regmi, S. K.: Recent trends in the onset and Kuroda, Y.: An effective SVD calculation method for climate anal-
withdrawal of summer monsoon over Nepal, ECOPERSIA, 1, ysis, J. Meteorol. Soc. Jpn., 76, 647–655, 1998.
353–367, 2013. Lee, H., Gruber, A., Ellingson, R. G., and Laszlo, I.: De-
Hagos, S. M. and Cook, K. H.: Dynamics of the West velopment of the HIRS outgoing longwave radiation cli-
African monsoon jump, J. Climate, 20, 5264–5284, mate dataset, J. Atmos. Ocean. Tech., 24, 2029–2047,
https://doi.org/10.1175/2007JCLI1533.1, 2007. https://doi.org/10.1175/2007JTECHA989.1, 2007.
Hong, G., Heygster, G., Miao, J., and Kunzi, K.: Detection Lee, H.-T. and NOAA CDR Program: NOAA Climate Data Record
of tropical deep convective clouds from AMSU-B water va- (CDR) of Monthly Outgoing Longwave Radiation (OLR), Ver-
por channels measurements, J. Geophys. Res., 110, D05205, sion 2.7, NOAA National Centers for Environmental Informa-
https://doi.org/10.1029/2004JD004949, 2005. tion, https://doi.org/10.7289/V5W37TKD, 2018.
Hu, S. and Fedorov, A. V.: The extreme El Niño of 2015–2016 and Li, J., Wolf, W. W., Menzel, W. P., Zhang, W., Huang, H.,
the end of global warming hiatus, Geophys. Res. Lett., 44, 3816– and Achtor, T. H.: Global soundings of the atmosphere
3824, https://doi.org/10.1002/2017GL072908, 2017. from ATOVS measurements: The algorithm and validation, J.
Hu, Y., Huang, H., and Zhou, C.: Widening and weakening of the Appl. Meteorol., 39, 1248–1268, https://doi.org/10.1175/1520-
Hadley circulation under global warming, Sci. Bull., 63, 640– 0450(2000)0392.0.CO;2, 2000.
644, https://doi.org/10.1016/j.scib.2018.04.020, 2018. Liu, B. and Zhou, T., Atmospheric footprint of the re-
IPCC: Summary for Policymakers, in: Climate Change 2013: The cent warming slowdown, Scientific Reports, 7, 40947,
Physical Science Basis. Contribution of Working Group I to the https://doi.org/10.1038/srep40947, 2017.
Fifth Assessment Report of the Intergovernmental Panel on Cli- Liu, C. and Zipser, E. J.: Global distribution of convection pene-
mate Change, edited by: Stocker, T. F., Qin, D., Plattner, G.-K., trating the tropical tropopause, J. Geophys. Res., 110, D23104,
Tignor, M., Allen, S. K., Boschung, J., Nauels, A., Xia, Y., Bex, https://doi.org/10.1029/2005JD006063, 2005.
V., and Midgley, P. M., Cambridge University Press, Cambridge, Lucas, C., Timbal, B., and Nguyen, H.: The expanding
United Kingdom and New York, NY, USA, 2013. tropics: A critical assessment of the observational and
Ishii, M., Shouji, A., Sugimoto, S., and Matsumoto, T.: Objective modeling studies, WIREs Clim. Change, 5, 89–112,
analyses of sea-surface temperature and marine meteorological https://doi.org/10.1002/wcc.251, 2013.
variables for the 20th century using ICOADS and the KOBE col- Maidment, R. I., Allan, R. P., and Black, E.: Recent observed and
lection, Int. J. Climatol., 25, 865–879, 2005. simulated changes in precipitation over Africa, Geophys. Res.
Johnson, N. C.: How many ENSO flavors can we distinguish?, Lett., 42, 8155–8164, https://doi.org/10.1002/2015GL065765,
J. Climate, 26, 4816–4827, https://doi.org/10.1175/JCLI-D-12- 2015.
00649.1, 2013. Meehl, G. A., Hu, A., Arblaster, J. M., Fasullo, J., and Trenberth,
Kajikawa, Y., Yasunari, T., Yoshida, S., and Fujinami, H.: Advanced K. E.: Externally forced and internally generated decadal climate
Asian summer monsoon onset in recent decades, Geophys. Res. variability associated with the interdecadal Pacific oscillation,
Lett., 39, L03803, https://doi.org/10.1029/2011GL050540, 2012. J. Climate, 26, 7298–7310, https://doi.org/10.1175/JCLI-D-12-
Kamae, Y., Li, X., Xie, S.-P., and Ueda, H.: Atlantic effects on re- 00548.1, 2013.
cent decadal trends in global monsoon, Clim. Dynam., 49, 3443– Paek, H., Yu, J.-Y., and Qian, C.: Why were the 2015/2016 and
3455, https://doi.org/10.1007/s00382-017-3522-3, 2017. 1997/1998 extreme El Niños different?, Geophys. Res. Lett., 44,
Kang, S. M. and Polvani, L. M.: The interannual relationship be- 1848–1856, https://doi.org/10.1002/2016GL071515, 2017.
tween the latitude of the eddy-driven jet and the edge of the Ramsay, H.: The effects of imposed stratospheric cooling on
Hadley cell, J. Climate, 24, 564–568, 2011. the maximum intensity of tropical cyclones in axisymmetric
radiative–convective equilibrium, J. Climate, 26, 9977–9985,
https://doi.org/10.1175/JCLI-D-13-00195.1, 2013.
Atmos. Chem. Phys., 19, 2655–2669, 2019 www.atmos-chem-phys.net/19/2655/2019/You can also read