Implications of the 2010 Darfield (Christchurch, NZ) earthquake for Australia - are we ready?
←
→
Page content transcription
If your browser does not render page correctly, please read the page content below
Australian Earthquake Engineering Society 2010 Conference, Perth, Western Australia

  Implications of the 2010 Darfield (Christchurch, NZ)
       earthquake for Australia – are we ready?
                       Mike Griffith1, Jason Ingham2, Lisa Moon3

   1. Professor, School of Civil, Environmental and Mining Engineering, University
      of Adelaide, Australia, email: michael.griffith@adelaide.edu.au
   2. Assoc Professor, Department of Civil and Environmental Engineering,
      University of Auckland, New Zealand, email: j.ingham@auckland.ac.nz
   3. PhD candidate, School of Civil, Environmental and Mining Engineering,
      University of Adelaide, Australia, email: lmoon@civeng.adelaide.edu.au

ABSTRACT
The 2010 Darfield earthquake is the largest earthquake on record to have occurred
within 40 km of a major city and not cause any fatalities. In this paper the authors have
reflected on their experiences in Christchurch following the earthquake with a view to
what worked, what didn’t, and what lessons can be learned from this for the benefit of
Australian earthquake preparedness. Owing to the fact that most of the observed
building damage occurred in Unreinforced Masonry (URM) construction, this paper
focuses in particular on the authors’ experience conducting rapid building damage
assessment during the first 72 hours following the earthquake and more detailed
examination of the performance of unreinforced masonry buildings with and without
seismic retrofit interventions.

KEYWORDS
Unreinforced masonry, seismic retrofit, rapid damage assessment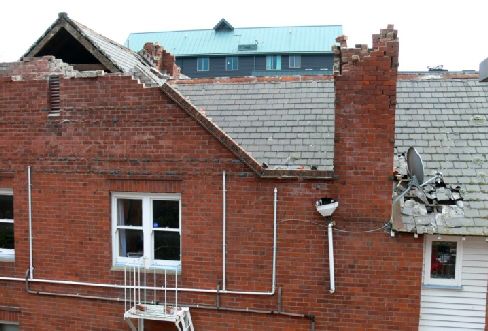
Australian Earthquake Engineering Society 2010 Conference, Perth, Western Australia

INTRODUCTION
At 4.35 am on the morning of Saturday the 4th of September 2010 a magnitude 7.1
earthquake occurred approximately 40 km west of the city of Christchurch NZ at a
depth of about 10 km (GNS 2010a), having an epicentre located near the town of
Darfield. The ground motion had a peak ground acceleration of about 0.25g and a
spectral acceleration in the plateau region of about 0.75g that corresponds well with the
design spectra for a site class D soil site in Christchurch for spectral periods greater than
0.2 seconds. In general, the earthquake represented 67-100% of the ULS design event
(Standards NZ 2004), depending upon the spectral period being considered (Figure 1),
with reported damage consistent with MM8 on the Modified Mercalli intensity scale
and it has been projected to be the 5th largest ever for insured losses (NZ Herald 2010).
                              1.0
                                                                      NZSEE Class D Deep or Soft Soil
                                                                      Median of Soft Soil Sites
                                                                                                                          N26W component – Cathedral College
                                                                      Botanical Gardens CBGS-H1                                        site
5% damped Response Spectrum

                              0.8                                     Botanical Gardens CBGS-H2
                                                                                                                          0.30

                                                                                                        Acceleration(g)
                                                                      Cathedral Collage CCCC-H1                                                                  N26W
                                                                      Cathedral Collage CCCC-H2                           0.15
       Acceleration (g)

                                                                      Hospital CHHC-H1
                              0.6                                                                                            0
                                                                      Hospital CHHC-H2

                                                                                                                          -0.15
                              0.4                                                                                         -0.30
                                                                                                                               0   10   20     30      40   50      60
                                                                                                                                             Time(s)

                              0.2                                                                         N64E component – Cathedral College site
                                                                                                                          0.30
                                                                                                        Acceleration(g)

                                                                                                                                                                 N64E
                                                                                                                          0.15
                               0
                                0       1       2                 3                 4                       5                0
                                                    Period T(s)
                                                                                                                          -0.15
                                                                                                                          -0.30
                                                                                                                               0   10   20     30      40   50          60
                                                                                                                                             Time(s)

                              (a) Acceleration spectra                    (b) Acceleration time-history record
                                      Figure 1. Details of earthquake ground motion (credit: GeoNet)

Immediately upon hearing news of the earthquake, the first two authors travelled to
Christchurch uncertain as to how but hoping they could help with the immediate
emergency response. In the end, their assistance was enthusiastically received and they
spent three days assisting Christchurch City Council with rapid building damage
assessment. Assisted by a team of PhD candidates from the Universities of Auckland
and Adelaide, the authors were also able to document damage to URM buildings and in
follow-up visits to further study some of the seismically retrofit URM buildings that
performed well during the earthquake. The following sections of this paper report on
the authors’ experience during their first visit while engaged in the rapid building
damage assessment phase of the emergency response, their observations of URM
building response, and some lessons for Australia.

RAPID BUILDING DAMAGE ASSESSMENT
In general, the observed damage to URM buildings in the 2010 Darfield Earthquake was
consistent with observed damage to URM buildings in past New Zealand and Australian
earthquakes (Davey and Blaikie 2010, Dowrick 1998, Page 1991) and in numerous
earthquakes from other countries. As part of the emergency response to this earthquake,
the authors spent 72 hours assisting Christchurch City Council with building damage
assessments, tagging buildings with either a green, yellow or red placard depending,
respectively, upon whether a building was safe for public use, had limited accessibility
for tenants/occupants, or was not accessible (refer to Figure 2). Each assessment team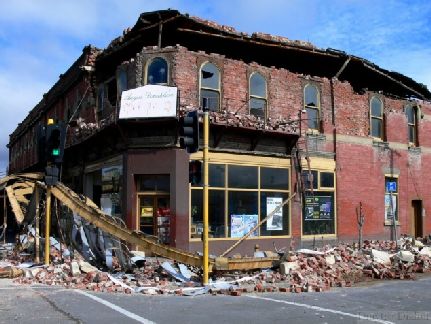
Australian Earthquake Engineering Society 2010 Conference, Perth, Western Australia

consisted nominally of a structural engineer, an emergency services technician
(normally a fire services employee), and a city council employee. On the first day, an
Urban Search and Rescue technician also accompanied each team. It took nearly three
days to assess all the buildings in the Christchurch CBD, although the task was
complicated by three magnitude 5+ aftershocks that occurred on the Monday
night/Tuesday morning which necessitated review of many buildings to determine
whether their status needed changing. Rapid building assessment was essential for the
city to reopen as much of the CBD as soon as possible and allow the recovery process to
commence. Many examples of earthquake damaged URM buildings were observed
during this exercise, as well as many examples of seismic retrofits to URM buildings
that had performed well.

                               Figure 2. Building assessment notices.

The results from the interrogation of damage assessment information are reported in
Figure 3. Figure 3a reports the ‘useability’ assignment of the 595 URM buildings
assessed. Figure 3b reports the level of damage for the same URM buildings. Despite
the known vulnerability of URM buildings to earthquake loading, only 34% of the 595
                                                                           Other      Public Religious
assessed URM buildings were judged to have more than 10% damage.         residential assembly   2%
                                                        Red                                                    7%       5%
            Red                                         13%
            21%                                                                                               Other
                                                                                             Industrial        3%
                                                                                                2%
                                                                                                    Heritage
                                               Yellow                                                Listed
                                                17%                                                    3%
                                     Green
                                      47%
                                                                                                  Dwelling
                                                                                                   11%

                                                                            Green                         Commercial
        Yellow                                                               70%                            / Offices
         32%                                                                                                   67%

        (a) placard
    (a) Placards       distribution
                 Assigned to URM buildings (b)(b)URM
                                                 Placardsbuilding
                                                          Assigned todamage     statistics
                                                                       URM buildings                          (c) Breakdown of Storey Height
    (Neglecting none and blank)               (Considering none and
                                     Figure 3. Damage statistics.    blank as green)

URM BUILDING RESPONSE
The architectural features of the URM building stock in the Canterbury region are
consistent with the general form of URM buildings throughout both New Zealand and
Australia (Russell and Ingham 2008; 2010). These buildings can be characterised as
typically 2 or 3 stories in height, with 2 storey buildings being most common, and being
either stand alone or row buildings, but with row buildings being most common (refer
Figure 4). The most common occupancy type for the 595 URM buildings assessed was
‘commercial’ or ‘office buildings’, hence the majority of buildings were unoccupied at
the time of the earthquake, significantly contributing to the lack of earthquake fatalities.
A brief summary of the typical failure mechanisms are presented here. For a more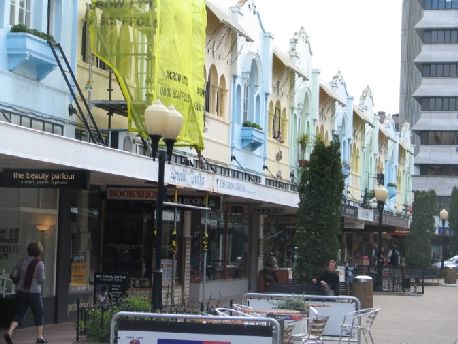
Australian Earthquake Engineering Society 2010 Conference, Perth, Western Australia

complete discussion of the behaviour of URM buildings during the 2010 Darfield
earthquake, refer to Ingham and Griffith (2010).

           Figure 4. Typical 2- and 3-storey URM buildings in Christchurch.

Material Properties
The general observation from the debris of collapsed URM walls was that the kiln fired
clay bricks were generally of sound condition, but that the mortar was in poor condition.
In most cases the fallen debris had collapsed into individual bricks, rather than as larger
chunks of masonry debris and the mortar readily crumbled when subjected to finger
pressure (refer Figure 5). However, it appears that superior mortar was often used in the
ornate parapet above the centre of the wall facing the street, as this segment of the
collapsed parapet often remained intact as it collapsed.

     (a) relatively ‘clean’ bricks        (b) weak mortar crumbles between fingers
                      Figure 5. Masonry rubble from collapsed wall.

Chimneys
Unsupported or unreinforced brick chimneys performed poorly in the earthquake
(Figure 6), with numerous chimney collapses occurring in domestic as well as small
commercial buildings and churches. Many examples of badly damaged chimneys that
were precariously balanced on rooftops were also seen (Figure 6b) and it was reported
that one week after the earthquake, 14,000 insurance claims involving chimney damage
had been received, from a total of 50,000 claims (NewstalkZB 2010). Removal of
damaged chimneys to minimise further risk placed significant demand on emergency
services personnel (Figure 6c). In contrast, Figure 6d shows an example of a braced
chimney that performed well.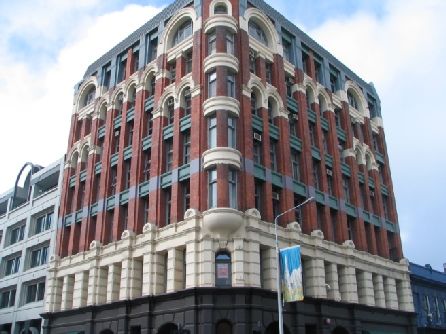
Australian Earthquake Engineering Society 2010 Conference, Perth, Western Australia

  (a) Two damaged chimneys and gable wall.                (b) Unstable damaged chimney

   (c) Emergency services remove chimney.         (d) Braced chimney performed well
     Figure 6. Examples of chimney performance during the Darfield earthquake.
Gable end wall failures
Many gable end failures were observed, often collapsing onto or through the roof of an
adjacent building as seen in Figure 7. However, there were also many gable ends that
survived; many more than might have been expected, with the majority having some
form of visible restraints that tied back to the roof structure. These examples are shown
and discussed later (refer Figures 15-17).

              (a) 93 Manchester St                         (b) 816 Colombo St
                     Figure 7. Examples of gable end wall failures.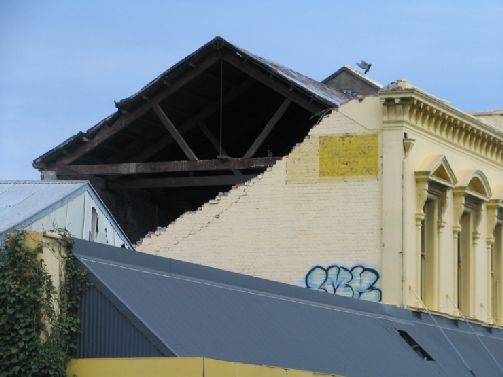
Australian Earthquake Engineering Society 2010 Conference, Perth, Western Australia

Parapet failures
Numerous parapet failures were observed along building frontages and along their side
walls, and for several URM buildings located on corners, the parapets collapsed on both
perpendicular walls (refer Figure 8). Restraint of URM parapets against lateral loads
has routinely been implemented in New Zealand since the 1940s, so whilst it is difficult
to see these restraints unless roof access is available, it is believed that the majority of
parapets that exhibited no damage in the earthquake were provided with suitable lateral
restraint. In several cases, it appears that parapets were braced back to the
perpendicular parapet, which proved unsuccessful.

  (a) Multiple front wall parapet failures   (b) Corner of Sandyford and Colombo St.
                     Figure 8. Examples of typical parapet failures.

Anchorage failures
Falling parapets typically landed on awnings which overloaded the awning tie rods
causing collapse (Figure 8). Most awning supports comprised a tension rod tied back
into the building through the front wall of the building. In most cases the force on the
rod exceeded the capacity of the masonry wall anchorage, causing a punching shear
failure in the masonry wall identified by a crater in the masonry (refer Figure 8a).

Wall failures
Out-of-plane wall failures were typically the result of poor or no anchorage of the wall
to its supporting timber (floor or roof) diaphragm. Several examples of wall failure are
shown below. Figure 9(a) shows a corner building that had walls fail in the out-of-plane
direction along both directions. Figure 9(b) shows a 3-storey building where walls in
the upper two stories suffered out-of-plane failures. In both of these instances, it
appears that the walls were not carrying significant vertical gravity loads, other than
their self weight, since the remaining roof structures appear to be largely undamaged.

Cavity wall construction is generally believed to be much less common in New Zealand
than is solid multi-leaf (or multi-wythe) construction. However, cavity wall
construction can be extremely vulnerable to out of plane failure in earthquakes in
situations where the cavity ties were poorly installed, or more commonly have corroded
over time, as the wall is then comparatively slender and less stable than for solid
construction. Figure 10 shows examples of cavity wall buildings that suffered out-of-
plane wall failures. In most cases, cavity ties were present but were insufficient to
prevent the outer leaf from failing.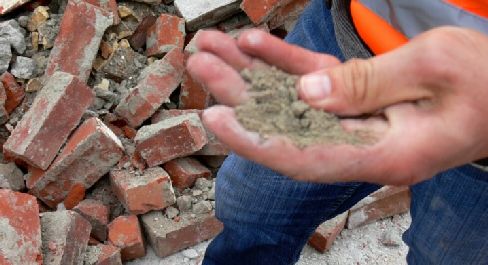
Australian Earthquake Engineering Society 2010 Conference, Perth, Western Australia

 (a) Corner Worcester and Manchester St.             (b) 118 Manchester Street
          Figure 9. Examples of out-of-plane failures in solid masonry walls.

In some cases wall-diaphragm anchors remained visible in the diaphragm after the wall
had failed, again indicating that failure had occurred due to bed joint shear in the
masonry (refer Figure 11). Figure 11(b) shows a situation where a diaphragm anchor
had been embedded within the wall. It can be seen that the anchor successfully
prevented the restrained wall from failing, but was not able to prevent toppling of the
masonry above the anchor.

             Figure 10. Examples of out-of-plane failures in cavity walls.

   (a) Gable wall failure despite anchor       (b) Wall anchor still intact
                     Figure 11. Wall-to-diaphragm anchor details.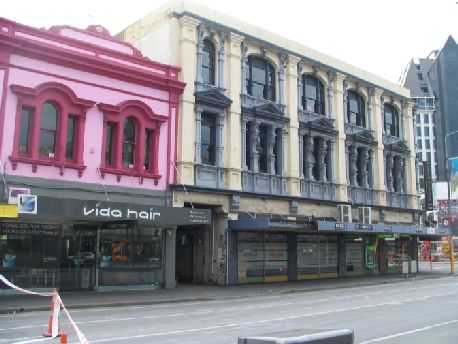
Australian Earthquake Engineering Society 2010 Conference, Perth, Western Australia
Return wall separation
Many buildings exhibited substantial cracking between their front wall and side (return)
walls. This damage is not necessarily a catastrophic problem if stiff horizontal
diaphragms are well connected to the walls in both directions, but where there is not
good diaphragm connectivity, there is the potential for complete out-of-plane collapse
of one or both walls. Figure 12 shows some examples where major cracking was
observed between the side return walls and the front parapet and wall without collapse.
Other mechanisms
Several walls exhibited some damage to in-plane deformation where the cracks were
mostly seen to pass vertically through the lintels over door or window openings. There
were also several examples of URM buildings with different storey heights ‘pounding’
against each other. However, these mechanisms were not widely observed.
Figure 12. Examples of wall separation at corners of buildings.
Special buildings
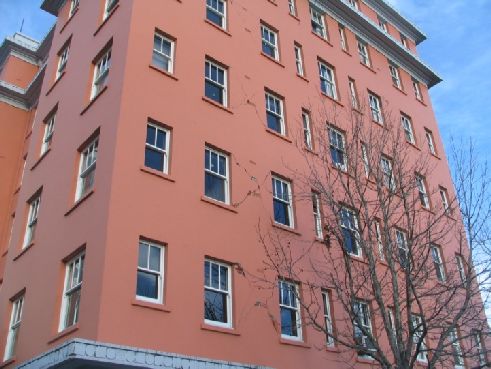
160 Manchester Street is a 7-storey, heritage listed (NZ Historic Places Trust 2010),
URM office building that was built in 1905 (Figure 13). The building suffered
significant damage to its masonry piers at levels 3 and 4. After much debate, the city
council gave approval to demolish the building as it poses a significant falling hazard to
the dozen or so businesses and buildings within the 70 m radius ‘fall zone’.
(a) Overview of building (b) North wall pier, level 3.
Figure 13. Manchester Courts building.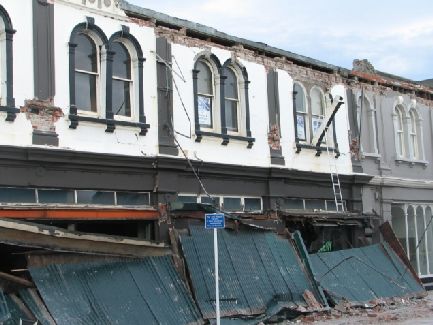
Australian Earthquake Engineering Society 2010 Conference, Perth, Western Australia

St Elmo Chambers is also a 7-storey building, reported to be a reinforced concrete
frame building with external clay brick masonry piers. Owing to the absence of control
joints between the masonry and concrete frame, the masonry piers attracted sufficient
seismic in-plane forces to cause shear failure (refer Figure 14). Judging by the extent of
cracking in the brickwork, it appears that the storey drifts were less than 1%, implying
that the concrete frame was not pushed to its maximum capacity (strength or drift).

             (a) Overview of building                    (b) damaged brickwork
          Figure 14. Views of St Elmo Chambers building in Montreal Street.

SEISMIC RETROFIT EXAMPLES
Because of the high level of earthquake hazard in New Zealand, the country has
required URM buildings to be seismically assessed and retrofit where necessary.
Consequently there are many examples of seismic retrofit interventions on URM
buildings in Christchurch that were successful. A selection of these are reported in
detail in Dizhur et al (2010). In the following section of this paper, examples of some
of the most commonly observed schemes are described.

Successful wall anchorage
A significant feature of the earthquake was the number of occasions where wall-to-
diaphram (floor or roof) anchors performed well. Photographs showing this are
presented in Figures 15-16. A typical wall-to-diaphragm anchor typically consists of a
long 20 mm bolt with a large circular disk of about 150-200 mm diameter between the
wall exterior and nut that clamped the disk to the wall.

            Figure 15. Successful gable end wall and side wall anchorages.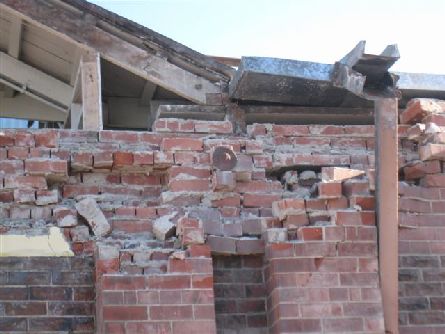
Australian Earthquake Engineering Society 2010 Conference, Perth, Western Australia

         Figure 16. Successful wall-floor and wall-roof diaphragm anchorages.

Another interesting feature of this earthquake is the observation of walls that only partly
failed, allowing for identification of the specific failure mode at its onset. An excellent
example is a 2-storey URM building on Ferry Road (see Figure 17) where the front,
street facing, wall of the building had started to fail out-of-plane despite the presence of
wall-roof diaphragm anchors. As shown, the anchors were on the verge of pulling
through the masonry wall. Internal inspection of the building revealed that the front
wall had separated from the long side walls of the building and moved approximately
50 mm towards the road with respect to the ceiling/roof diaphragm.

          (a) Building overview                (b) Detail of partial anchorage failure
                    Figure 17. Onset of wall-roof anchorage failure.

Diaphragm stiffening
Diaphragm stiffness has a significant effect on the behaviour of a building during
earthquakes, as observed at the Malthouse Theatre (Figure 18). Prior to the earthquake,
the stone masonry building from 1867 underwent an extensive seismic retrofit involving
stiffening of floor and roof diaphragms and connecting it to the external walls.

      Figure 18 – Malthouse Theatre                  Figure 19 – Steel frame in roof
Australian Earthquake Engineering Society 2010 Conference, Perth, Western Australia
The roof diaphragm was stiffened through the addition of an internal steel frame (Figure
19). The frame was attached to the original timber roof trusses, and connected to the
external walls. The floors were stiffened through the addition of blocking between
joists (Figure 20a), and steel plates were added to connect some of the joists to the
masonry walls (Figure 20b). Externally, diaphragm ties were visible on all sides at floor
levels indicating that the floors had been anchored to the walls (Figure 20c).
(c) diaphragm anchors –
(a) blocking of joists (b) joist-wall connection external view
Figure 20 – strengthening of floor diaphragm and wall anchors
Corner Connectors
In some buildings steel plates were observed connecting the front and side walls. Such
ties prevent building facades collapsing as well as increasing the in plane and out of
plane capacity of both walls. While it is not clear whether the two examples shown in
Figure 21 were installed before or after the recent earthquake, the technique has the
potential to improve the seismic performance of the buildings by ensuring greater
interaction between return walls.
Figure 21 – Examples of corner ties
Lessons for Australia
Given the similarity in pre-1950 constructed URM buildings in Australia and New
Zealand, there are some valuable lessons for Australia in what transpired inAustralian Earthquake Engineering Society 2010 Conference, Perth, Western Australia
Christchurch during and immediately after the 4 September 2010 Darfield earthquake.
Some of these observations are listed here.
USAR support - Within 1 hour the Christchurch-based USAR Task Force had
mobilised and within 24 hours had verified that nobody was left trapped in any
of the collapsed or partially collapsed buildings within the earthquake affected
region. The Auckland and Palmerston North/Wellington USAR Task Forces
were mostly on the ground assisting within 12 hours of the event and over the
next two weeks 145 USAR Task Force members were activated. In addition,
thirteen USAR Engineers had responded to the crisis by Saturday evening and
over the following two weeks worked 60 person days assisting the three NZ
USAR Task Forces to secure unsafe structures.
In addition to USAR, the emergency services personnel (eg, fire, police,
ambulance) and city officials were well prepared, knew what to do and how to
do it. By Sunday morning, barely 24 hours after the earthquake, disaster
management officials had set up the incident command centre in the City’s new
Art Gallery building, had allocated appropriately qualified and attired volunteers
to rapid building damage assessment teams and were briefing the teams on their
assignments, protocols, and agreed safety procedures.
Significantly, the Christchurch City local government had no state or provincial
government to liaise with, they dealt directly with the national government and
disaster managers. This interaction appears to have gone off quite smoothly and
effectively. Will Australia’s extra tier of government allow such efficient
mobilisation of resources such as inter-state USAR team assistance?
All the paperwork (eg, assessment forms and building assessment placards) was
ready to go. Would anyone in your local council, or state, know where to find a
rapid building damage assessment form?
The NZSEE/IPENZ/CPEng structural engineers were knowledgeable and
sufficient numbers were available as volunteers for damage assessment from day
one to enable all buildings in the CBD to be covered within 48 hours. Are
sufficient numbers of suitably qualified structural engineers available in most
Australian cities?
As noted earlier, the earthquake occurred early in the morning so most of the
worst damaged buildings had no occupants. Hence, there were no lives lost as a
direct consequence of the earthquake – an amazing statistic given the
earthquake’s size and proximity to Christchurch. Nevertheless, had this
occurred during business hours the storey would have been dramatically
different.
Strong government policy to seismically ‘strengthen’ earthquake prone
buildings. This is evidenced by policies at both the local and national level
(Christchurch City Council 2010, NZ Parliament 2004, NZSEE 2006). This has
ensured a relatively widespread take-up of seismic retrofit for URM buildings.
This clearly has not occurred in Australia to the degree that it has in NZ.
As noted earlier in the paper, there were many examples of retrofit schemes that
worked – diaphragm stiffening, wall-to-diaphragm connections, chimney and
parapet tie-backs. The most common forms of damage involved out-of-plane
failure mechanisms in URM buildings and chimneys in all forms of
construction.Australian Earthquake Engineering Society 2010 Conference, Perth, Western Australia
Besides helping to minimise structural damage, seismic retrofit had the benefits
of reducing damage to stock and minimising business interruption costs. It is
expected that for many businesses the interruption to income, damage to
premises and loss of stock associated with the earthquake will be significant.
With the evolution of new materials and the development of new, alternative
retrofit techniques, many more (NZ) building owners will be undertaking
seismic retrofit in the near future. How about in Australia?
Notwithstanding all of the ‘successes’ observed by the authors, there were a number of
‘problems’, or areas, where the emergency response could be further improved.
Getting consistency between the many damage assessment teams is a challenge.
Managers must make it clear whether they want the teams to be assessing risk
with regard to the usual ‘design magnitude earthquake’ for ultimate limit
strength design or only for the anticipated aftershock magnitude events.
It was also unclear as to how to assign damage ratios – some examples could
have been useful and would have helped with consistency.
Management of the ‘data’ collected on assessment forms and communicating
that information back to the teams (through daily briefing sessions?) could help
reduce confusion in the field where it was observed that some teams were
duplicating assessments of other teams. Interfacing the assessment data with
other council databases such as “where the URM buildings were located’ and
‘which URM buildings have been retrofit’ could be done to target stretched
resources to the most likely to be damaged structures first.
On balance, the local Christchurch and National Disaster Management Teams did an
outstanding job in coordinating the formal emergency services capability as well as
substantial volunteer manpower to respond quickly and effectively to the earthquake.
Australia should take every opportunity to learn from this event and ensure that when a
major Australian city is struck by a similar size earthquake that we can respond and
recover as well as Christchurch.
Acknowledgements
Rodney Henderson-Fitzgerald, a data analyst for Christchurch City Council, is thanked
for his assistance with securing the building inspection data reported herein. Lisa Moon
and Najif Ismail are thanked for their analysis and graphing of the building damage
statistics. Dmytro Dizhur, Yi-Wei Lin, Alistair Russell, Charlotte Knox and Claudio
Oyarzo-Vera are thanked for supplying some of the photographs that have been used
herein.
References
Christchurch City Council (2010). ‘Review of earthquake-prone, dangerous and
insanitary buildings policy’,
http://www1.ccc.govt.nz/Council/agendas/2010/March/RegulatoryPlanning4th/4.
Earthquake.pdf, 4 March 2010; Retrieved 20 Sept 2010.
Davey, R. A., and Blaikie, E. L. (2010). ‘Predicted and observed performance of
masonry parapets in the 2007 Gisborne earthquake’, 2010 Annual Conference ofAustralian Earthquake Engineering Society 2010 Conference, Perth, Western Australia
the New Zealand Society for Earthquake Engineering, Wellington, March 26-28;
http://db.nzsee.org.nz/2010/Paper07.pdf
Dowrick, D. (1998). ‘Damage and Intensities in the Magnitude 7.8 1931 Hawke's Bay,
New Zealand, Earthquake’. Bulletin of the New Zealand Society for Earthquake
Engineering, 30(2), 133-158.
Dizhur, D., Ismail, N., Knox, C., Lumantarna, R. and Ingham, J.M. (accepted 1/11/10).
“Performance of unreinforced and retrofitted masonry buildings during the 2010
Darfield earthquake,” Bulletin of the New Zealand Earthquake Engineering
Society.
GNS (2010a). ‘Darfield earthquake damages Canterbury’,
http://www.geonet.org.nz/news/article-sep-4-2010-christchurch-earthquake.html,
16 Sept 2010; Retrieved 16 Sept 2010.
Ingham, J.M. and Griffith, M.C. (accepted 4/10/10). “Performance of unreinforced
masonry buildings during the 2010 Darfield (Christchurch, NZ) earthquake,”
Australian Journal of Structural Engineering, Engineers Australia.
New Zealand Historic Places Trust (2010). ‘Manchester Courts’,
http://www.historic.org.nz/TheRegister/RegisterSearch/RegisterResults.aspx?RID
=5307; Retrieved 9 Sept 2010.
New Zealand Parliament. (2004). Building Act 2004, Department of Building and
Housing - Te Tari Kaupapa Whare, Ministry of Economic Development, New
Zealand Government, Wellington, New Zealand, Date of assent: 24 August 2004.
NewstalkZB (2010). ‘Most damage claims over $10k’,
http://www.newstalkzb.co.nz/newsdetail1.asp?storyid=182291, 13 Sept 2010;
Retrieved 13 Sept 2010.
NZ Hearald (2010). “Christchurch quake ‘5th most expensive ever’,” NZ Herald,
http://www.nzherald.co.nz/business/news/article.cfm?c_id=3&objectid=10673931
, 16 Sept 2010, retrieved 4 November 2010.
NZSEE. (2006). ‘Assessment and Improvement of the Structural Performance of
Buildings in Earthquakes’. Recommendations of a NZSEE Study Group on
Earthquake Risk Buildings, New Zealand Society for Earthquake Engineering.
Page, A. (1991). ‘The Newcastle earthquake – behaviour of masonry structures’.
Masonry International, Journal of the British Masonry Society, 5(1): 11-18.
Russell, A. P., and Ingham, J. M. (2008). ‘Architectural Trends in the Characterisation
of Unreinforced Masonry in New Zealand’, 14th International Brick and Block
Masonry Conference (14IBMAC), Sydney, Australia. 17 - 20 February.
Russell, A.P. and Ingham, J.M. (2010). “Prevalence of New Zealand's Unreinforced
Masonry Buildings,” Bulletin of the New Zealand Society for Earthquake
Engineering, 43(3): 182-201.
Standards New Zealand. (2004). "NZS 1170.5:2004, Structural Design Actions Part
5:Earthquake actions – New Zealand." Wellington, New Zealand.You can also read