Improving energy performance of a Cement Manufacturing factory by using Waste Heat Recovery Systems, Estimated vs. Actual achievements
←
→
Page content transcription
If your browser does not render page correctly, please read the page content below
E3S Web of Conferences 286, 01007 (2021) https://doi.org/10.1051/e3sconf/202128601007
TE-RE-RD 2021

 Improving energy performance of a Cement
 Manufacturing factory by using Waste Heat
 Recovery Systems, Estimated vs. Actual
 achievements
 Mircea Scripcariu1, Cristian Gheorghiu2, Miruna Gheorghiu3 and Alexandra Gabriela
 Dobrica4*
 1
 University Politehnica of Bucharest, Energy Production and Use Department, 313 Splaiul
 Independentei, Bucharest, Romania
 2
 University Politehnica of Bucharest, Energy Production and Use Department, 313 Splaiul
 Independentei, Bucharest, Romania
 3
 ELSACO ESCO L.L.C.,500 Mihai Bravu, Bucharest, Romania
 4
 University Politehnica of Bucharest, Energy Production and Use Department, 313 Splaiul
 Independentei, Bucharest, Romania

 Abstract. Waste Heat Recovery (WHR) Systems are spreading more and
 more in cement factories and are essential in achieving the energy
 performance required by the European Directives, legislation, and
 standards. Using WHR Systems may assure an important percentage of
 the energy required by the manufacturing process, with no additional fuel
 and no additional greenhouse gas emissions. Using the waste heat as a
 power generation source, increases the energy efficiency of the process
 and decreases the thermal energy losses. As long as the kiln is functional,
 so is the WHR powerplant, generating the energy in an efficient
 manufacturing process with low operational costs and increased
 reliability. This paper aims at evaluating the actual technic and economic
 performance of a WHR System compared to the estimated performance
 determined in the feasibility study which was done prior to the investment
 in order to prove the viability of the technology in the cement
 manufacturing industrial sector. The paper proves that the WHR proved
 to be financially inefficient if the feasibility study input data was
 considered and correlated with the actual technical performance but lead
 to extremely attractive financial indicators when considering actual,
 updated capital expenditures and operational expenditures and technical
 performance.

 1 Introduction
 Currently there are numerous technical solutions available for a cement factory which can
 reduce the carbon footprint and improve the energy performance of the process. Using the
 best available technology may increase the energy performance of the process but, a high
 amount of energy is still demanded by the process. In 2020, the largest cement
 *
 Corresponding author: alexandra.dobrica3@gmail.com

© The Authors, published by EDP Sciences. This is an open access article distributed under the terms of the Creative Commons
Attribution License 4.0 (http://creativecommons.org/licenses/by/4.0/).
E3S Web of Conferences 286, 01007 (2021) https://doi.org/10.1051/e3sconf/202128601007
TE-RE-RD 2021

 nufacturer worldwide reported a total energy consumption of 528 million of GJ. Fig. 1
 manufacturer
 shows the amount of thermal energy and electricity demand [1]. The purpose of the Organic
 Rankine Cycle System is to reduce the costs of energy extracted from the national electric
 power grid by having a reliable power source on on-site. The first 1.5 MW ORC system was
 installed in Lengfurt in 1999 [2]. Since then, the technology had been used in many cement
 factories from 49 countries having 402 plants operating in 2021.
 The cement manufacturers focused their attention on ORC technology because it has
 proven its energy performance and it has reduced the high amount of greenhouse gas
 emissions generated by this industry.

 Electricity
 12% Thermal
 Energy

 Fig. 1. Thermal energy and electricity use reported by the biggest cement manufacturer.

 The cement industry has a significant environmental footprint due to the high amount of
 thermal energy required by the process, mainly coming from the burning of traditional
 fuels. In the last 25 years, the CO2 emissions produced by the cement ind industry increased
 drastically, from 27 Gt in 2006 to 32 Gt in 2020. Without a sustainable strategy to reduce
 the greenhouse gas emissions, the quantity of CO2 could achieve over 36 Gt after 2022, as
 shown in the Figure 2 [3]. 50% of CO2 emissions are produced during the calcination
 process, in which the limestone is transformed into lime as an outcome of a chemical
 reaction [3].. About 40% of the total quantity of CO2 are produced as a result of the burning
 processes required to achieve the 1,450 ˚C temperature of clinkerization. The rest of 10% of
 the greenhouse gas emissions are the result of electricity needed to run the plant [3]. To
 reach the target proposed by the Green Deal, a carbon neutral Europe by 2050 and reduce
 the CO2 emissions ns in the cement sector with 30% by 2030, the industry has the opportunity
 to invest in kiln upgrades and waste heat recovery using ORC ssystems [4].

 Fig. 2. Total energy related to CO2 emissions with and without a sustainable recovery, 2005
 2005-2023 [3].

 2 From Waste Heat to Power
 In 2011,, the first ORC system in Romania was operational. The system was installed on a
 4,300
 300 t/day rotary kiln. The ORC system has an installed power of 4.1 MW. In the first
 phase of the project, many key factors were taken into account, such as: temperatures from
 the process, waste heat energy potential, the working fluid, time allocated for the kiln
 inspection etc. [6]. Temperature is a high importance factor for the system because it has an
 influence on the power plant design, materials, heat exchangers for the system [7], and on

 2
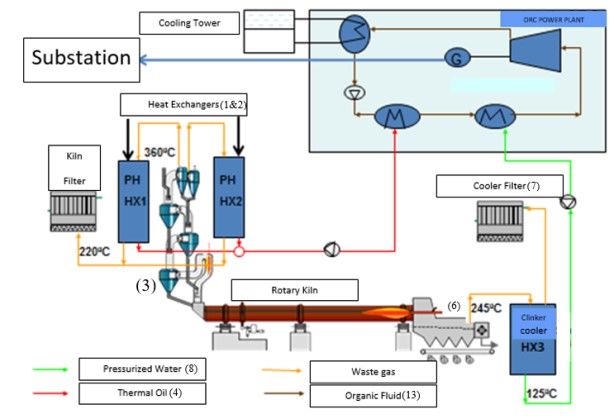
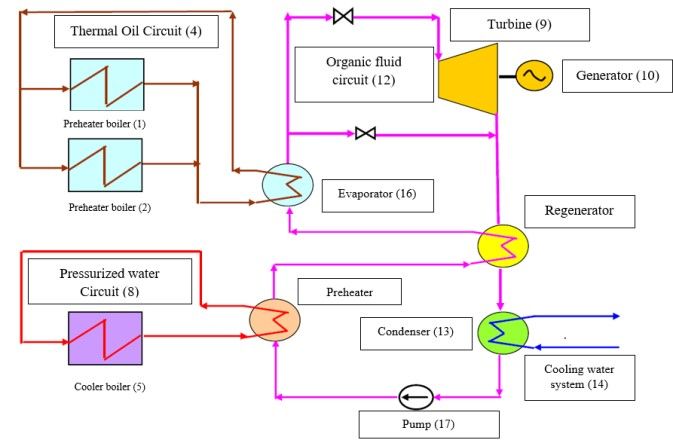
E3S Web of Conferences 286, 01007 (2021) https://doi.org/10.1051/e3sconf/202128601007
TE-RE-RD 2021

 the energy potential of the waste heat source. The main advantage of the system is its
 capacity to operate at relatively low temperatures of steam in comparison with the
 conventional steam cycle. The temperature at the preheater outlet is 360 ˚C, while at the
 clinker cooler the temperature is lower, the average temperature is around 250 ˚C, as shown
 in Figure 3.

 (1&2)

 (7)

 (3)
 Fig. 3. Waste Heat Sources for ORC system (6)

 The thermodynamic circuit is described in Figure 4. The preheater boilers (1 and 2) of the
 (8)
 ORC system are extracting the waste gas after the superior stage cyclones (3), returning it
 (4)
 before the fans after the gas has transferred the heat to the heat to the thermal oil (4) used as
 (13)

 working fluid, while the clinker cooler boiler (5) is installed between clinker cooler (6) and
 the filter (7). The heat from the main heat exchanger from the kiln is extracted with two
 horizontal cross flow boilers (1 and 2), using thermal oil as heat transfer fluid and one
 vertical gas flow boiler with dust settling chamber, using pressurized water as heat transfer
 fluid (8). By using pressurized water, the boiler’s “capacity” decreased with 20%. This
 combined solution of having thermal oil in the preheater boilers and hot pressurized water
 in the clinker cooler boiler as working fluids is a new technical solution for the ORC
 systems in the cement industry [7]. The ORC unit uses the working fluids to pre-heat and
 vaporize the organic working fluid in the evaporator. The organic fluid vapor powers the
 turbine (9), which is directly coupled to the electric generator (10), generating electricity.
 The exhaust vapor flows through the regenerator (11) where it preheats the organic liquid
 (12). The vapor is then condensed in the condenser (13) which has a water-cooling system
 (14). In the last transformation of the organic cycle, the organic fluid is pumped in the
 regenerator (15) and then to the evaporator (16).
 During the estimation phase of the ORC project, some assumptions were made in order to
 investigate the performance of the system. To estimate the available heat for the plant, a
 production rate of 3,800 t/day and an average heat consumption during normal operation of
 3,396 MJ/tclinker. Because the power output of the ORC system depends on the preheater exit
 temperature, a couple of upgrades had to be implemented to the rotary kiln: Chlorine
 bypass and solid recovered fuel feeding to the calciner. The initial results, along with the
 implemented upgrades, had shown a waste gas flow of 1.6 Nm3/kgclinker at the preheater,
 representing a waste heat source for the future ORC system. The maximum thermal energy
 output at the preheater was estimated at 36.5 MW, this output is obtained in ideal
 conditions during one year operation time at a 20 ˚C outside temperature as reference, an
 average temperature 366 ˚C at the preheater outlet and a gas flow of 253,328 Nm3/h at the
 preheater.

 3
E3S Web of Conferences 286, 01007 (2021) https://doi.org/10.1051/e3sconf/202128601007
TE-RE-RD 2021

 Fig. 4. ORC thermodynamic circuit

 In the non-ideal case, during operation, the monthly thermal energy output it is expected
 not to exceed more than 21.6 MW because of the seasonal changes of the outside
 temperature. The same assumptions were made to calculate the maximum thermal energy
 output from the clinker cooler, resulting a cooler waste gas of 0.8 Nm3/kgclinker at an average
 air temperature of 250 ˚C inside the cooler. The results had shown that waste air flow is
 126,666 Nm3/h generating a peak power of 10.7 MW. As in the preheater case, the waste
 thermal energy output in non-ideal conditions at the clinker cooler will not exceed 4.1 MW.
 The initial costs of the project were estimated in the feasibility study, the results are shown
 in the table 2. The operational costs and the maintenance ones were estimated at 100
 kEUR/yr. In the financial evaluation of the project, the expected lifetime was considered 20
 years and the availability of the plant at 97%, resulting the financial indicators from table 3.
 Table 1. Natural Gas and Electricity consumption for each Brick Factory
 Technical Characteristic Measuring Unit Value
 Available thermal energy MW 21.3
 Gross electricity production MW 3.8
 Net electricity production MW 3.5
 Gross efficiency % 18 [8]
 Net electricity production at 95% availability of the plant GWh/year 27.0
 Table 2. Initial cost of the ORC system

 Initial costs for the power plant
 Project stage Currency Amount Percent
 1 Land preparation and infrastructure kEUR 100 1%
 2 Engineering, supervision, commissioning kEUR 500 4%
 3 Equipment kEUR 11,500 82%
 4 Civil part kEUR 600 4%
 5 Contingencies kEUR 1,300 9%
 6 Total Project Investment Cost kEUR 14,000 100%
 Table 3. Estimated financial indicators.
 Indicator Value
 NPV 4.7 million EUR
 IRR 16.2 %
 Dynamic Payback 12.5 years

 4
E3S Web of Conferences 286, 01007 (2021) https://doi.org/10.1051/e3sconf/202128601007 TE-RE-RD 2021 3 Actual performance of the ORC system After six years in operation, the Organic Rankine Cycle system has achieved its expected performance. The plant is still operational, covering 15% [9] of the electrical energy demanded by the cement factory. Because the system is designed to operate at low temperatures, the ORC is a much more suitable solution for cement industry in comparison with the conventional steam cycle [10]. After years of monitoring the main parameters of the plant, discrepancies were observed in comparison with the performances described in the initial study. In the estimations phase of the project, the availability of the plant was considered 95%, meaning 7,500 h/yr. The actual availability time of the plant had an average value of 7,200 h/yr, with 300 h/yr less than the expected time. It is very important to specify that the lower availability time is the came as a consequence of the direct interdependence between the ORC plant and the rotary kiln operation, and it should not be considered as a break-down time due to ORC system malfunction. Having an overview on the actual energy performance of the plant, the following were observed: The specific waste air flow from the clinker cooler has the actual measured value of 0.942 Nm3/kgclinker at a temperature of 240 ˚C, representing an increased flow and a decreased temperature in comparison with the one given in the estimation phase. The specific waste gas flow from the preheater has a measured value of 1.090 Nm3/kgclinker, less than the 1.8 Nm3/kgclinker expected in the estimation phase. The outlet temperature of the preheater is 397 ˚C instead of 360 ˚C which represents the calculated temperature of the waste gas coming from the preheater. The amount of thermal energy which can be recovered from the process is approximatively 18.5 MW, representing half of the thermal energy calculated in the ideal conditions of operation. The gross electrical power output has the actual value of 3.1 MW, resulting a a gross efficiency of 17%, representing a close performance in comparison with the estimated value of 18%. Table 4. Actual energy performances of the ORC plant Technical Characteristic Measuring Unit Value Available thermal energy MW 18.5 Gross electricity production MW 3.1 Net electricity production MW 2.9 Gross efficiency % 17 Net electricity energy production at 95% availability of the plant GWh/year 24.7 Considering the lower energy performance compared to those estimated in the feasibility study, the actual production of the power was lower than the electricity production forecast calculated in the feasibility study. The comparison between the actual production and the forecast is presented in figure 5. Regarding the economic aspects, the real maintenance cost did not exceed the estimated cost of 100 kEUR/yr, even though many revisions and inspections were done using external resources which were more expensive than expected in the estimation phase. The annually maintenance using internal and external resources cost are presented in table 5. In order to compare the forecasted financial viability of the project with the actual financial viability, an Actual Scenario analysis was done. The main criterions used in the technic and economic analysis were the Net Present Value – NPV (1), the Internal Rate of Return – IRR (2), the Simple Payback Period – SPP (3), determined by considering a variable annual net income and the Benefit – Cost Analysis – BCA (4). 5
E3S Web of Conferences 286, 01007 (2021) https://doi.org/10.1051/e3sconf/202128601007
TE-RE-RD 2021

 30
 25
 production
 Electricity

 [GWh/yr]
 20
 15
 10
 5
 0
 2011 2012 2013 2014 2015 2016 2017 2018 2019 2020
 Fig. 5. Estimated (orange) vs. Actual (gray) production of the ORC
 Table 5. Actual maintenance cost of the ORC plant
 I. II.
 Maintenance Maintenance Inspections Other
 Pump TOTAL
 Year Cost activities with activities and repairing
 fixing (I+II):
 own using external revisions activities
 resources: resources:
 2013 [kEUR] 8.88 7.55 2.79 3.26 1.50 16.43
 2014 [kEUR] 8.51 6.06 1.58 - 4.48 14.57
 2015 [kEUR] 9.37 51.35 50.73 - 0.62 60.73

 ���
 � − � (1)
 = � − [ ]
 (1 + )�
 ���

 where ttst is the analysis time-frame, in years, It is the yearly income in the tth year, in
 EUR/year, Ct are the yearly expenditures in the tth year, in EUR/year, a is the discount rate
 – 11.38%/year for this end-user and IC is the investment cost, in EUR.
 ���
 � − �
 = � = 0 [ ] (2)
 (1 + )�
 ���

 where the CAPEX can be included in the yearly expenditures as a depreciation cost.

 = [ ] (3)
 ∑���� � − �

 = [−] (4)

 An average escalation rate for electricity prices of 5%/year was also considered, as
 determined in [11]. The technic economic analysis results will be presented in Table 6.
 Because, as it can be observed in Table 6, the financial indicators of the project in the
 Actual Scenario turns out to be unfeasible for the company, a Present Day Scenario was
 also analyzed in order to quantify the differences generated by the maturity of the ORC
 technology. Because the project was implemented in 2011 (only 21 years after the first
 ORC was deployed in the cement industry sector), the technology was still new, and the
 benefit / cost forecast stage of the feasibility study was not accurate. The CAPEX of the

 6
E3S Web of Conferences 286, 01007 (2021) https://doi.org/10.1051/e3sconf/202128601007
TE-RE-RD 2021

 project was also considerably higher than it would be today (an average specific cost
 decrease of 914.63 EUR/kW from 3,414 EUR/kW in 2011 to 2,500 EUR/kW in 2021).
 Table 6. Comparative Financial Analysis
 Financial Indicator Feasibility Study “Actual” scenario “Present day” scenario
 CAPEX [EUR] 14,000.000.00 14,000.000.00 10,500.000.00
 OPEX [EUR/year] 120,000.00 60,730.00 60,730.00
 Average Annual Benefits
 N/A 1,817.969.89 3,304.934.66
 [EUR/year]
 NPV [EUR] 4,700.000.00 -2,884.775.69 9,984.237.28
 IRR [%] 16.90 8.65 21.55
 SPP [years] N/A 12.02 6.31
 BCA [-] N/A 0.79 1.95

 As it can be observed, the scenario in which the project was developed and deployed in
 2021 would lead to more attractive financial indicators, even when properly quantifying the
 OPEX and the average annual benefits. This is mainly due to the maturity of the ORC
 technology and to the almost linear increase of the electricity price both in the 2011 – 2021
 period and in the 2021 – 2040 forecast. In the feasibility study, the project may seem more
 attractive because the initial scenario is also quantifying the annual benefits of using the
 ORC system as a combined heat and power plant. The generated heat would have been
 used for administrative buildings and preparation of hot water. In other industries, the
 thermal energy produced by an ORC system is already valorized, improving the financial
 performance of the projects [12]. Even if the ORC system appears to be not feasible in the
 “actual” scenario, its contributions to reducing the annual CO2 emissions cannot be
 ignored. So far, the annually CO2 reduction was approximatively 15,400 tCO2/yr, economy
 which came as a result of the electricity generated without additional fuel. Regarding the
 differences in the OPEX between the feasibility study forecast and the actual registered
 costs, it was observed that the turbine of the power plant was the most reliable part of the
 system but, the most failures came from the generator break-down and leaks of the organic
 fluid, which is a high toxicity organic compound. The failure time has a strong impact on
 the power plant electricity production because of fewer running hours – some failures
 needed up to one week to be solved. Beside those unexpected events, another discrepancy
 between the availability time of 95% in the initial study and the actual operation of the
 plant is represented by the longer time needed for the rotary kiln inspection. Some
 inspections exceeded 2.5 months until completion, so the kiln was not functional during
 those months, making the ORC plant unavailable. The electricity production of the ORC
 system was also smaller in the “Actual” scenario compared to the forecast of the feasibility
 study. The main reason is that the plant is situated in the moderate-continental climate, the
 outside temperature during the cold season drops below 0˚C (significantly lower than the
 average 20˚C ISO reference temperature used for estimation). This, in turn, leads to a
 decrease in the waste heat extracted from the kiln, thus to a decrease of available thermal
 energy. Currently there are projects meant to increase the ORC capacity in the next few
 years. The cement manufacturer aims to increase the waste heat available for the plant with
 more upgrades on the rotary kiln. A higher daily production rate will produce more heat
 which can be recovered from de plant. An increased capacity will assure a high amount of
 electricity with no additional fuel and no greenhouse gas emissions which is a main issue
 nowadays.

 7
E3S Web of Conferences 286, 01007 (2021) https://doi.org/10.1051/e3sconf/202128601007
TE-RE-RD 2021

 4 Conclusions
 In this paper, the energy performance of a 4.1 MW ORC plant was emphasized. The project
 meant to increase the energy efficiency was a success, despite the discrepancies between
 the initial estimation and the actual achievements. The system has proven its reliability,
 being a fully automated system with few break-down times during operation. Because of
 the similarities with the conventional steam cycle, there were no new additional knowledge
 requirements needed in order to assure the plant operation. Based on the lessons learned, t
 can be concluded that in order to make ORC technology more attractive and increase its
 penetration rate both in the cement industry and in other buildings materials industries, a
 number of adjustments have to be done in the feasibility stage:
 1. The kiln (heat source) capacity must be better estimated – both in terms of
 operability and in terms of evolution over time,
 2. The electricity production forecast must be done by considering the seasonal
 variation of various external factors, such as the outdoor temperature, as it strongly
 influences the efficiency of the system,
 3. The operational costs of the system have to more accurately evaluated – both in
 terms of various parts and subsystem feasibility and in terms of actual costs for
 maintenance, capital works etc.,
 4. The management of the company (both the Top Management and the Factory
 Management) have to get more involved in the feasibility study stage in order to
 properly evaluate various hypothesis made by the consultancy team and to
 mitigate the eventual misassumptions.

 References
 1. LafargeHolcim, Integrated Sustainability Report, (2020).
 2. H. Legmann, "Recovery of Industrial Heat in the Cement Industry by Means of the
 ORC Process," 44th IEEE-IAS/PCS Cement Industry Technical Conference,5-9 May,
 pp 29-35, Florida, ISBN 0-7803-7254-9, (2002).
 3. International Energy Agency, "Total energy related CO2 emissions with and without a
 sustainable recovery, 2005-2023," (2020).
 4. European Commission, “Cement, waste and carbon markets. Problems related to waste
 incineration in cement kilns under the EU-ETS,” (2020).
 5. Cembureau – The European Cement Association, „Cementing the European Green
 Deal", (2020).
 6. Institute for Industrial Productivity, “Waste Heat Recovery for the Cement Sector:
 Market and Supplier analysis Waste Heat Recovery for the Cement Sector”, (2014).
 7. M. Poerner and A. Rimpel, “Waste heat recovery,” in “Fundamentals and Applications
 of Supercritical Carbon Dioxide (SCO2) Based Power Cycles”, Woodhead Publishing,
 pp. 255–267, DOI: 10.1016/B978-0- 08-100804-1.00010, (2017).
 8. S. Quoiilin, M. V. D. Broek, S. Declaye, P. Dewallef and V. Lemort, "Techno-
 economic survey of Organic Rankine Cycle (ORC) systems," “Renewable and
 Sustainable Energy Reviews”, vol. IV, no. 22, pp. 168-186, (2012).
 9. R. Menz, "From Waste Heat To Power," International Cement Review, no. 10, pp. 59-
 62, (2012).
 10. S. Karellas, “Energetic and exergetic analysis of waste heat recovery systems in the
 cement industry,” Energy, no. 58, pp. 147-156, (2013).

 8
E3S Web of Conferences 286, 01007 (2021) https://doi.org/10.1051/e3sconf/202128601007
TE-RE-RD 2021

 11. Ioan-Sevastian Bitir-Istrate, Cristian Gheorghiu and Miruna Gheorghiu, “The Cost of
 Indecision in Energy Efficiency. A Cost of Opportunity Analysis for an Industrial
 Consumer,” 55th International Scientific Conference on Information, Communication
 and Energy Systems and Technologies (ICEST), DOI:
 10.1109/ICEST49890.2020.9232894, (2020)
 12. M. Scripcariu, I. Bitir-Istrate, M. Butu, R. Porumb, A. Pavel, M. Patrascan, “Heat
 recovery in metallurgy. Technical and economical aspects of using ORC installations
 in Romania,” 6th International Conference on Thermal Equipment, Renewable Energy
 and Rural Development, June 8-10, Romania, ISSN 2359-7941, pp.: 149-154, (2017).

 9
You can also read