In an industry where M&A is the new black, should Pandora A/S acquire Aritzia Inc.?
←
→
Page content transcription
If your browser does not render page correctly, please read the page content below

In an industry where M&A is the new black,
 should Pandora A/S acquire Aritzia Inc.?

 Ana Rita Gomes Godinho

 Dissertation written under the supervision of
 Professor António Borges de Assunção

Dissertation submitted in partial fulfilment of requirements for the MSc in
 Finance, at the Universidade Católica Portuguesa, 2019.
Abstract
The present dissertation aims at performing a thorough analysis of the feasibility of a friendly
acquisition deal between Pandora A/S and Aritzia Inc., where Pandora A/S is the acquirer firm,
whereas Aritzia Inc. is the target. Pandora A/S is a global jewelry manufacturer and retailer,
while Aritzia is a women’s apparel designer, manufacturer and retailer; an overview of each
company’s business is presented. The analysis performed herewith also comprises an economic
outlook of the jewelry and apparel industries, followed by the valuation of the companies as
separate entities and as a combined entity, resorting to differing valuation approaches, such as
the Discounted Cash Flow Valuation and the Relative Valuation methods. The deal would take
place in a global environment with a strong M&A activity in the fashion industry, with the
amount of deals and their value reaching record-high numbers. The suggested deal entails
synergies valued at USD 395.19 million and will take the form of an all-share transaction, with
a purchase price of USD 1,877 million, corresponding to a premium of 20.35%. By 2023,
expectations are that the deal will potentially yield an accretion of 5.87%.

Author: Ana Rita Gomes Godinho
Title: In a world where M&A is the new black, should Pandora A/S buy Aritzia Inc.?
Keywords: M&A; Jewelry Industry; Apparel Retail Industry; Omnichannel; Synergies; Premium

Resumo
A presente dissertação tem como objetivo realizar uma análise minuciosa da viabilidade da
realização de um negócio de aquisição amigável entre a Pandora A/S e a Aritzia Inc., no qual a
Pandora A/S atua como empresa aquisitiva, e a Aritzia Inc. como empresa-alvo da compra. A
Pandora A/S é uma produtora e retalhista mundial de joalharia, enquanto que a Aritzia elabora
o design, produz e vende produtos de vestuário feminino; é aqui apresentada uma visão global
do negócio de cada empresa. A análise realizada inclui, também, uma visão global das
indústrias de joalharia e vestuário, seguida da avaliação das empresas enquanto entidades
individuais, e também enquanto uma só entidade fundida, recorrendo a diferentes abordagens
de avaliação. A transação teria lugar num ambiente global pautado por uma forte atividade de
Fusões e Aquisições na indústria da moda, sendo que o número de transações e o valor que
estas tomam têm atingido valores recorde. O negócio aqui sugerido ocasiona sinergias avaliadas
em USD 395.19 milhões, e adota a forma de um negócio totalmente financiado por ações, com
um preço de aquisição de USD 1,877 milhões, a que corresponde um prémio de 20.35%. Em
2023, expecta-se que a transação terá associado um lucro por ação de 5.87%.

Autor(a): Ana Rita Gomes Godinho
Título: Numa indústria em que Fusões e Aquisições são a nova moda, deverá a Pandora A/S adquirir a Aritzia
Inc.?
Palavras-chave: Fusões e Aquisições; Indústria de Joalharia; Indústria de Retalho de Vestuário; Omnicanal;
Sinergias; Prémio

 1
Acknowledgements
Firstly, I would like to thank Professor António Borges de Assunção for his invaluable guidance
throughout the process of writing this dissertation. It has been a pleasure to work alongside such
an outstanding Professor not only for his academic unequaled knowledge, but also for the
patience and kindness demonstrated throughout the project.

I would also like to thank my Family, especially my mother, father, brother and godfather, for
their love and support that is much needed in all aspects of life and which I cherish from the
bottom of my heart. Thank you also to my grandparents, who raised me and taught me to be
kind and to work hard to reach my goals. Their love is invaluable.

Last but not least, I would like to thank my friends, who are so dear to me, for accompanying
me throughout this journey. I would like to very specially thank Kamile Bertasiute and Sofia
Natário, who I had the pleasure to meet in Católica and with whom I have spent the whole
journey of elaborating the present thesis. Thank you also to my dearest friends Afonso
Medeiros, Beatriz Santos, Cláudia Gaspar, Fernando Alli, Giulia March, Henrique Carmo, Inês
Freire, Inês Pereirinha, Joana Conde, Joana Santos, João Guerra, João Quaresma, Juliana
Crisóstomo, Luísa Silva, Mafalda Domingues, Patrícia Vaz, Pedro Rossi, Ramon Nolasco, Rita
Malafaya, Sofia Santos, Sofia Costa and Tiago Coelho.

 2
TABLE OF CONTENTS

Table of Contents ..................................................................................................................... 3

List of Figures ........................................................................................................................... 9

List of Tables........................................................................................................................... 10

List of Formulas ..................................................................................................................... 11

List of Abbreviations .............................................................................................................. 12

List of Variables and Symbols............................................................................................... 13

1 Introduction ..................................................................................................................... 14

2 Literature Review ........................................................................................................... 15

 2.1 M&A Motivations .................................................................................................... 15

 2.1.1 Operating Synergies ............................................................................................. 15

 2.1.1.1 Diffusion of Know-How and Strategic Realignment.................................. 16

 2.1.1.2 Increase in Purchasing and Pricing Power .................................................. 16

 2.1.1.3 Higher Growth and Entrance in New Markets ........................................... 16

 2.1.2 Financial Synergies .............................................................................................. 16

 2.1.2.1 Diversification – Riskiness and Correlation of Cash Flows ....................... 17

 2.1.2.2 Increased Debt Capacity ............................................................................. 17

 2.2 Cross Border Mergers .............................................................................................. 18

 2.3 Valuation Techniques Overview .............................................................................. 19

 2.3.1 Discounted Cash Flows (DCF) ............................................................................ 19

 2.3.1.1 Free Cash Flows to the Firm (FCFF) .......................................................... 19

 2.3.1.2 WACC (Weighted Average Cost of Capital) .............................................. 20

 2.3.1.2.1 Cost of Equity ......................................................................................... 20

 2.3.1.2.1.1 The Risk-Free Rate .......................................................................... 21

 2.3.1.2.1.2 Beta (β) ............................................................................................ 21

 2.3.1.2.2 Cost of Debt ............................................................................................ 22

 2.3.1.3 Discounting Foreign Currency Cash Flows ................................................ 22

 3
2.3.2 Relative Valuation ................................................................................................ 22

3 Industry Overview .......................................................................................................... 24

 3.1 The Jewelry Industry ................................................................................................ 24

 3.1.1 Growth Expectations ............................................................................................ 25

 3.1.2 Industry Trends .................................................................................................... 26

 3.1.2.1 E-Commerce and the Evolving Brick-and-Mortar Store ............................ 26

 3.1.2.2 Conversational Commerce and the Evolving Store .................................... 27

 3.1.2.3 High Demand for Convenience .................................................................. 27

 3.1.2.4 Sustainability on the Rise............................................................................ 27

 3.1.2.5 Polarization and Hybrid Consumption........................................................ 28

 3.1.2.6 Technology in Jewelry Items ...................................................................... 28

 3.1.2.7 Company Integration .................................................................................. 28

 3.2 The Apparel Retail Industry ..................................................................................... 29

 3.2.1 Growth Expectations and Profitability Performance ........................................... 29

 3.2.2 Industry Trends .................................................................................................... 30

 3.2.2.1 Consumer Power ......................................................................................... 30

 3.2.2.2 Competition and Convergence .................................................................... 31

 3.2.2.3 The Omnichannel Experience ..................................................................... 31

 3.2.2.4 The Celebrity Effect .................................................................................... 32

 3.2.2.5 Demand for Sustainability and Ethical Behavior ........................................ 32

4 Company Overview ........................................................................................................ 33

 4.1 Pandora ..................................................................................................................... 33

 4.1.1 Share Price History............................................................................................... 34

 4.1.2 Program NOW...................................................................................................... 35

 4.1.2.1 Previous Expansion Program ...................................................................... 36

 4.1.3 Ownership Structure ............................................................................................. 36

 4.1.4 Historical Analysis ............................................................................................... 37

 4
4.2 Aritzia ....................................................................................................................... 39

 4.2.1 Sales Channels...................................................................................................... 39

 4.2.2 Share Price History............................................................................................... 40

 4.2.3 Ownership Structure ............................................................................................. 41

 4.2.4 Historical Analysis ............................................................................................... 42

5 Transaction Rationale .................................................................................................... 44

6 Valuation .......................................................................................................................... 46

 6.1 Pandora ..................................................................................................................... 46

 6.1.1 Discounted Cash Flows Valuation ....................................................................... 46

 6.1.1.1 Revenue Forecast ........................................................................................ 46

 6.1.1.2 COGS, SG&A, Gross Profit and EBIT ....................................................... 47

 6.1.1.3 Income Tax Expense ................................................................................... 47

 6.1.1.4 Depreciation and Amortization ................................................................... 47

 6.1.1.5 Capital Expenditures ................................................................................... 47

 6.1.1.6 Changes in NWC ........................................................................................ 48

 6.1.1.7 WACC Computation ................................................................................... 48

 6.1.1.8 FCFF ........................................................................................................... 49

 6.1.1.9 Equity Value ............................................................................................... 49

 6.1.1.10 Sensitivity Analysis .................................................................................... 50

 6.1.2 Relative Valuation ................................................................................................ 50

 6.1.2.1 Cluster Analysis .......................................................................................... 50

 6.1.2.2 Multiples ..................................................................................................... 50

 6.1.3 Valuation Results ................................................................................................. 51

 6.2 Aritzia ....................................................................................................................... 52

 6.2.1 Discounted Cash Flows Valuation ....................................................................... 52

 6.2.1.1 Revenue Forecast ........................................................................................ 52

 6.2.1.2 COGS, SG&A, Gross Profit and EBIT ....................................................... 52

 5
6.2.1.3 Income Tax Expense ................................................................................... 52

 6.2.1.4 Depreciation & Amortization, Capital Expenditures, NWC Changes ........ 53

 6.2.1.5 WACC Computation ................................................................................... 53

 6.2.1.6 FCFF ........................................................................................................... 53

 6.2.1.7 Equity Value ............................................................................................... 54

 6.2.1.8 Sensitivity Analysis .................................................................................... 54

 6.2.2 Relative Valuation ................................................................................................ 54

 6.2.2.1 Cluster Analysis .......................................................................................... 54

 6.2.2.2 Multiples ..................................................................................................... 55

 6.2.3 Valuation Results ................................................................................................. 55

7 The Combined Firm ....................................................................................................... 56

 7.1 Cross Border FX Peculiarities .................................................................................. 56

 7.2 Combined WACC and Perpetuity Growth Rate ...................................................... 57

 7.3 Valuation with No Synergies ................................................................................... 57

 7.4 Valuation of the Merged Firm and Inherent Synergies ........................................... 58

 7.4.1 Sources of synergy ............................................................................................... 58

 7.4.1.1 Production Sites and Cross-Selling ............................................................. 58

 7.4.1.2 SG&A and COGS ....................................................................................... 58

 7.4.1.3 Marketing and Advertising Cost-Cutting Synergies ................................... 59

 7.4.1.4 Shared E-Commerce Platform .................................................................... 59

 7.4.1.5 Brand strength ............................................................................................. 59

 7.4.1.6 Geographic diversification and store concept ............................................. 60

 7.4.2 Valuing Synergies ................................................................................................ 60

 7.4.2.1 Revenue Synergies ...................................................................................... 60

 7.4.2.2 Cost Synergies ............................................................................................ 61

 7.4.3 Transaction Fees and Integration Costs ............................................................... 61

 7.4.4 Valuation Results ................................................................................................. 62

 6
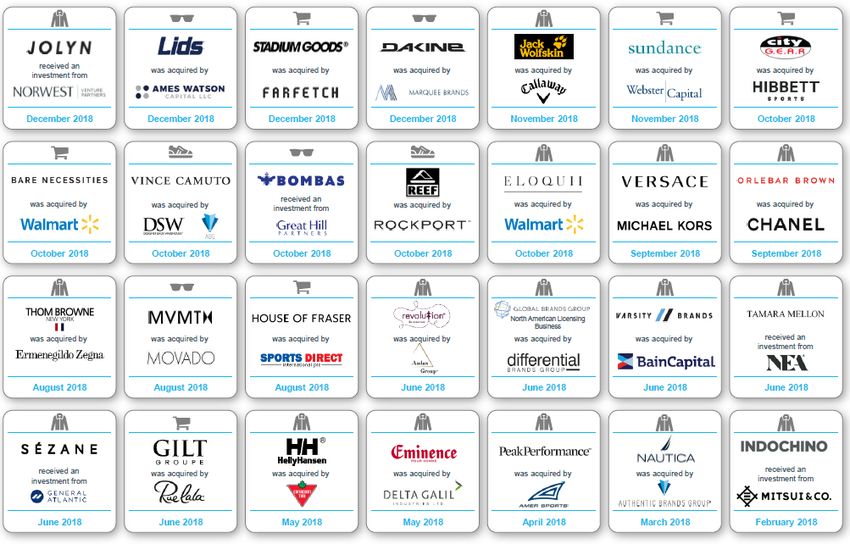
7.4.5 Sensitivity Analysis .............................................................................................. 62

8 The Transaction Process ................................................................................................ 63

 8.1 Transaction Premium ............................................................................................... 63

 8.2 Methods of Payment................................................................................................. 63

 8.3 Accretion/Dilution Analysis ..................................................................................... 64

 8.4 Inherent Risks of the Transaction............................................................................. 65

9 Conclusion ....................................................................................................................... 66

Appendices .............................................................................................................................. 67

 Appendix 1 - Exchange Rate Computation .......................................................................... 67

 Appendix 2 – World’s 10 Largest Apparel Retail Brands .................................................... 67

 Appendix 3 – Illustration of the Celebrity Effect ................................................................. 68

 Appendix 4 – Jewelry Industry Five Forces Analysis .......................................................... 69

 Appendix 5 – Apparel Retail Industry Five Forces Analysis ............................................... 71

 Appendix 6 – Aritzia’s In-House Brands ............................................................................. 73

 Appendix 7 – M&A Deals in Retail, 2018 ........................................................................... 73

 Appendix 8 - Pandora’s Income Statement Forecasts .......................................................... 74

 Appendix 9 - Pandora’s Balance Sheet (Assets and Liabilities) Forecasts .......................... 74

 Appendix 10 - Pandora’s Revenue Forecast......................................................................... 76

 Appendix 11 - Pandora’s Summary of DCF Results ............................................................ 76

 Appendix 12 - Pandora’s Peer Group ................................................................................... 76

 Appendix 13 - Aritzia’s Income Statement Forecasts .......................................................... 77

 Appendix 14 - Aritzia’s Balance Sheet (Assets and Liabilities) Forecasts .......................... 77

 Appendix 15 - Aritzia’s Revenue Forecast........................................................................... 78

 Appendix 16 - Aritzia’s Summary of DCF Results .............................................................. 79

 Appendix 17 - Aritzia’s Peer Group ..................................................................................... 79

 Appendix 18 - FX Futures Quotes for DKK/USD and CAD/USD ...................................... 79

 Appendix 19 - Transaction Fees and Integration Costs ........................................................ 80

 7
Appendix 20 - Accretion/Dilution Analysis ......................................................................... 80

Glossary ................................................................................................................................... 81

References ............................................................................................................................... 82

 8
LIST OF FIGURES
Figure 1 - Global Jewelry & Watches Industry value by geographic location, 2017 ............. 25
Figure 2 - Expected jewelry and watches industry growth, in USD billion, 2017-2022 ........ 26
Figure 3 - Expected apparel retail industry growth, in USD billion, 2017-2022 .................... 30
Figure 4 - Pandora's revenue by product category, in DKK million, 2018 ............................. 33
Figure 5 - Pandora's revenue by product category, in DKK million, 2018 ............................. 34
Figure 6 - Pandora’s revenue by geographic region, 2018...................................................... 34
Figure 7 - Pandora and OMX C20 cumulative returns, 3-oct-2016 to 4-mar-2019 ................ 35
Figure 8 - Pandora's revenues and EBITDA margin, in DKK million, 2014-2018 ................ 37
Figure 9 - Aritzia’s revenue by geographic region, 2018........................................................ 39
Figure 10 - Aritzia's measured store growth, 2014-2018 ........................................................ 40
Figure 11 - Aritzia and TSE cumulative returns, 3-oct-2016 to 4-mar-2019 .......................... 41
Figure 12 - Aritzia's revenues and EBITDA margin, in CAD thousands, 2014-2018 ............ 42
Figure 13 - Pandora's share price valuation summary, in DKK .............................................. 51
Figure 14 - Aritzia's share price valuation summary, in CAD ................................................ 55
Figure 15 - Valuation Summary of EV, in USD million ......................................................... 62
Figure 16 - Forces driving competition in the global jewelry and watches market, 2017 ...... 69
Figure 17 - Forces driving competition in the apparel retail market, 2017 ............................. 71

 9
LIST OF TABLES
Table 1 - Pandora's top shareholders, 2018 ............................................................................. 36
Table 2 - Pandora's main metrics overview, in DKK million, 2014-2018 ............................. 38
Table 3 - Aritzia's top shareholders, 2018 .............................................................................. 41
Table 4 - Aritzia's main metrics overview, in CAD thousands, 2014-2018 ............................ 43
Table 5 - Pandora's FCFF, in DKK million ............................................................................. 49
Table 6 - Pandora's share price sensitivity analysis to WACC and PGR, in DKK ................. 50
Table 7 - Aritzia's FCFF, in CAD thousand ............................................................................ 53
Table 8 - Pandora's share price sensitivity analysis to WACC and PGR, in CAD ................. 54
Table 9 - Pandora and Aritzia's EV, from DKK and CAD to USD (respectively); combined
WACC and PGR, 2018 ............................................................................................................ 57
Table 10 - Summary of the deal synergies, in USD million; synergy type as a percentage of
total synergy value ................................................................................................................... 60
Table 11 - EV sensitivity analysis to shifts in synergy assumptions, in USD million ............ 62
Table 12 - Summary of the method of payment, in USD ........................................................ 64
Table 13 – Computation of the exchange rate for merging companies which report in different
currencies ................................................................................................................................. 67
Table 14 - Pandora's forecasted Income Statement, in DKK million, 2019-2023 .................. 74
Table 15 - Pandora's forecasted assets and liabilities, in DKK million, 2019-2023 .............. 75
Table 16 - Pandora's revenue forecast ..................................................................................... 76
Table 17 - Pandora's summary of DCF results ........................................................................ 76
Table 18 - Pandora's peer group, 2018 .................................................................................... 76
Table 19 – Aritzia’s forecasted Income Statement, in CAD thousands, 2019-2023 ............... 77
Table 20 – Aritzia’s forecasted assets and liabilities, in CAD thousands, 2019-2023 ........... 78
Table 21 - Aritzia's revenue forecast, in CAD thousands, 2019-2023 .................................... 78
Table 22 - Aritzia's summary of DCF results .......................................................................... 79
Table 23 - Aritzia's peer group ................................................................................................ 79
Table 24 - FX futures quotes ................................................................................................... 79
Table 26 - Estimation of transaction fees and integration costs, in USD million ................... 80
Table 27 - Accretion/dilution analysis of the EPS before and after the deal, in USD millions
and percentage .......................................................................................................................... 80

 10
LIST OF FORMULAS
Formula 1 - Present value ....................................................................................................... 19
Formula 2 - FCFF ................................................................................................................... 19
Formula 3 - WACC ................................................................................................................. 20
Formula 4 - Cost of Equity ..................................................................................................... 20
Formula 5 - Levered Beta ....................................................................................................... 21
Formula 6 - Cost of Debt ........................................................................................................ 22
Formula 7 - Levering beta....................................................................................................... 48

 11
LIST OF ABBREVIATIONS
ADR American Depositary Receipt
BRIC Brazil, Russia, India and China
CAD Canadian Dollar
CAGR Compound Annual Growth Rate
CapEx Capital Expenditures
COGS Cost of Goods Sold
C&IP Consumer and Industrial Products
D&A Depreciation and Amortization
DCF Discounted Cash Flows
DKK Danish Krone
EBIT Earnings Before Interest and Taxes
EBITDA Earnings Before Interest, Taxes, Depreciation and Amortization
EMEA Europe, Middle East and Africa
EV Enterprise Value
FCFF Free Cash Flows to the Firm
FX Foreign Exchange
G&A General and Administrative
IA Intangible Assets
IPO Initial Public Offering
MarketCap Market Capitalization
NASDAQ National Association of Securities Dealers Automated Quotations
OMX Open Mobile Exchange
p.e. per example
PER Price-to-Earnings
PGR Perpetuity Growth Rate
PPE Property, Plant and Equipment
PV Present Value
ROA Return on Assets
ROIC Return on Invested Capital
SG&A Selling, General and Administrative
SG&M Selling, General and Marketing
TSE Toronto Stock Exchange
USA United States of America
USD United States Dollar
WACC Weighted Average Cost of Capital
ΔNWC Changes in Net Working Capital

 12
LIST OF VARIABLES AND SYMBOLS
βL Levered Beta
βU Unlevered Beta
Cov (x ; y) Covariance of the variables x and y
D Debt
E Equity
E(CFt) Expected Cash Flow at time t
FCFFt Free Cash Flow to the Firm at time t
k Discount Rate
kd Cost of Debt
ke Cost of Equity
Rf Risk-free Rate
Ri Return on Individual Stock
RM Return on Market Index
Tc Corporate Tax Rate
Var (z) Variance of the variable z

 13
1 INTRODUCTION

M&A is the new black in fashion, as retailers and manufacturers attempt to survive in an
industry where disruption is constant and from which shareholders expect positive return levels.

Being as it is, the current ever-changing economic conjuncture presents a challenge for
companies all around the world. Disruption is a key-word in today’s global economy as
technology is gaining terrain, consumers’ preferences shift on an hourly-basis, nationalistic and
protectionist trends are rising, and sustainability influences company reputation and consumer
demand. Consequently, operating margins and profits are threatened, and companies
understand that acquisitions appear as a good strategy to successfully face this scenario.

However, in the scope of the current aggressive M&A environment, where deals are reaching
record-high values, companies should question the worthiness of engaging in a deal.

Accordingly, one question is hereby posed: in the current economic M&A environment, is it
value-accretive for Pandora A/S to buy Aritzia Inc.?

With the goal of answering this question, the present dissertation is structured as follows:
section 2 provides an overview on academic literature on M&A and company valuation; section
3 entails an overview of the industries where Pandora and Aritzia operate – the jewelry industry
and the apparel retail industry – and identifies the main industry trends; section 4 describes and
analyses Pandora and Aritzia’s business activity, quote history, ownership structure and
historical performance; section 5 consists of a discussion on the rationality of the deal; section
6 comprises each company’s individual valuation; section 7 values companies as a combined
entity and includes a description of the peculiarities inherent to a cross-border deal, the sources
of synergy and their valuation; section 8 describes the transaction process, namely the method
of payment and deal value; section 9 presents the conclusions emerging from the elaboration of
this dissertation, along with the recommendation of whether or not the companies should go
ahead with the proposed deal.

 14
2 LITERATURE REVIEW

The concept of Mergers and Acquisitions (M&A), also referred to as business combinations,
denotes the situation in which disassociated companies are combined into one single reporting
entity. As a result, we can interpret the occurrence of M&A as a form of company restructuring
– it is likely that firms respond to industry shocks by restructuring, which is often carried out
by means of merging (Andrade, Mitchell, & Stafford, 2001).

The definition of a transaction rationale together with the definition of a takeover strategy is
one of the four steps to consider upon engaging in M&A. The steps that follow involve the
choice of a target and its valuation, the amount to be paid by the acquirer for the acquisition of
the target, and the method of payment (stock, cash or a combination of both). Lastly, crucial to
the success of the deal, is the post-merger period, defined by the need to integrate two distinct
business models (Damodaran, 2012).

In this context, the present section provides a theoretical framework for M&A through a
thorough literature review. The chapter begins by describing the several motivations leading to
the occurrence of M&A, followed by M&A deals with a cross-border nature, how to finance
M&A, and the different methods used to value the firms involved in the deal.

2.1 M&A MOTIVATIONS

A merger or acquisition occurs when the expected economic, operational and financial benefits
arising from the combination of companies are greater than the benefits emerging from the
separate entities operating on their own. The existence of synergies is what determines the
existence of M&A deals. Damodaran (2005) describes synergies as the “additional value that
is generated by combining two firms” and categorizes them into operating and financial,
according to their sources.

2.1.1 OPERATING SYNERGIES

Operating synergies are translated into higher expected cash flows and can emerge from
economies of scale, increasing pricing power and higher growth potential, for example. The
operational synergies that may arise from the present deal are herewith described.

 15
2.1.1.1 Diffusion of Know-How and Strategic Realignment

The “complementarity in research and basic technological expertise” originates synergies
(Lewellen, 1971). When companies have differing functional strengths, these can be
transferred. Through the share of know-how via M&A, companies can more easily adapt to
changes in their surrounding environment, allowing them to adapt faster than if they were to
internally develop (Verboven, Ilkovitz, Stennek, Meiklejohn, & Röller, 2000).

Pandora will take advantage of Aritzia’s know-how of e-commerce and its developed and
successful online platform, rather than developing one internally (Motis, 2007).

 2.1.1.2 Increase in Purchasing and Pricing Power

The combined company (operating at the downstream stage of production) has an increased
purchase and bargaining power with suppliers (at the upstream level of production) due to
becoming a bigger company. The increase in purchasing power yields the benefit of obtaining
discounts and/or better prices from suppliers, leading to increased margins and operating
income (Damodaran, 2005).

 2.1.1.3 Higher Growth and Entrance in New Markets

Thanks to the business combination, both the acquirer and the target can enter new markets and
profit from each other’s already established distribution network and public awareness of the
brand, or increase sales in markets where they already operate (Damodaran, 2005).

2.1.2 FINANCIAL SYNERGIES

Financial synergies are evident through either higher cash flows or lower discount rates, and
may include tax benefits and higher debt capacity.

Financial synergies have both positive and adverse effects. For example, risk reduction is one
advantage that springs when two firms are combined, as there is a diversification factor, given
that activities’ cash flows are imperfectly correlated. Yet, when firms operate on their own, the
separate capital structures entail the benefit of optimization.

 16
The impact of financial synergies depends on the riskiness and correlation of cash flows and
taxes, among others.

 2.1.2.1 Diversification – Riskiness and Correlation of Cash Flows

Diversification entices M&A activity (Damodaran, 2005). Modern Portfolio Theory dictates
that having a level of risk at aim, it is possible to build up a diversified portfolio which
maximizes returns (Motis, 2007). Moreover, according to Leland (2007), financial synergies
are more likely to be positive when companies have a low correlation and low even similar
volatilities. Furthermore, when the firms involved in the transaction have elevated default costs,
diversification increases value through risk-reduction (Leland, 2007).

 2.1.2.2 Increased Debt Capacity

By reducing the risk of default, mergers increase the combined firm’s debt capacity (Lewellen,
1971). M&A reduces the risk of default of the companies involved because they reduce the
relative variability of the combined firm’s income stream. Consequently, there is a lower
probability that the combined entity will be unable to meet with the contractual agreement of
interest and principal payments.

 17
2.2 CROSS BORDER MERGERS

Within the scope of this dissertation, it is relevant to discuss cross-border mergers, as Pandora
is a Danish company and Aritzia is Canadian. Unlike in national mergers, cross-border mergers
face challenges posed by the existence of national borders. Some challenges which are not
present in national mergers and influence cross-border deals are the different cultural identities
– different languages are spoken, there may be different religions, and the own country’s
corporate culture can also diverge. All these factors increase the costs of M&A and must be
examined.

The reasons that justify the occurrence of cross-border M&A are, conceptually, the same as the
ones occurring at national levels (Erel, Liao, & Weisbach, 2012), as well as additional motives
that national borders create. Nevertheless, firms merge when the value of the combined firm is
superior to the sum of the values of the individual firms (Erel et al., 2012).

Geography plays an important role in cross-border M&A, since the distance between countries
increases the costs of merging. Bilateral trade is also important – synergies are more likely to
arise as the acquirer company already has established a set of customers in the target’s country
(and vice-versa), knows the market and the culture (Erel et al., 2012).

Valuation changes emerging from currency movements are also an important factor in
international deals. When there is a depreciation in the target firm’s currency in relation to the
acquirer’s, the target becomes more attractive to potential acquirers as it becomes relatively
cheaper. The opposite can also occur - when the acquirer’s currency appreciates, its buying
power increases.

Additionally, there are complex issues that must be subject of careful consideration when
engaging in international deals. These are related to political considerations and their
implications on the deal – p.e., the current environment of an imminent trade war between the
USA and China and its indirect impact in Europe, Canada, and Latin America (Tennant, 2018).
The current nationalistic and protectionist trends permeating economies should also be
examined, along with legal and regulatory issues, diverging tax systems and accounting rules,
and labor and employment challenges (Tennant, 2018).

Notwithstanding these challenges, in 2018, 38.2% of global M&A corresponded to cross-border
deals.

 18
2.3 VALUATION TECHNIQUES OVERVIEW

2.3.1 DISCOUNTED CASH FLOWS (DCF)

According to the DCF methodology for valuing operations, the value of a business equals its
forecasted future cash flows discounted to their present value (Luehrman, T., 1997). Such
discount is made through an adequate rate, adjusting for the time value of money, and
representing the risk of the cash flows (Luehrman T., 1997). The forecasted cash flows are
computed for a period varying from company to company, after which the firm is assumed as
a going concern.

Formula 1 indicates how to compute the present value (PV) of an asset:

 Where:
 ( ) • n is the number of periods in the asset’s life
 = ∑
 (1 + ) • E(CFt) is the expected cash flow at time t
 =0
 • k is the discount rate
 Formula 1 - Present value

 2.3.1.1 Free Cash Flows to the Firm (FCFF)

The hereby preferred method to compute FCFF, takes on from the firms’ EBIT (Kaplan &
Ruback, 1996) and is given by Formula 2.

 FCFFt
 = EBIT
 – Corporate taxes (EBIT*tax rate)
 + Depreciation and Amortization (D&A)
 – Changes in Net Working Capital (ΔNWC)
 – Capital Expenditures (CapEx)
 Formula 2 - FCFF

 19
2.3.1.2 WACC (Weighted Average Cost of Capital)

WACC is the discount rate used herein to compute the PV of the FCFF.

The WACC is a weighted average of “two very different magnitudes”: the cost of debt and the
required return to equity (Fernández, 2011).

WACC weights “the market-determined cost of debt and equity with the respective
proportional claims of each” and adds these two components (Froot & Kester, 1995). It is a
tax-adjusted discount rate which considers the tax advantage associated with the increase in
corporate debt: the interest tax shield.

WACC is computed resorting to Formula 3.

 Where:
 • E is the market value (MV) of the firm’s equity
 • D is the MV of the firm’s debt

 = ∗ + ∗ ∗ (1 − ) • V=E+D is the total MV of the firm’s financing
 • Ke is the required return on equity
 • Kd is the cost of debt
 • Tc is the corporate tax rate
 Formula 3 – WACC

 2.3.1.2.1 Cost of Equity

The cost of equity is determined by taking the risk-free rate of an economy, to which the market
risk premium multiplied by the risk of a company’s stock (β) is added. This is reflected by
Formula 4:

 Where:
 • Rf is the risk-free rate
 = + ( − ) • βL is the levered beta
 • RM is the return on market index
 • RM – Rf is the market risk premium
 Formula 4 - Cost of Equity

 20
2.3.1.2.1.1 The Risk-Free Rate

The risk-free rate represents the compensation an investor should expect to get from a zero-risk
investment. In finance, risk is assessed based on the variance of actual returns relative to
expected returns – when variance is zero, we are before a risk-free asset (Damodaran, 2008).
According to Damodaran (2008), for mature markets, using the 10-year treasury bond rate as a
measure for the risk-free rate is “a good practice in valuation”.

Within the scope of the present paper, given the international nature of the deal, it should be
noted that the risk-free rate varies across currencies. The risk-free rate used in an asset’s
valuation should be measured in the same currency as the cash-flows, p.e., the Canadian
Govecotrnment bond rate will be used as the risk-free rate if the cash flows of an investment
are presented in CAD (Damodaran, 2008).

 2.3.1.2.1.2 Beta (β)

Beta is a measure of the relative volatility of a stock against the market (Jacobs & Shivdasani,
2012). It measures the systematic (non-diversifiable) risk of a stock by comparing it to the
stock’s reaction in relation to the market.

Beta can either be levered or unlevered. The levered beta (βL) measures the risk of a firm against
the market, considering both debt and equity in the firm’s capital structure; the unlevered beta
(βU) measures the risk of a firm’s assets, as it does not consider the financial effects of leverage.

To compute the cost of equity, we consider the levered beta of a firm, given by Formula 5.

 Where:
 • Ri is the return on an individual stock
 • RM is the return on the overall market
 ( ; ) • Cov is the covariance – how changes in a
 =
 ( ) stock’s returns are related to changes in the
 market’s returns

 • Var is the variance – how far the market’s data
 points spread out from their average value
 Formula 5 –Levered Beta

 21
2.3.1.2.2 Cost of Debt

The rate at which a company can borrow money today is given by the cost of debt (Kd), which
is derived by adding the company’s estimated default spread to the risk-free rate:

 = +

 Formula 6 - Cost of Debt

Companies which have a greater risk of defaulting are associated with higher costs of debt –
debtholders will demand a higher premium for taking on debt securities that are riskier.

 2.3.1.3 Discounting Foreign Currency Cash Flows

According to Zenner, Matthews, Marks, & Mago (2004), there are two paths to determine cross-
border DCF values. The first is through discounting cash flows at the “home” currency discount
rate. The second involves discounting cash flows at the foreign currency discount rate and is
the path hereby preferred and detailed in Appendix 1.

2.3.2 RELATIVE VALUATION

The relative valuation methodology resorts to the value of comparable (or similar) assets
assessed by the market and compares these with the value of the asset under analysis – this
methodology was developed bearing in mind the conception that the market values similar
assets in similar ways (Damodaran, 2015).

As specified by Kaplan & Ruback (1995), relative valuation holds two assumptions which are
important, though not entirely valid: the risks and future cash flows of the peer companies are
expected to be proportional to the ones of the firm under analysis; the value of the firm varies
proportionally to changes in its performance.

“Multiples are useful in a second stage of valuation”, as they allow the analysis of the methods
previously used and enable a comparison between the valued firm and its peers (Fernández,
2001). Multiples are always computed relative to a performance measure, such as EBITDA,
EBIT, Net Income or Revenues (Kaplan & Ruback, 1995). The most commonly used multiples

 22
are the PER and the EV/EBITDA. However, some multiples are more appropriate than others
for different industries (Fernández, 2001).

Value is gauged by multiplying the average of the peers’ multiples by the performance measures
of the company to be valued.

 23
3 INDUSTRY OVERVIEW

Pandora is a multinational brand which designs, manufactures and markets jewelry. Aritzia
operates both as a designer and as a retailer of several in-house apparel brands.

According to the Global Industry Classification Sector, both companies operate in the same
industry: Apparel, Accessories and Luxury Goods (GICS: 25203010), which integrates the
Textiles, Apparel and Luxury Goods sector , commonly known as the Fashion Industry.

Given the clear distinction between companies operating in the apparel sub-sector and in the
jewelry sub-sector, the following section presents a separate analysis of the Jewelry Retail
business and of the Apparel Retail one.

3.1 THE JEWELRY INDUSTRY

The Jewelry Industry is multifaceted, producing objects of personal adornment, from precious
metals, gems and other materials, subjected to artistic treatment. Within the jewelry industry,
there are two sales categories: costume jewelry and fine jewelry. Costume jewelry has lower
quality, lower price, higher rates of repeat purchase, and is more penetrated by e-commerce.
Fine jewelry makes up to 85% of the total jewelry industry, and is associated with luxury
products.

The economic development of the industry is positively related to the economic cycles and is
subject to the per capita income growth. After the 2008 crisis, the revival of the global economy
positively impacted the market for all kinds of luxury goods, especially jewelry. The global
market is expected to continue to grow in resemblance to recent years, a trend expected to
prevail through the end of 2023.

Despite the upswing of the global economy and its positive impact in the market for luxury
goods, there are new challenges ahead. It is crucial for players to be aware and responsive to
important trends and developments, as consumer behavior changes.

The Jewelry Industry is fragmented, as the 10 largest players only represent 12% of the global
market. It is a primarily local industry, as the rest of the market is composed of strong national
brands and small enterprises. The strongest brands are expected to grow internationally through
acquisitions.

 24
As far as markets are concerned, China is the biggest one, representing 30% of the global
jewelry market, as well as the biggest growing market in the industry, with a CAGR of 15%,
from 2013 to 2018. The Chinese market is followed by India (which is expected to double in
size within the next 5 years), by the USA (whose growth is expected to slow throughout the
next 5 years), and by Europe (a market with steady growth over the years).

Figure 1 indexes the jewelry and watches industry value by 2017, by region.

 4.30% 3.90%

 20.30%

 51.10%

 20.40%

 Asia-Pacific USA Europe Middle East Rest of the World

 Figure 1 - Global Jewelry & Watches Industry value by geographic location, 2017

3.1.1 GROWTH EXPECTATIONS

In the past, the growth of the jewelry industry was driven by the expansion of big established
players (p.e. Cartier and Tiffany’s) and by the entrance of new players in the market (p.e.
Pandora). In contrast, McKinsey predicts that future growth will likely arise from non-jewelry
players entering the market and expanding their supply assortment, namely high-end apparel
players.

From 2017 to 2018, the Industry grew by 7% and, in 2018 it was worth €292 Billion. Studies
point that, by the end of the current decade, the jewelry market will reach a growth of 4% to
10% (Pentago, 2017). Three types of consumers were identified as contributors to this growth:

 1. “New money” consumers, described as consumers whose purchasing power is self-
 acquired (as opposed to inherited) and have the desire to show-off their newly-acquired
 status. There has been an increasing number of high net-worth individuals worldwide.
 2. Emerging market consumers, from countries with emerging economies and increasing
 purchase power, for whom brands inspire a sense of trust and of an upgraded lifestyle.

 25
3. Young customers, who tend to buy branded jewelry to express themselves and sense
 self-realization. There is an increasing inclination of millennials towards fine jewelry.

Allied to these consumers there is the revival of the global economy, with which consumers’
purchase power is increasing. This is associated with Engel’s Law which states that as income
rises, the percentage spent on basic surviving needs (namely food) decreases, whilst the
percentage of income spent on superfluous goods and services increases (namely luxury goods
and entertainment services).

 900.00 20.00%
 CAGR
 800.00
 8.20% 800.20
 700.00 753.20 15.00%
 690.70
 600.00 634.70
 584.60
 500.00 540.40
 10.00%
 400.00
 8.57% 8.82% 9.05%
 300.00 8.18%
 6.24% 5.00%
 200.00

 100.00

 0.00 0.00%
 2017 2018 2019 2020 2021 2022

 Industry Value Growth

 Figure 2 - Expected jewelry and watches industry growth, in USD billion, 2017-2022

3.1.2 INDUSTRY TRENDS

 3.1.2.1 E-Commerce and the Evolving Brick-and-Mortar Store

The percentage of jewelry sold online is relatively small when compared with other retail
categories. In the jewelry industry, e-commerce represents 4%-5% of sales. This value is
expected to increase to 10% by 2020. Associated with the purchase of jewelry there is a sensory
experience – jewelry is a high-involving category and, besides the need for customers to touch
and feel the merchandise, there is a higher reliability associated with brick-and-mortar stores.

Nowadays, omnichannel development has had an increasing importance, as customers are
becoming more demanding for convenience. Omnichannel consists of a marketing approach to
sales via different channels, which aims at providing customers a unique and seamless shopping
experience, either via online shopping or shopping at a brick-and-mortar store, providing
customers an almost immediate product assortment and shopping possibility. Moreover, around

 26
two-thirds of customers rely on social media to guide purchases, from which retailers have been
taking more and more advantage to drive sales.

The landscape is evolving for the traditional brick-and-mortar stores. Both in the apparel and
jewelry industries, mono-brand stores have been gaining ground. For instance, the number of
Pandora stores quadrupled from 200 locations in 2009 to over 800 in 2012. The evolution of
mono-brand stores has occurred at the expense of multi-brand boutiques and department stores
sales. Jewelry players are investing in mono-brand boutiques, and Pandora is not an exception
to the rule. Mono-brand boutiques offer companies the advantage of having greater control over
their brands, and of potentiating profit margins, by being closer to customers.

 3.1.2.2 Conversational Commerce and the Evolving Store

Retail spaces are becoming more than places of transaction. Conversational commerce is on the
rise - consumers expect personalized products and services. Chatbots are increasingly being
adopted to guide customers more efficiently on their shopping journey and to customize
products.

 3.1.2.3 High Demand for Convenience

Convenience is a critical factor increasingly influencing purchasing decisions. Consumers seek
what they need, when and where they want it. The abundance of choice and information
available makes it easier for customers to choose the most convenient option. Hence,
omnichannel has become standard and essential to meet customer demand.

 3.1.2.4 Sustainability on the Rise

Consumer expectations of environmental and social performance continued to grow in 2018.
Young people perceive the private sector as a potential force for positive impact and are aware
of the impact of socially and environmentally-responsible companies in society.

 27
3.1.2.5 Polarization and Hybrid Consumption

The market for jewelry is becoming polarized – while the high and low-end of the market are
growing, the middle-market is stagnating. Thus, fine jewelers may opt between two distinct
strategies – introducing new more affordable product designs, providing the opportunity for
less affluent consumers to enter the brand experience, or play exclusively in the high-end of the
market. In this possibility scenario, Pandora has opted to design affordable jewelry.

There is an increasing number of hybrid consumers which do not fit into any particular
consumer category defined by traditional marketing literature. The hybrid consumer may either
buy low-end or high-end products on differing occasions.

 3.1.2.6 Technology in Jewelry Items

As technology is marking its presence into people’s everyday lives, it is also making its way
into jewelry. Wearable technology design has been growing and smart bracelets and watches
are trending. This is associated with customers’ need for convenience, reflected in the shopping
experience and also in choosing the convenient features attached to wearable technology.

 3.1.2.7 Company Integration

The strongest national brands are expected to grow internationally and become a top brand by
2020 due to industry consolidation, through the acquisition of small local jewelers by
international retail groups. Furthermore, the concept of Industry 4.0 invariably indicates that
supply-chain processes will accelerate, and vertical integration will become increasingly
common, as it is a factor that defines whether companies will survive the current market
dynamics or not.

 28
You can also read