IN FOCUS: DAIRY JANUARY 2019 - Author Phin Ziebell, Senior Economist - Agribusiness - NAB Business Research
←
→
Page content transcription
If your browser does not render page correctly, please read the page content below
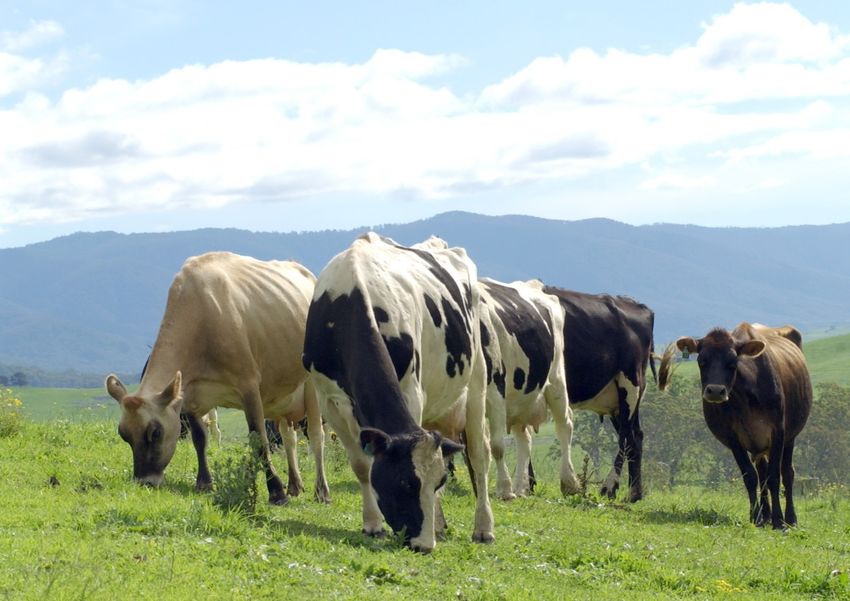
IN FOCUS: DAIRY
JANUARY 2019

Author Phin Ziebell, Senior Economist – Agribusiness
Photo Carl Davies, CSIRO
KEY POINTS
                          Australia’s dairy sector faces a number of cross currents.
CONTENTS                  Farmgate prices are very strong by historic standards, with
                                                                                           GDT AUCTION RESULTS
                          Saputo and Fonterra having both stepped-up to $6.95/kg – a       AUD/tonne
3 | Seasonal conditions                                                                                                Butter
                          level not seen since the heady days of 2013-14. There are,       9000
4 | Regional prices                                                                                                    Cheddar
                          however, four key differences between now and 2013-14 that       8000                        Skim milk powder
5 | Farm inputs
                          make for a very different experience for Australia’s dairy       7000                        Whole milk powder
6 | Livestock
7 | Winter crops          farmers.                                                         6000
8 | Summer crops, sugar                                                                    5000
                          Firstly, input costs are much higher than in previous times.
9 | Rainfall data                                                                          4000
                          NAB’s feedgrain price index for the season to date is around
                                                                                           3000
                          23% higher than the 2013-14 average and temporary water in
                                                                                           2000
CONTACTS                  the Lower Goulburn over 5 times higher. These higher input
                                                                                           1000
                          costs reflect (and are worsened by), the second key difference
Phin Ziebell              – generally poorer seasonal conditions. 2019 was Australia’s        0
Agribusiness Economist                                                                         2010       2012        2014        2016          2018    2020
                          hottest and driest year on record, and while some dairy
+61 (0) 475 940 662       regions, such as western Victoria and parts of Tasmania,
                          escaped the worst, others like northern Victoria, southern       NAB WEIGHTED DAIRY EXPORT PRICES
Alan Oster                                                                                 $/tonne (export price, LHS), AUD/kg milk solids
Group Chief Economist     NSW and subtropical areas suffered heavily.
                                                                                           (farm gate price RHS)
+61 3 8634 2927           Thirdly, global prices are well below their 2013-14 peak, but    6000                                                               8
Dean Pearson              this has been offset by a lower Australian dollar. The AUD
Head of Economics         averaged 91c in 2013-14 but only 68.5c so far this season. Our
                          USD denominated dairy price outlook is essentially neutral                                                                          6
+61 3 8634 2331                                                                            4000
                          and NAB’s house view is that the AUD will only appreciate
                          very modestly, reaching 75c by mid-2022. This should keep                                                                           4
                          AUD dairy export prices elevated, although clearly a global
                          demand or FX shock would upset this.                             2000
                                                                                                               AUD Index (LHS)
                                                                                                                                                              2
                                                                                                               USD index (LHS)
                          Lastly, suppliers are scrambling to offer premiums to                                MG/Saputo milk price (RHS)
                          maintain milk flow, which has been severely constrained by                           Fonterra Australia milk price (RHS)
                                                                                              0                                                               0
                          drought and high input costs. Thus far, high farmgate prices
                                                                                               2010        2012       2014       2016          2018    2020
                          have failed to arrest the fall in Australian dairy production,
                          which is now the lowest since the mid-1990s. In this               Source: Australian Bureau of Statistics, Global
                          environment, increased import competition is a serious risk.       Dairy Trade, Dairy Australia and NAB Group
                                                                                             Economics
 2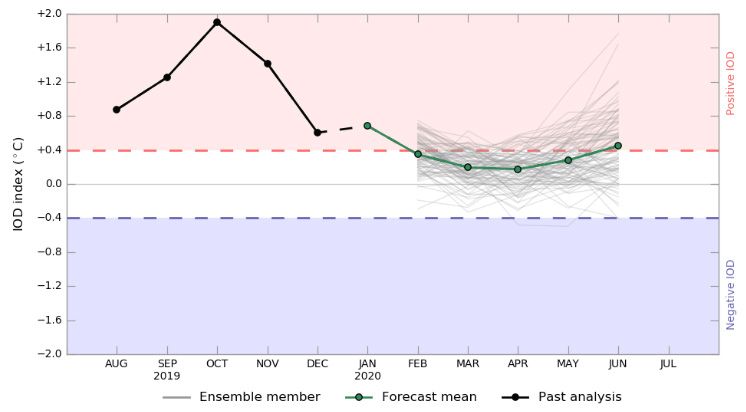
SEASONAL CONDITIONS
Ultimately, the less said about seasonal
conditions in 2019, the better. Nationally,
                                               RAINFALL – 2019                                           RAINFALL OUTLOOK
2019 was rotten – the hottest and driest       Deciles                                                   February to April
year on record with national average
rainfall 40% below average.
The impact of the season on the dairy
industry has been very region specific.
South-west Victoria, south-west Gippsland
and parts of Tasmania enjoyed reasonable
conditions for much of 2019. On the other
hand, East Gippsland was very dry and is
now contending with severe bushfires.
Northern Victoria – which is largely
dependent on irrigation – has faced an
extended period of high water and feed
prices, which has reduced competitiveness      MURRAY DARLING BASIN STORAGE                              BOM INDIAN OCEAN DIPOLE
for the region.                                Level by catchment, 8 January 2020                        Monthly SST anomaly – IOD region
                                               100%                                91%
                                                                                            86%
The 2019-20 bushfire season is
                                               75%
unprecedented and ongoing. Dairy                                             54%      58%
properties have been lost and others are       50%                         44%
                                                                                         36% 39%
                                                                      32%30%
unable to deliver milk due to road closures.
Bega – which operates in the south coast of    25%                  11%
                                                      4% 8% 7% 8% 3%             0%
NSW – announced to the ASX in early             0%
January that milk losses would not
                                                          Lower Murray
                                                           Border Rivers

                                                                 Broken
                                                              Campaspe

                                                            Lower Lakes
                                                      Condamine-Balone

                                                               Goulburn

                                                                  Ovens
                                                          Upper Murray
                                                                 Namoi
                                                                Lachlan

                                                                Loddon

                                                        Murrumbidgee
                                                         Lower Darling
                                                                Gwydir
                                                             Macquarie

materially affect its operations.
The three month outlook coming into
autumn is closer to average, although at
this stage just getting through summer
seems to be the biggest concern.
                                                Source: Bureau of Meteorology, MDBA and NAB Group Economics

 3
FARM INPUTS
                                                                                                                        Farm input prices are unfavourable overall,
NAB FERTILISER INDEX                                      NATIONAL AVERAGE FUEL PRICES                                  although some inputs have provided relief
AUD index                                                 AUc/litre                                                     since last year. Beyond prices, producers in
                                                          180                                             petrol        drought-affected regions have been forced
240
                                                                                                          diesel        to increase volumes.
220
                                                          160
200                                                                                                                     Irrigation-dependent farms in northern
                                                                                                                        Victoria are forced to contend with
180
                                                          140                                                           extremely high temporary water prices.
160                                                                                                                     Zone 3 Lower Goulburn recorded an average
140                                                       120                                                           temporary water price of $664/ML for
120                                                                                                                     January 2020 to date. Prices at this level are
                                                                                                                        a major challenge.
100                                                       100
   2010     2012      2014     2016      2018      2020      2010        2012     2014    2016     2018        2020     Fuel prices offer little excitement, with
                                                                                                                        diesel hovering around $1.50/l for much of
NAB WEIGHTED FEED GRAIN PRICE INDEX                       ENTITLEMENT TRADE PRICES                                      the year. Crude oil prices surged earlier this
AUD/t                                                     $/ML, selected valleys                                        month on Iran tensions, but this looks to
                                                                                                                        have cooled, at least for now. Meanwhile,
400                                                       700                                                           fertiliser prices have fallen substantially in
                                                          600                                                           the past year.
300                                                                                                                     Feed prices remain high, with the NAB feed
                                                          500
                                                                                                                        grain price index averaging $316/t in
                                                          400
200                                                                                                                     January (to date), although this is a good
                                                          300                                                           deal below the high of $386 in October
                                                          200                       3 Lower Goulburn                    2018. Following miserable yields this
100
                                                                                    6 VIC Murray Dart-Barmah            season, we see it hard to see much
                                                          100                                                           downside until there is a good break.
 0                                                         0
  2010      2012      2014     2016      2018      2020         Jul-18          Jan-19        Jul-19           Jan-20

  Source: Bloomberg, Profarmer,
  Department of Agriculture, NAB Group Economics

  4
INTERNATIONAL PRODUCTION TRENDS
Milkflow for major international producers
EU28 MILK PRODUCTION NEW ZEALAND MILK PRODUCTION remains positive, although growth is
Billion litres/month Billion litres/month perhaps slower some had expected. EU28
15 2015 2016 milk production is running at the top of its
3.5
2017 2018
3.0 five year range, as is the United States.
14 2019
2.5 New Zealand – the world’s largest dairy
13 exporter – has seen recent monthly
2.0
1.5
production a little below year-ago levels,
12
although nowhere near enough to cause
1.0
11 concern. New Zealand tends to exhibit very
0.5 little volume risk year to year, with
10 0.0 production increasing most of this century.
New Zealand produced 71% more milk in
2018 than in 2000.
UNITED STATES MILK PRODUCTION WORLD MILK PRODUCTION Fonterra New Zealand’s latest price update
Billion litres/month KT in December 2019 puts its 2019-20 farmgate
9 milk price forecast at NZD7.00-7.60/kg milk
700000 solids. The low NZD – currently around 66
8.5 600000 US cents – has been favourable to NZ dairy
500000
prices. Our forecasts point to the NZD
8
reaching 70 US cents by mid-2022.
400000
7.5 Global dairy demand growth has been
300000
7
supportive of prices and we see Chinese
200000 dairy demand growth as likely to continue.
6.5 100000
6 0
2000 2005 2010 2015 2020
Source: European Union, Eurostat, ABARES, USDA, DCANZ and NAB Group Economics
5AUSTRALIAN PRODUCTION TRENDS
Australian milk production continues to
MONTHLY MILK PRODUCTION ANNUAL MILK PRODUCTION suffer following the 2016 farmgate price
Billion litres/month Billion litres/annum crunch, followed by a brief reprieve in 2017
1.2 12 and then two seasons of high feed and
1 10 water costs.
0.8 8
2018-19 milk production fell to just under
8.8 billion litres – the lowest since 1995-96.
0.6 6 Dairy Australia’s latest forecasts point to
0.4 production in the order of 8.3-8.5 billion
2015 2016 2017 4
litres this season.
0.2
2018 2019 2 What is needed to arrest falling production
0
0 is a better season easing input costs, but
1970 1980 1990 2000 2010 2020 our longer term concern is that an increase
in permanent plantings (e.g. almonds) in
STATE SHARE OF AUST. PRODUCTION AUSTRALIAN DAIRY EXPORT VOLUME the Murray Darling basin will structurally
% share KT by destination increase the price of water in northern
100%
250 Victoria. In the absence of lower water costs
it is unlikely that northern Victorian
80% 200 production can grow.
60% 150 Tasmania is an ongoing success story – the
state’s share of national milk production has
40% 100 almost doubled to 10% over the last two
decades. A mild climate combined with
20% 50 ample water availability has made dairy a
compelling proposition in the state.
0% 0
1980 1990 2000 2010 2000 2005 2010 2015 2020
NSW VIC QLD SA WA TAS China Japan Korea Other
Source: ABARES, European Union and NAB Group Economics
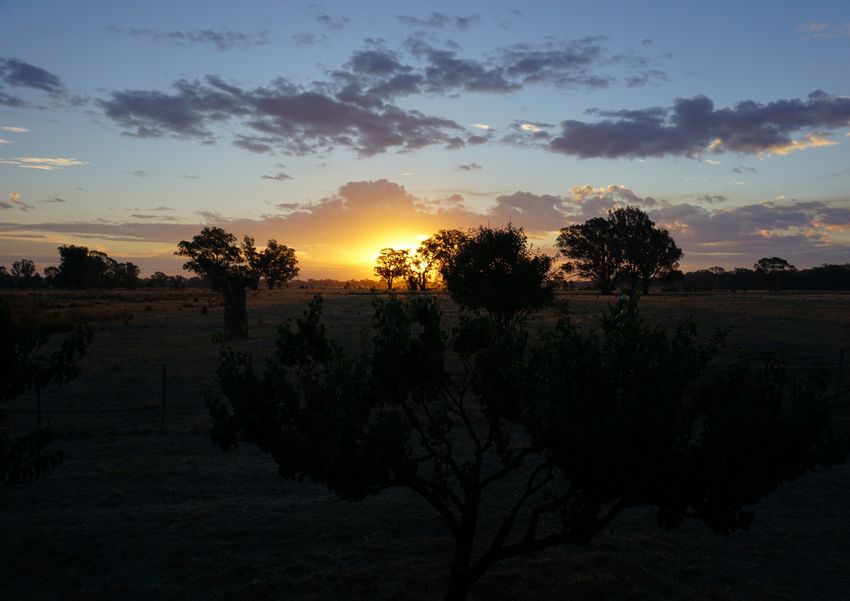
6Sunset at Euroa, Victoria | Photo Mai Thai
Important Notice
This document has been prepared by National Australia Bank Limited ABN 12 004 044 937 AFSL 230686 ("NAB"). Any advice contained in this document has been prepared without taking into account your objectives,
financial situation or needs. Before acting on any advice in this document, NAB recommends that you consider whether the advice is appropriate for your circumstances.
NAB recommends that you obtain and consider the relevant Product Disclosure Statement or other disclosure document, before making any decision about a product including whether to acquire or to continue to
hold it. Please click here to view our disclaimer and terms of use.You can also read