IN THE SHADOW OF HAPPINESS - Nordic Council of Ministers
←
→
Page content transcription
If your browser does not render page correctly, please read the page content below

ANALYSIS NO. 01/2018

IN THE
SHADOW OF
HAPPINESS
                       People in the Nordic region are generally happier
                       than people in other regions of the world, but
                       despite this there are in fact also people in
                       Denmark, Finland, Iceland, Norway and Sweden
                       who report to be struggling or even suffering. This
                       report investigates who is unhappy in the Nordic
                       countries, and the circumstances of life that lie
                       behind this.
In the Shadow of Happiness
Ulf Andreasson

ANP 2018:799
ISBN 978-92-893-5739-5 (PRINT)
ISBN 978-92-893-5740-1 (PDF)
ISBN 978-92-893-5741-8 (EPUB)
http://dx.doi.org/10.6027/ANP2018-799

© Nordic Council of Ministers 2018

Layout: Mette Agger Tang/Jette Koefoed
Photos: Unsplash.com
Print: Rosendahls

Printed in Denmark

Nordic co-operation
Nordic co-operation is one of the world’s most extensive forms of regional
collaboration, involving Denmark, Finland, Iceland, Norway, Sweden,
the Faroe Islands, Greenland, and Åland.

Nordic co-operation has firm traditions in politics, the economy, and culture.
It plays an important role in European and international collaboration, and
aims at creating a strong Nordic community in a strong Europe.

Nordic co-operation seeks to safeguard Nordic and regional interests and
principles in the global community. Shared Nordic values help the region
solidify its position as one of the world’s most innovative and competitive.

Nordic Council of Ministers
Nordens Hus
Ved Stranden 18
1061 Copenhagen K
www.norden.org

Download Nordic publications at www.norden.org/nordpub

IN THE
SHADOW OF
HAPPINESS

4

Contents

7    Foreword

8    Summary

11   Introduction

14   The less happy Nordic region

17   The anatomy of unhappiness

28   Consequences of unhappiness

31   The Nordic perspective

32   Bibliography

34   Appendix 1: Method

36   Appendix 2: Analysis

41   Appendix 3: Probability of experiencing
     symptoms of depression in the case of
     unemployment

                                               5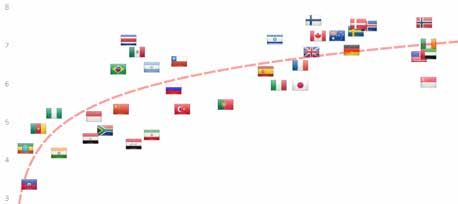
”
For several reasons, it is
a good idea to discuss
how to reduce the
number of people who
find themselves to be
struggling or suffering.
Foreword

This report is about happiness in the Nordic region. However, it differs
from other reports and articles in recent years, which have been practically
unanimous in claiming that people in the Nordic region are happy. It is
certainly true that we, in this region, are happier than people in other regions
of the world – for the vast majority, the Nordic countries are good places
to live. However, this does not mean that every single individual is happy.
There are also those who report to be struggling or even suffering when they
evaluate their own lives.

The overall aim of this report is to provide a more nuanced picture of
“the Happy Nordic region”, and to learn more about those in the Nordic
communities who report to be unhappy. In addition, the report provides an
indication of the reasons why happiness is so unevenly distributed.

For a long time, welfare and quality of life have been measured using various
economic indicators. Gross domestic product, in particular, has been the
prevailing measure. In recent years, however, other ways of measuring
welfare have attracted attention with, in particular, an increasing interest in
indicators of subjective well-being.

It may not be the responsibility of states and civil societies alone to ensure
that all citizens are happy, but for several reasons it is a good idea to discuss
how to reduce the number of people, who find themselves struggling or
suffering.

The report is mainly authored by Michael Birkjaer from the Happiness
Research Institute, at the request of the Secretariat to the Nordic Council
of Ministers. It has been edited by Ulf Andreasson and Truls Stende at the
Secretariat’s Policy Analysis and Statistics Unit. The report is part of a series
produced by the unit that highlight current topics from a Nordic perspective.

Copenhagen, May 2018

Dagfinn Høybråten
Secretary General
Nordic Council of Ministers

                                                                                    7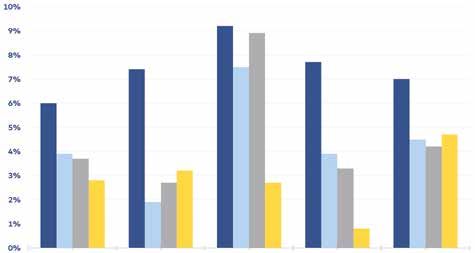
Summary
    Since 2012, both the UN and the OECD have chosen to record progress in
    well-being, in addition to gross domestic product (GDP), as a measure of a
    country’s level of welfare. Studies of happiness rely on asking people about
    how they feel, rather than drawing conclusions on the basis of their income
    levels.

    This report is about both happiness and unhappiness in the Nordic countries.
    The study shows that in this region of the world we are indeed happier than
    people of other regions; but there are also those who, when evaluating their
    own lives, report to be struggling or even suffering. This report analyses, which
    factors are the most significant in determining why some people in the Nordic
    region are happy, while others are not. We also map the characteristics of
    people who are struggling or suffering.

    In the five Nordic countries it is the norm for people to report 7, 8 or 9 when
    evaluating life satisfaction on a scale from 0 to 10. A value of less than 7 can
    therefore be seen as a deviation. From a Nordic perspective, it therefore makes
    sense to use the following three categories for subjective well-being:

    Thriving: Those who score between 7 and 10
    Struggling: Those who score between 5 and 6
    Suffering: Those who score between 0 and 4

    In this report, these three terms are used to describe the subjectively
    experienced degree of happiness or unhappiness.

    The analysis includes common demographic variables such as gender and
    age. In addition, we test for the circumstances of life that are most closely
    associated with struggling and suffering in the Nordic countries, such as lack
    of social contact, poor mental health, poor general health and unemployment.

    The underlying reasons why someone is struggling or suffering are of course
    unique to that person. However, the results across the Nordic countries show
    that there are many systematic concurrences and similarities, which may
    indicate that there are also certain social structures that adversely affect
    people’s lives.

    The main conclusions of the study are:

    •   Happiness is unevenly distributed in the Nordic countries. A great many
        people in the Nordic countries experience a high level of well-being, but at
        the same time, 12.3 percent of the total population in the Nordic region are
        struggling or suffering.

    •   A significant proportion of young people are struggling or suffering. In
        the 18–23 age group, 13.5 percent are struggling or suffering in the Nordic
        countries. A higher proportion is found in only one other age group, namely
        those over 80 years of age.

8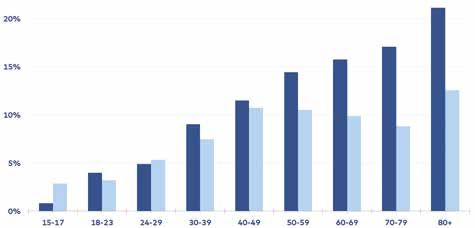
•   Inequality in well-being in the Nordic region correlates strongly with
    inequality in health. General as well as mental health is much more closely
    associated with inequality in well-being than other circumstances of life, such
    as employment or income levels.

•   General health ranks highest on the Nordic list of life circumstances most
    closely associated with being unhappy. In this respect the Nordic countries
    deviate from the United States, Australia and the United Kingdom, where
    mental illness tops the list. In the Nordic region, it is predominantly older
    people who experience failing health.

•   Mental health is the second most important circumstance of life associated
    with happiness and unhappiness. Problems of mental health most often
    affect young people, particularly young women. The proportion of young
    people who feel depressed varies between the Nordic countries, but the
    overall pattern is that young women are more often affected than young
    men. A rise in poor mental health has also been observed in recent years
    among young people generally, both women and men.

•   Top incomes protect against dissatisfaction and unhappiness. Inequality in
    income ranks as the third most important circumstance of life explaining why
    some people struggle or suffer, but it is important to note that the effect is
    only found for the 10 percent of the population in the highest income group –
    i.e. if you belong to the 10 percent with the highest income, you have less risk
    of struggling or suffering.

•   Unemployment is associated with struggling and suffering, especially
    for men. After poor general health, poor mental health, and income,
    unemployment is the next most decisive circumstance of life associated
    with struggling or suffering in the Nordic countries. Struggling or suffering
    is far more common among unemployed people than among people in
    employment. Every third person without a job is struggling in the Nordic
    countries, while this is true of every tenth person among the employed. Well-
    being issues relating to unemployment apply particularly to men, who are
    more likely to experience mental health problems when unemployed.

•   Lack of social contact is a greater problem for men. In almost all age groups,
    men – particularly older men – are less socially active, which is a factor
    associated with unhappiness.

•   Very religious people are happier. In all of the Nordic countries, very religious
    people are more happy than others. No differences in levels of well-being are
    observed when comparing atheists and the moderately religious people.

•   Unhappiness is very costly for society. The fact that a growing number of
    people are struggling or suffering has socioeconomic consequences. The
    problem is particularly associated with absence from work due to illness, low
    productivity and the consumption of health services.

•   Inequality in well-being challenges the high level of trust in the Nordic
    countries. Lack of trust correlates strongly with inequality in well-being. If
    inequality in well-being grows, it could have serious consequences for the level
    of trust between people as well as for social cohesion.

                                                                                        9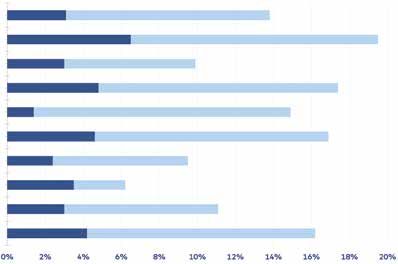
10
Introduction
Since the Bretton Woods Conference in 1944, it has been common practice                     There has been a change
to interpret an increase in a country’s gross domestic product (GDP) as                     in the way we measure
the equivalent to an increase in the welfare and development of a country.                  well-being, in which we are
However, within the past few years a new approach has been adopted to                       now more likely to include
                                                                                            subjective experiences of
determine the level of progress: Since 2012, both the UN and the OECD have
                                                                                            happiness and quality of
chosen to break with the historic one-dimensional economic approach, and
                                                                                            life.
have instead chosen to include progress in subjective well-being as a measure
of a country’s welfare and development. These calculations are based, inter
alia, on the population’s subjective experience of happiness and quality of life.

The then Secretary-General of the UN, Ban Ki-Moon, promoted Gross National
Happiness as a benchmark for a country’s welfare.1 Similarly, the Secretary-
General of the OECD, Àngel Gurría, has pointed out that the ultimate goal for
politics should be to increase quality of life for human beings.2

When we speak of – and measure – quality of life, a variety of terms are
often used: happiness measures, subjective well-being measures, quality of
life measures, etc. These concepts overlap, but they can also be perceived in
slightly different ways: Most people would probably think of being happy as
something rather more powerful and emotional than having a high level of
quality of life. It is thus difficult to reduce subjective well-being or happiness to
a single phenomenon, which is why happiness is also called an umbrella term –
it covers several different concepts.

In international happiness research, there is considerable consensus on
distinguishing between three dimensions of subjective well-being:3

•     Life evaluation: How happy or satisfied you are with life in general.
•     Affect: How happy or unhappy you are at the moment or over a brief
      period of time.
•     Eudaimonia: How meaningful you perceive life to be or the extent to which
      you feel you are fulfilling your potential as a human being.

This report uses a data set drawn from the European Social Survey (ESS),
which has asked respondents the following: How satisfied are you with life? The
responses were given on a scale from 0–10. The definition used in this report
thus lies within the first of the three categories – life evaluation – which is the
most frequently-used and reliable dimension in happiness research, and the
dimension that produces the most research results.4

In the next chapter, The Less happy Nordic region, we will define the concepts of
thriving, struggling and suffering, which are used in this report to describe the
degree of well-being and happiness as subjectively experienced.

1
    UN NEWS (2012): Ban: new economic paradigm needed, including social and environmental
progress.
2
    OECD (2017): Better Life Initiative – Measuring well-being and progress.
http://www.oecd.org/sdd/OECD-Better-Life-Initiative.pdf
3
    OECD (2013): Guidelines on Measuring Subjective Well-being.
4
    Ibid.

                                                                                                                          11
The Nordic countries – the happiness superpowers?
The Nordic countries are Nordic Countries Are The Happiest In The World writes Forbes Magazine, Can
consistently ranked among we be as happy as Scandinavians? asks the BBC, and Want to be Happy – Try
the ten happiest countries moving to Finland suggests the New York Times. The fact that Denmark,
in the world. Finland, Iceland, Norway and Sweden top the world rankings year after year
in happiness, according to the most recognised international rankings, is
something that attracts attention and makes headlines.5 In the latest edition
of the UN’s World Happiness Report, OECD’s Better Life Index and Social
Progress Index from The Social Progress Imperative, the Nordic countries are
consistently ranked among the top ten countries in the world.6 See Table 1.
The Nordic countries are also among the world’s richest countries, and material
prosperity is, not surprisingly, a prerequisite for well-being. But there are
countries in the world that are both richer than the Nordic countries and at the
same time less happy, as can be seen in Fig. 1. The figure shows the correlation
between GDP per capita and happiness level. The red dotted line shows the
average correlation; countries above the line are thus happier than would
be predicted by their GDP. The Nordic countries are in other words good at
converting wealth into well-being, by comparison with the rest of the world.
The figures are based on the most recent annual data.
GDP affects the national For the first time, in 2018, Finland has come out top of the list of the world’s
level of happiness, but all happiest countries in the United Nations’ World Happiness Report, despite the
of the Nordic countries fact that Finland’s GDP lies significantly below the level of the other Nordic
perform better in terms of countries, as well as that of, for example, Germany and the United States. In
well-being than would be fact, all of the Nordic countries perform better in terms of subjective well-being
expected from their GDP
than one would expect from their GDP levels alone.
levels alone.
There are very limited gains to be harvested in terms of well-being in the other
Nordic countries if we focus exclusively on economic growth, as measured
in GDP (see Appendix 2, point A). In Norway, for example, a GDP growth of
70 percent would be required to boost the level of subjective well-being by 5
percent, if economic growth, measured in GDP, were the sole tool that could be
used.7
Studies show that Nordic Why is it that people in the Nordic countries are so happy? Studies show that
happiness can be explained this is largely due to the ability of the Nordic model to create a framework for
by their social security ‘the good life’: a safety net that creates security, free education, and a sensible
safety net, free education balance of work and leisure time that allows people to enjoy both their work
and a sensible balance
and their family life.8
between work and leisure.
5
The Nordic countries top the list in the surveys that ask for a respondent’s own subjective
evaluation of his or her overall satisfaction with life. In measurements of affective happiness – a short-
lived emotional state – the Nordic countries typically rank lower than e.g. Latin American countries.
See for example Gallup (2017), Global Emotion Report.
6
Both the World Happiness Report and the OECD Better Life Index base their ratings on subjective
well-being measures. The Social Progress Index, on the other hand, is an index that is composed of
more objective goals, such as access to education, average life expectancy, health, etc.
7
The calculation is based on the data available online in the World Happiness Report 2018 and key
economic figures for 2017 from the IMF.
8
OECD (2017): Better Life Index.
12Nonetheless, despite the fact that we in the Nordic countries consistently
top the international rankings of subjective well-being and satisfaction with
life, many Danes, Finns, Icelanders, Norwegians and Swedes still experience
that they are struggling or suffering (i.e. the opposite of happiness). The aim
of this report is to illuminate the inequality of subjective well-being in the
Nordic region, dig slightly deeper than the international happiness rankings
based on average calculations, and try to identify those who find themselves
at the bottom of the well-being ladder. Who are the unhappy? What are
the circumstances of lives associated with unhappiness? And what are the
broader social consequences of these people struggling or suffering?
Table 1
World Hapiness Report OECD – Better Life Social Progress Index
Top 10, World
2018 Index 2018 2017
Happiness Report,
Finland Norway Denmark Better Life Index and
Norway Denmark Finland Social Progress Index
Denmark Australia Iceland
Iceland Sweden Norway
Switzerland Canada Switzerland
Netherlands Switzerland Canada
Canada Iceland Netherlands
New Zealand USA Sweden
Sweden Finland Australia
Australia Netherlands New Zealand
Figure 1
Relationship between
Average quality of life
GDP and level of well-
being, 2017
Source: The Happiness
Research Institute, on
the basis of quality of
life data from the Gallup
World Poll and key
economic figures from
GDP per capita in US dollars (PPP) the IMF.
13The less happy Nordic region
The increasing focus on subjective well-being and happiness in the Western
world has produced an increased need for more nuanced methods of
measuring a country’s development. This has resulted, inter alia, in the Better
Life Index published by the OECD in 2012, the same year that the United
Nations published the first World Happiness Report.
Both the World Happiness Report and the Better Life Index rank the well-
being of populations on the basis of national averages. The average level of
subjective well-being tells us something about the overall level of well-being
in a country, but it does not give us any insight into how that well-being is
distributed.
There is no single recognised standard for measuring inequality of well-being,
partly because research in unhappiness has only recently been given attention,
and perhaps also partly because inequality in well-being is a slightly more
complex concept than average happiness.
12.3 percent of the In 2016, the World Happiness Report became the first report to present a global
population of the Nordic index of inequality in well-being in more than 150 countries. It revealed that
countries describe inequality in well-being is on the rise in Denmark and Sweden, but is falling in
themselves as struggling Finland and Norway – and has also diminished considerably in Iceland.
or suffering. The largest
proportion is found in
In this report, we relate to inequality in well-being by analysing ‘proportions’
Sweden, and the smallest
(see Appendix 1). In the five Nordic countries, it is normal for people to report
in Denmark. Inequality in
7, 8 or 9 when life satisfaction is evaluated on a scale from 0 to 10. A value of
well-being is increasing
less than 7 is therefore viewed as a deviation. With this in mind, we consider it
in Denmark and Sweden,
and decreasing in Finland, meaningful from a Nordic perspective to utilise the following three categories
Iceland and Norway. of quality of life:
Thriving: Those who score between 7 and 10
Struggling: Those who score between 5 and 6
Suffering: Those who score between 0 and 4
This tripartite breakdown of categories is also applied to several other
countries by, for example, the Gallup World Poll.9
As Table 2 shows, struggling and suffering are not as widespread in the Nordic
region as, for example, in France, the UK, Germany and especially Russia, where
over half the population report to be struggling or suffering.
But although dissatisfaction and unhappiness is not as common in the Nordic
countries as in many other countries, well-being inequality should not be
disregarded nor ignored. 12.3 percent of the people in the Nordic region are
not thriving, which is a significant proportion (this is the total percentage
of those who report to be struggling or suffering). The figures range from
Denmark, where about 8 percent are struggling or suffering, to Sweden, where
the proportion is almost twice as great – almost 15 percent. If to this we
9
Gallup (accessed April, 2018): Understanding How Gallup uses the Cantril Scale.
14add the fact that a large proportion of young people report to be struggling
or suffering, then there is further cause for concern. We will examine this
phenomenon more closely in the following chapter.
Table 2
Suffering (0–4) Struggling (5–6) Thriving (7–10)
Distribution of people
Whole Nordic 3.9% 8.4% 87.7% suffering, struggling and
region thriving, 2012–2016
Denmark 3.0% 5.1% 91.9%
Source: The Happiness
Finland 3.6% 7.9% 88.5%
Research Institute, on
Iceland 4.1% 8.5% 87.3% the basis of data from
Norway 3.9% 9.3% 86.8% the European Social
Survey.
Sweden 4.6% 10.3% 85.1%
Netherlands 4.3% 8.0% 87.7%
Switzerland 4.7% 8.3% 87.0%
Germany 8.3% 14.2% 77.5%
United Kingdom 9.6% 15.5% 74.9%
France 17.0% 23.4% 59.6%
Russia 26.9% 34.7% 38.4%
1516
The anatomy of unhappiness

In this chapter we will examine which factors are the most significant in
determining why some people in the Nordic region thrive, while others struggle
or suffer. We will also analyse which groups most often experience that they
are struggling or suffering, and look at differences across gender, age and
employment status.

In order to answer the question of which circumstances of life are the
most significant for struggling or suffering in the Nordic countries, we have
conducted a regression analysis. In this analysis we have included common
demographic variables, and we have also aimed to test areas that are often
highlighted in happiness research as factors that affect subjective well-being,
such as social contact, mental health, general health and employment. For
more details, see Appendix 2, point B.

It is important to note that the life circumstances we find associated with                          It can be difficult to say
struggling or suffering do not reveal a particular causality, thus we cannot                         what is a cause of people
determine whether, for example, poor physical health causes people to be                             feeling they are struggling
struggling or suffering, or conversely, whether it is because they are struggling                    or suffering, and what
                                                                                                     is a consequence. We
or suffering that they experience poor physical health. We can only determine
                                                                                                     can only say that there
that there is a correlation between these factors.
                                                                                                     is a correlation between
                                                                                                     factors.
In many cases we could assume that there is an effect that goes both ways.
In the correlation between illness and unhappiness, for example, it would
intuitively make sense to assume that a severe bout of illness could give rise
to unhappiness for the person concerned. However, in recent years, increasing
evidence has been found for the reverse causality: We see for example that
happy people live longer,10 and that health can be adversely affected by poor
well-being through the effect of stress hormones and chronic inflammation.11
In order to understand the precise relationships between circumstances of life
and subjective well-being, further research is required.

Where are struggling and suffering most widespread?
Before we look at which circumstances of life are most closely associated with
struggling or suffering, we will first present an overview of which demographic
groups mainly report to be struggling and suffering, examining variations
between countries, age and gender.

A common pattern in happiness research worldwide is that a person’s
subjective well-being and quality of life, measured over an entire lifespan on
average, is formed like that of a U-shaped graph.12 In other words, youth is the
happiest time of our lives, after which many people experience a mid-life crisis,
until well-being rises as we move into old age.

10
     Steptoe, A. et al. (2011): Positive affect measured using ecological momentary assessment and
survival in older men and women.
11
     What Works Well-Being (2017): Measuring Well-Being Inequalities: A How-To Guide.
12
     Helliwell et al. (2015): World Happiness Report 2015.

                                                                                                                                   17
However, this pattern is currently being challenged, the explanation for which
can partly be found in the happiness levels of young people, see Fig. 2.
13.5 percent of young Fig. 2 shows that 13.5 percent of young people in the 18–23 age group in the
people in the 18–23 Nordic region belong to the categories ‘struggling’ and ‘suffering’. This makes
age group report to be this age group the second most vulnerable in the region.
‘struggling’ or ‘suffering’.
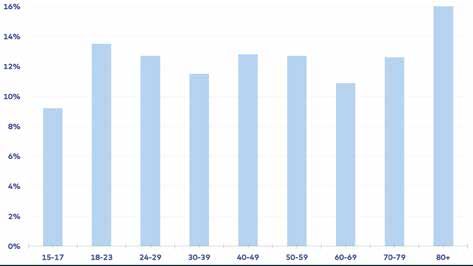
Only the age group over Young women are more likely to be struggling than young men, see Fig. 3. The
80 years of age records
figure shows that the situation is worst in Sweden, where 6.5 percent of young
higher rates.
women report to be suffering and 13 percent are struggling. Adding these two
figures gives a total of 19.5 percent – almost every fifth young woman. Among
young Swedish men, the figures are 3.1 percent suffering and 10.7 percent
struggling, respectively. The most marked gender difference is found in Iceland,
where more than three times as many young women report to be suffering,
compared to young men. The only country that does not fit this pattern is
Denmark; here there are still more young women than young men who are
suffering (3.3 percent compared to 2.4 percent of young men), but there are
significantly fewer young women (2.7 percent) than young men (7.1 percent)
who are struggling.
In our analysis, we also find a number of relevant results that we will not
address further in this report:
• There are no differences between the happiness levels of people in the
cities and in the countryside.
• Pensioners in the Nordic region are less likely to be struggling or suffering
than people in the labour market.
• People in the Nordic region who live with a partner are in less risk of
struggling or suffering.
• Ethnic minorities are less happy than the majority population.
Circumstances of life most closely associated with
struggling or suffering
The circumstances of life When all of the variables (life circumstances) are tested in relation to their
most often associated with explanatory power for states of struggling or suffering, we find a number
struggling or suffering are of significant relations. Life circumstances such as poor general health, poor
poor general health, poor mental health, income, unemployment, limited social contact and religiosity all
mental health, inequality play a role. However, some factors are far more significant than others. Table 3
of income, unemployment
lists the life circumstances that are most closely associated with struggling or
and limited social contact.
suffering in the Nordic region.
The table shows that the factor most closely associated with struggling and
suffering is poor general health, followed by poor mental health. An explanation
of the Nordic figures and a related analysis may be found in Appendix 2, section C.
Table 4 on page 21 shows the corresponding rankings for important life
circumstances in other countries (USA, Australia, the UK and low-income
countries), where other studies13 have used the same method as we use in this
report. It is apparent from the table that, as in the Nordic countries, mental
health problems are among the circumstances of life most closely associated
with the states of struggling and suffering in many other countries.
13
The Global Happiness Council (2018): Global Happiness Policy Report.
18Figure 2
Proportion of people
who are struggling or
suffering in the Nordic
countries (across age
groups), 2012–2016
Source: The Happiness
Research Institute, on
the basis of data from
the European Social.
Survey.
Figure 3
Sweden, men
Proportion of young
Sweden, women people (18–23) who are
Norway, men
struggling or suffering
in the Nordic countries
Norway, women
(both genders),
Iceland, men 2012–2016
Iceland, women
Source: The Happiness
Denmark, men
Research Institute, on the
Denmark, women basis of data from the
European Social Survey.
Finland, men
Finland, women
Suffering
Struggling
Table 3
Top 5 in the Nordic region
Circumstances of life
1 Poor general health most closely associated
with struggling or
2 Poor mental health suffering, 2012–2016
3 Inequality of income
Source: The Happiness
4 Unemployment Research Institute.
5 Limited social contact
19Health divides people in the Nordic region – more than
anything else
Across all the Nordic countries, inequality in general health and mental health
are the most crucial factors determining why some people thrive and others
are struggling or suffering. Mental health, here, is not included in general
health.
In relation to general health, it is – perhaps unsurprisingly – the ageing part of
the population in the Nordic countries, who most often experience problems
with their health. However, there are some rather interesting differences
between the various countries. In Finland, for example, more elderly people
report poor health compared with the other Nordic countries (fig. 4.).
9.5 percent of Finns in the 70–79 age group report that they have poor health,
and for the oldest group (80+) the figure is 15.1 percent. By comparison,
the figures for Norway are 7.5 percent and 11.4 percent respectively, and for
Denmark 4.4 percent and 10.6 percent.
But while Finland has more older people who report poor health than the other
Nordic countries, the contrary is true of the other age groups: the proportion
of Finns in the age groups from 15 and up to 59 who report poor health is
lower than in the other Nordic countries. For example, only 0.5 percent of the
youngest group (15–17) report poor health in Finland, while the numbers vary
between 1.9 percent and 2.8 percent in the other Nordic countries.
Women more often report Another interesting observation is that women more often report poor
poor health than men, health than men (see Fig. 5). This is particularly true in Denmark, Norway and
especially in Denmark, Sweden, while the difference is relatively small in Iceland. In Finland, there is no
Norway and Sweden. difference. There is a striking disparity between these figures and the numbers
for average life expectancy. Men in the Nordic region generally report better
health, yet the life expectancy of Nordic men is significantly lower than that
of Nordic women.14 The explanation for this paradox is complex, and may be
found in such factors as biology, lifestyle and use of the health services.15
The fact that general health problems are so closely linked to dissatisfaction and
unhappiness in the Nordic region comes as no surprise. An earlier international
study has for example shown that a chronic disease, such as psoriasis, affects
a person’s quality of life more in generally happy countries, such as Denmark
and Norway, than in less happy countries, such as Russia and Brazil.16 There are
several hypotheses as to why this is the case, but a common explanation is that
concerns about violence, crime and the risk of poverty are limited in the Nordic
communities, for which reason health concerns tend to take up more of people’s
awareness, and therefore also have a greater negative effect on well-being.17
The results relating to mental health are consistent with the results of
international studies. In the Global Happiness Policy Report 2018, the authors
collected data from all countries of the world and assessed which life
circumstances caused most unhappiness among people. The report concludes
14
Nordic Co-operation (accessed May 2018): Life expectancy.
15
National Institute of Public Health (2007): Report on Public Health.
16
Happiness Research Institute & Leo Innovation Lab (2017): World Psoriasis Happiness Report.
17
Ibid.
20Table 4
USA Australia United Kingdom Low-income
Top 4 relevant life
countries
circumstances
1 Poor mental Poor mental Poor mental Inequality of
worldwide
health health health income
2 Inequality of Poor general Poor general Poor mental Source: The Global
income health health health Happiness Council
3 Unemployment Inequality of Inequality of Poor general (2018): Global Happiness
income income health Policy.
4 Poor general Unemployment Unemployment Unemployment
health
Figure 4
Proportion reporting
poor or very poor
general health (across
countries and age
groups), 2012–2016
Source: The Happiness
Research Institute, on
the basis of data from
the European Social
Survey.
Denmark
Finland
Iceland
Norway
Sweden
Figure 5
Proportion of men and
women experiencing
poor or very poor
general health,
2012–2016
The Happiness Research
Institute, on the basis of
data from the European
Social Survey.
Men
Women
Denmark Finland Iceland Norway Sweden
21that even in countries where inequality of income is significantly higher than in
the Nordic countries – such as the United States, Australia and the UK – mental
health problems are the most important factor determining whether or not
you feel you are thriving. Only in low-income countries does inequality in income
have a greater impact, but even here, mental health remains the second most
decisive life circumstance.18
The mental health In general, the mental health state of young people in the Nordic region has
conditions of young people generally worsened.19 In Norway, for example, an increase of 40 percent was
in the Nordic region have seen over a five-year period in the proportion of young people seeking help with
generally worsened, and mental health problems.20 In Denmark, 18.3 percent of young people between
are manifested as stress, 16 and 24 years suffer from poor mental health. This number comprises an
depression, anxiety, self- average of the 12.9 percent recorded for men and as many as 23.8 percent for
harm, consumption of
women.21
antidepressants and, in
extreme cases, suicide.
Mental health problems among young people manifest themselves in the form
of stress, depression, anxiety, self-harm, consumption of antidepressants
and, in extreme cases, suicide. The latter is a particularly big problem in
Finland, which otherwise ranks as the happiest country according to the World
Happiness Report 2018. Here, suicide is responsible for one-third of all deaths
among 15–24 year olds.22
In relation to symptoms of depression, we find a very significant gender
difference in this study: Iceland has the highest proportion of young women
who feel depressed (9.2 percent), while the lowest level was recorded in
Denmark (6 percent). See Fig. 6. For young men the numbers are consistently
lower, ranging from 0.8 percent in Norway to 3.9 percent in Sweden. See Fig. 7.
Only top incomes protect against unhappiness
On a global scale, the On a global level, income is the factor that best explains the difference
factor that best accounts between happy and unhappy populations,23 but in the Nordic countries, income
for the difference between differences do not play as crucial a role in people’s subjective well-being.
happy and unhappy Inequality of income ranks as the third most crucial life circumstance explaining
populations is income. why some people struggle or suffer, but it is important to note that the effect
is found only among the 10 percent of the population in the highest income
group – i.e. if you belong to the 10 percent with the highest incomes, you have
less risk of reporting to be struggling or suffering. However, no significant
The richest groups are difference was recorded between whether people who were struggling or
rarely afflicted with suffering had an income in the lowest 10 percent or near the median income.
dissatisfaction and Consequently, we cannot draw the conclusion that the higher your income, the
unhappiness. less unhappy you are likely to be; we can only say that people in the wealthiest
segment seldom report that they are struggling or suffering.
18
The Global Happiness Council (2018): Global Happiness Policy Report.
19
Ibid.
20
Reneflot, A. et al. (2018): Psykisk Helse i Norge.
21
SDU (2017): Den Nationale Sundhedsprofil.
22
Nordic Council of Ministers, Nordic Centre for Welfare and Social Issues (2016): Mental health
among youth in Finland: Who is responsible? What is being done?
23
Helliwell et al. (2018): World Happiness Report 2018.
22Figure 6
Women: Proportion
often or always feeling
depressed (by country
and age), 2012–2016
Source: The Happiness
Research Institute, on
the basis of data from
the European Social
Survey.
15–23
24–39
Denmark Finland Iceland Norway Sweden 40–59
60+
Figure 7
Men: Proportion often
or always feeling
depressed (by country
and age), 2012–2016
Source: The Happiness
Research Institute, on
the basis of data from
the European Social
Survey.
15–23
24–39
Denmark Finland Iceland Norway Sweden 40–59
60+
23Inequality of income is however strongly linked to inequality in health. There
are significant health differences between people with low, middle and top
incomes, with both a higher mortality rate and a higher rate of disease among
the poor.24 In Norway and Finland, this type of social inequality is further
impacted by the fact that higher-income people make greater use of the health
services.25
The unemployed are more likely to be struggling or
suffering, particularly men
After poor general health, poor mental health and income, unemployment is
the next most decisive circumstance of life associated with struggling and
suffering in the Nordic countries. The majority of Nordic people spend most of
their lives working. It is therefore hardly coincidental that employment plays
such an important part in the well-being of the individual, which is also one of
the most robust findings in happiness research in general.26
Chronic unemployment is associated with a large degree of unhappiness to
which it is hard to adapt. If people are unemployed over an extended period
of time, their level of subjective well-being remains low even after they regain
employment; their well-being becomes permanently marked by the experience
of unemployment.27
Part of the explanation of why the unemployed are likely to be unhappy may be
attributed to poor mental health. Unemployment is associated with stress, and
although having a job is not in itself a guarantee of being stress-free, there are
particularly large health problems related to the group of unemployed.
Chronic unemployment Fig. 8 shows that there is significant inequality in subjective well-being between
is associated with a large the employed and unemployed (especially the chronically ill and disabled) in the
degree of unhappiness. Nordic region. The figure shows that the unemployed are more often unhappy
Every third person in all Nordic countries, surpassed only by people with chronic illnesses or
involuntarily without work
disabilities. 12.8 percent of the unemployed fall within the category suffering,
is not thriving in the Nordic
while 19.6 percent fall within the category struggling. Almost every third person
countries.
without a job is thereby ‘not thriving’ or unhappy in the Nordic countries.
Among the employed, the corresponding figures are 2.2 percent suffering and
6.8 percent struggling, which means that 9 percent are not thriving. Among the
unemployed, more than three times as many people are struggling or suffering,
compared to the employed.
In general, men are hit In this report, we conducted an analysis in which we have tested the probability
harder than women by of those who are unemployed experiencing depressive symptoms, as opposed
unemployment. to the employed. The result shows that the probability is greatest in Norway,
where the risk of experiencing depressive symptoms is more than twice as high
for the unemployed as for the employed. In general, men are worse off than
women (see Appendix 3).
24
Nordic Council of Ministers, Nordregio (2018): State of the Nordic Region 2018.
25
Ibid.
26
Helliwell, J. et al. (2017): World Happiness Report 2017.
27
Ibid.
24Figure 8
Employed Proportion of people
who are struggling
Studying or suffering, by
employment status,
2012–2016
Pensioners
Source: The Happiness
Homemakers
Research Institute, on
the basis of data from
Job-seeking the European Social
Survey.
Chronically sick or disabled
Suffering
Struggling
25Inequality in social contact has most impact on older men
Strong relationships and an active social life are often emphasised as one of
the most important factors in human life and subjective well-being. In this
analysis it has not been possible to test for involuntary loneliness, which we
might otherwise expect to have a particularly strong effect on inequality
of well-being. Instead, we have tested the effect of never or rarely meeting
friends, family or colleagues, as opposed to having highly active social contact
with other people. In all of the Nordic countries, it is clear that people who
meet up often with friends, family and colleagues thrive markedly better than
people who never or rarely do so.
Men are less socially active The inequality in social contact is also interesting in relation to age and
than women, and elderly gender, as illustrated in Fig. 9. There is a very clear correlation between age
men have the least social and lack of social contact, understood in the sense that older people more
contact. rarely have contact with their circle of contacts than young people. However,
the most conspicuous factor is the large gender difference, with men being
less socially active than women. This applies at virtually all age levels. Older
men have least social contact, which manifests itself as an increased level of
dissatisfaction in this group.
Happiness and religiousness
The analysis shows that religiosity – the degree to which one has faith in a
religion – has a bearing on quality of life and inequality of subjective well-
being. Although religiosity is not a top-five factor in explaining struggling and
suffering, it has a marked significance in all the Nordic countries.
It is, however, important to point out that the effect of religiosity on subjective
well-being is observed only when people are highly religious. If a person is only
slightly or moderately religious, no effect on the level of subjective well-being
can be traced. On the other hand, those who score highly on the scale of
religiousness tend to be significantly happier than the non-religious segment
of the population.
Very religious people This effect remains even after we control for all the other demographic
are significantly happier variables and life circumstances in the model. A couple of possible
than those who are non- explanations for why many highly religious people thrive more could be that
religious. these people find greater meaning in their existence through their religion
(corresponding to the eudaimonic happiness mentioned in the introduction),
or that religion serves as a comfort or protection against adversity in life. One
might also consider whether many religious people might experience a greater
connection to a community – through their church, synagogue or mosque –
than is the case for the average person.
26Figure 9
Proportion with rare or
no social contact (by
age and gender),
2012–2016
Source: The Happiness
Research Institute, on
the basis of data from
the European Social
Survey.
Men
Women
27Consequences of unhappiness
In the previous chapters, we have identified those who most often find
themselves struggling or suffering, and which life circumstances most often
apply to such a situation. While dissatisfaction and unhappiness have personal
consequences for the individuals involved and their relatives, a growing
inequality of well-being also has potential consequences for society.
Unhappiness is costly for society
Not thriving or being unhappy has an impact on society, and has negative
consequences for jobs and the economy.
There is evidence to show that if people are struggling or suffering, it raises
costs for their respective workplaces through higher rates of absence due to
sick leave.28 A person who reports a level of subjective well-being of 3 on a 0–10
scale thus costs a company three times more in sick leave alone than a person
who reports 7.29 If we take the resulting reduced productivity into account as
well, the number will naturally be higher.
28
Rath, T & Harter, J (2010): The Economics of Well-being, Gallup.
29
Ibid.
28In addition to the relationship between physical health and subjective well- Among people with chronic
being that we discussed in the previous chapter, a US study shows for illnesses, it has been
example that persons with chronic illnesses, who simultaneously belong to found that those who are
the categories of struggling or suffering, have a 64 percent greater risk of also struggling have a
greater risk of developing
being diagnosed with one or more secondary complications within a year,
complications.
compared to chronically ill people who are thriving. This has consequences for
the economy due, amongst other things, to increased use of the public health
services.30
In relation to social costs, poor mental health is one of the greatest problems
related to subjective well-being. In Denmark, for example, it is estimated
that the direct and indirect costs to society amount to DKK 55 billion a year
(approximately EUR 7.4 billion a year)31 and overall for OECD countries it is
estimated that poor mental health reduces the gross domestic product (GDP)
by 5 percent.32
Unhappiness undermines trust
Trust is one of the cornerstones of the Nordic communities: people in the
Nordic region report significantly higher levels of trust than in the rest of the
world. Trust is crucial to society’s cohesion, and also seems to have a significant
positive impact on our socio-economics.33
However, it is not a law of nature that we will continue to trust one another.
If we wish to maintain a cohesive society in the future, we need to address the
factors that create or challenge trust.
Previously, inequality of income has been seen as a decisive factor for distrust Recent studies show that
in society, but recent studies have shown that the effect that inequality in the impact of inequality of
subjective well-being has on trust is significantly greater.34 This implies that well-being challenges the
level of trust in society.
an increase in the numbers struggling or suffering in society will, all else being
equal, lead to a decline in trust.
There is also another interesting relationship between trust and subjective well-
being. One study has for example shown that people who become unemployed
or ill, or who are subject to discrimination, will most often experience a
significant drop in their level of well-being, but that this drop is greatest in
societies with low levels of trust, and least in societies with high levels of trust.35
The high levels of trust in the Nordic countries therefore act as a bulwark
against unhappiness.
These relationships thus call for greater political focus on creating frameworks
that can help people to thrive. This will not only benefit people who are
suffering and their relatives – it will also have a positive socio-economic effect
and ensure that we can maintain trust and cohesion in society.
30
Rath, T & Harter, J (2010): The Economics of Well-being, Gallup.
31
The National Research Centre for the Working Environment (Denmark) (2010): Hvidbog om mentalt helbred,
sygefravær og tilbagevenden til arbejde.
32
The Global Happiness Council (2018): Global Happiness Policy Report.
33
Nordic Council of Ministers (2017): Trust – the Nordic Gold.
34
Goff, L, J F Helliwell, and G Mayraz (2016): The Welfare Costs of Well-Being Inequality.
35
Helliwell, J F, H Huang, and S Wang (2016): New Results on Trust and Well-Being.
2930
The Nordic perspective

Overall, the report draws a picture of the Nordic countries as a region, which
faces a number of challenges in relation to subjective well-being and happiness.
It would be utopian to try to envisage a society in which struggling and
suffering did not exist at all – and of course it might not be desirable, either; a
normal course of life brings many periods during which people do not perceive
themselves to be happy.

The causes of struggling and suffering in the individual are unique, but               The causes of unhappiness
coincidences and similarities in the analysis results across the Nordic countries      are unique to each
indicate that there are certain general structures in the societies that have a        individual, but general
negative influence on subjective well-being.                                           structures in society can
                                                                                       also adversely affect well-
                                                                                       being.
The hope is that this report, with its Nordic perspective, can contribute to a
debate on how we can limit the number of people who experience struggling or
suffering.

An essential question is what can be done here and now to help individual
citizens. There is also the question of what the role of the public sector and civil
society should be in solving the problem at a structural level.

However, finding solutions to these challenges calls for more research and
more robust data on the well-being of people in the Nordic countries, and
the circumstances that influence this. A data set might for example focus on
variations in well-being between municipalities, which could provide knowledge
of which structures contribute to well-being.

In addition, it would make sense to use time series data – i.e. measuring the
well-being of people over time – and thereby produce new knowledge about
what causes inequalities in well-being, and the consequences of this.

It is important that these data are made available to a wider research
community, so that we can obtain different perspectives on what can create
the best possible lives for the greatest possible number of people.

In order to learn as much as possible about the problem, and how best to tackle        The Nordic countries
it, the Nordic countries should share their knowledge of and experience with the       should share knowledge
issue to the greatest extent possible.                                                 and experience about the
                                                                                       issue.

                                                                                                                     31
Bibliography
• Statistics Denmark (2017): Ulighedsmål: • Helliwell, J. F., Huang, H., & Wang, S. (2016):
Gini-koefficient. New Results on Trust and Well-Being, NBER
Working Paper no. 22450.
• The National Research Centre for the Working
Environment (Denmark) (2010): Hvidbog om • Helliwell, J., Layard, R., & Sachs, J. (2015): World
mentalt helbred, sygefravær og tilbagevenden Happiness Report 2015, New York: Sustainable
til arbejde, Copenhagen: Det Nationale Forsk- Development Solutions Network.
ningscenter for Arbejdsmiljø.
• Helliwell, J., Layard, R., & Sachs, J. (2016): World
• European Social Survey. Data used for general Happiness Report 2016, New York: Sustainable
analysis in the study. Data retrieved via: Development Solutions Network.
www.europeansocialsurvey.com
• Helliwell, J., Layard, R., & Sachs, J. (2017): World
Specific data sources: Happiness Report 2017, New York: Sustainable
Development Solutions Network.
o European Social Survey Cumulative File,
ESS 1-7 (2016). Data file edition 1.0. NSD- • Helliwell, J., Layard, R., & Sachs, J. (2018): World
Norwegian Centre for Research Data, Norway Happiness Report 2018, New York: Sustainable
– Data Archive and distributor of ESS data for Development Solutions Network.
ESS ERIC.
• Nordic Co-operation (accessed May, 2018):
o European Social Survey Round 8: European Life expectancy, accessed via:
Social Survey Round 8 Data (2016). Data https://www.norden.org/en/theme/for-
file edition 1.0. NSD – Norwegian Centre for mer-themes/theme-2012/nordisk-statistik-i-
Research Data, Norway – Data Archive and 50-aar-1/statistics-from-1962-2012/life-expec-
distributor of ESS data for ESS ERIC. tancy
• Public Health Agency of Sweden (2016): Statis- • Nordic Council of Ministers, Nordic Centre for
tik över vuxnas psykiska hälsa, accessed via: Welfare and Social Issues (2016): Mental health
www.folkhalsomyndigheten.se/livs- among youth in Finland: Who is responsible?
villkor-levnadsvanor/psykisk-halsa-och-suicid- What is being done?
prevention/statistik-psykisk-halsa/vuxnas-psy-
kiska-halsa • Nordic Council of Ministers, Nordic Council
of Ministers Secretariat (2018): State of the
• Gallup (accessed April, 2018): Understanding Nordic Region 2018, Copenhagen: Nordic
How Gallup uses the Cantril Scale, accessed Council of Ministers.
via: http://news.gallup.com/poll/122453/under-
standing-gallup-uses-cantril-scale.aspx Global • Nordic Council of Ministers (2017): Trust – The
Nordic Gold.
• Happiness Council (2018): Global Happiness
Policy, United Arab Emirates: World • OECD (2013): Guidelines On Measuring
Government Summit. Subjective Well-being, Paris: OECD Publishing.
• Goff, L., Helliwell, J. & Mayraz, G. (2016): • OECD (2017): Better Life Index, accessed via:
The Welfare Costs of Well-Being Inequality, www.oecdbetterlifeindex.org
NBER Working Paper no. 21900.
• OECD (2017): Better Life Initiative – Measuring
• Happiness Research Institute & Leo Innovation Well-being and progress, Paris: OECD Statistics
Lab (2017): World Psoriasis Happiness Report, Directorate.
Copenhagen.
32• Rath, T., & Harter, J. (2010): The Economics of
Well-being, Gallup Consulting.
• Reneflot, A., Aarø, L.E., Aase, H., Reichborn-
Kjennerud, T., Tambs, K., & Øverland, S. (2018):
Psykisk Helse i Norge.
• SDU (2017): Den Nationale Sundhedsprofil, data
accessed via: www.danskernessundhed.dk
• Social Progress Imperative (2017): Social
Progress Index, accessed via:
www.socialprogressimperative.org
• Steptoe, A., & Wardle, J. (2011): Positive
affect measured using ecological momentary
assessment and survival in older men and
women, Proceedings of the National Academy of
Sciences.
• Danish National Institute of Public Health
(2007): Folkesundhedsrapporten.
• Health Data Agency (Sundhedsdatastyrelsen)
(2017): Medicinforbrug – Indblik.
• The Happiness Research Institute (2013): Der er
et lykkeligt land.
• UN NEWS (2012): Ban: new economic paradigm
needed, including social and environmental
progress, accessed via: https://news.un.org/en/
story/2012/04/407782
• What Works Well-Being (2017): Measuring
Well-Being Inequalities: A How-To Guide.
• World Health Organization (2017): Depression
and Other Common Mental Disorders, Geneva.
• World Health Organization (2017): Scaling-up
treatment of depression and anxiety: a global
return on investment analysis.
33Appendix 1: Method
Definition of inequality of well-being Data
There are two recognised36 ways to measure We have used a data set drawn from the European
inequality of subjective well-being: Social Survey (ESS), with a data extract covering
the five Nordic countries (as well as the UK, for
• Standard deviation: Standard deviation comparison) for the period 2012–2016. Data
measures the distance from the individuals in collection takes place every second year, so our data
a group to the group average. The greater the extracts cover three rounds of data collection, in
standard deviation, the greater the spread which Denmark and Iceland have only participated
in the group, and thereby the greater the in two (data is lacking for Denmark in 2016 and for
inequality. Standard deviation is calculated Iceland in 2014). All of the respondents were more
by taking the square root of the average than 15 years of age.
difference between the individual and the
squared average. A central assumption for all of the calculations
presented in the report is thereby that we can
• Proportions: In this method, well-being is reasonably compare the populations of a given
divided into groups who record, for example, country in 2012 with the same country in 2016,
low, medium and high well-being, and the i.e. that there have been no significant changes
characteristics that the members of each in the Nordic countries during this period. As it is
group have in common with each other are clear that average well-being is declining in all the
then investigated, as well as the characteristics Nordic countries while inequality of subjective well-
that the various groups do not share. In this being is rising, it could be said that our results are
way, one can for example identify the unique conservative. If one took a snapshot in 2016, the
characteristics of people reporting low level of inequality would be greater than we report
subjective well-being, which thereby apply here.
particularly to that group and tell us something
about the type of people who experience low The reason we nonetheless make this assumption
levels of subjective well-being. is that our survey design requires relatively large
amounts of data that we can only obtain by
In this report, we have utilised the proportional aggregating over several rounds of collection
measure. Under the inspiration of Gallup, we have (especially in Iceland, where there were fewer
divided the population of each country into three respondents in each collection round). See Table 5.
groups:37
Since we have only been able to collect data from
1. Suffering – People with a subjective well-being the five above-mentioned countries, we are unable
score of 0–4 to report on the Faroe Islands, Greenland and
2. Struggling – People with a subjective well-being Åland.
score of 5–6
3. Thriving – People with a subjective well-being
score of 7–10.
36
What Works Wellbeing (2017): Measuring Wellbeing Inequalities – How To Guide.
37
Gallup (accessed April, 2018): Understanding How Gallup uses the Cantril Scale.
34You can also read