In Vitro Anti-proliferative Activity and Mechanism of Action of Anemone nemorosa
←
→
Page content transcription
If your browser does not render page correctly, please read the page content below
International Journal of
           Molecular Sciences

Article
In Vitro Anti-proliferative Activity and Mechanism of
Action of Anemone nemorosa
Bresler Swanepoel 1 , Luanne Venables 1 , Octavian Tudorel Olaru 2 , George Mihai Nitulescu 2, *
and Maryna van de Venter 1
 1    Department of Biochemistry and Microbiology, PO Box 77000, Nelson Mandela University,
      Port Elizabeth 6031, South Africa; s211129399@mandela.ac.za (B.S.); s204004039@mandela.ac.za (L.V.);
      Maryna.VanDeVenter@mandela.ac.za (M.v.d.V.)
 2    Faculty of Pharmacy, “Carol Davila” University of Medicine and Pharmacy, Traian Vuia 6, Bucharest 020956,
      Romania; octavian.olaru@umfcd.ro
 *    Correspondence: george.nitulescu@umfcd.ro or nitulescu_mihai@yahoo.com

 Received: 8 February 2019; Accepted: 7 March 2019; Published: 11 March 2019

 Abstract: Anemone nemorosa is part of the Ranunculaceae genus Anemone (order Ranunculales) which
 comprises more than 150 species. Various parts of the plant have been used for the treatment of
 numerous medical conditions such as headaches, tertian agues, rheumatic gout, leprosy, lethargy,
 eye inflammation as well as malignant and corroding ulcers. The Anemone plants have been found
 to contain various medicinal compounds with anti-cancer, immunomodulatory, anti-inflammatory,
 anti-oxidant and anti-microbial activities. To date there has been no reported evidence of its use in
 the treatment of cancer. However, due to the reported abundance of saponins which usually exert
 anti-cancer activity via cell cycle arrest and the induction of apoptosis, we investigated the mode of
 cell death induced by an aqueous A. nemorosa extract by using HeLa cervical cancer cells. Cisplatin
 was used as a positive control. With a 50% inhibitory concentration (IC50 ) of 20.33 ± 2.480 µg/mL,
 treatment with A. nemorosa yielded a delay in the early mitosis phase of the cell cycle. Apoptosis
 was confirmed through fluorescent staining with annexin V-FITC. Apoptosis was more evident with
 A. nemorosa treatment compared to the positive control after 24 and 48 h. Tetramethylrhodamine ethyl
 ester staining showed a decrease in mitochondrial membrane potential at 24 and 48 h. The results
 obtained imply that A. nemorosa may have potential anti-proliferative properties.

 Keywords: A. nemorosa; cytotoxicity; apoptosis; HeLa

1. Introduction
      Normal physiological processes are maintained through a homeostatic balance between two
very critical parts of the normal development and maturation cycle namely cell proliferation and
cell death. Any alterations to this homeostatic balance can lead to diseases such as AIDS, diabetes,
neurodegenerative diseases, and cancer.
      Apoptosis is a cellular suicide mechanism that is regulated by a family of cysteine proteases
otherwise known as caspases [1]. Apoptosis is characterized by: a reduction in mitochondrial
transmembrane potential, intracellular acidification, cell shrinkage, DNA fragmentation and
condensation, production of reactive oxygen species, externalization of phosphatidylserine and
selective proteolysis of a subset of cellular proteins [2]. It is sub-classified into two non-exclusive types
of death pathways namely the extrinsic (receptor-mediated) and intrinsic (mitochondria-mediated)
pathway [3]. Cancer cells have the ability to resist apoptotic insults by means of various mechanisms
and therefore a thorough understanding of these mechanisms is imperative to unravel the secret to
designing more effective and targeted therapeutic strategies [4].

Int. J. Mol. Sci. 2019, 20, 1217; doi:10.3390/ijms20051217                          www.mdpi.com/journal/ijms
Int. J. Mol. Sci.
Sci. 2019,
2019, 20,
20, x1217
FOR PEER REVIEW 22 of
of 16
15
Anemone is a genus of more than 150 species of flowering plants that are native to the
Anemone
temperate is aof
zones genus
both of more
the than 150
Northern andspecies
Southernof flowering plants
hemispheres. Ofthat
theare
150native to the
species, temperate
more than 50
are used in various traditional medical systems. In China alone, 53 species, 9 subspecies,are
zones of both the Northern and Southern hemispheres. Of the 150 species, more than 50 andused
36
in various are
varieties traditional
found medical
in most systems. In China
provinces of alone,
which53 at
species,
least9 subspecies, and 36 varieties
38 species/varieties have
are found in most provinces
ethnopharmacological uses [5].of Observed
which at least 38 species/varieties
pharmacological activitieshave ethnopharmacological
include anti-cancer, anti-
uses [5]. Observed pharmacological activities include anti-cancer, anti-microbial,
microbial, anti-inflammatory, sedative, and analgesic activities as well as anti-convulsant anti-inflammatory,
and anti-
sedative, and analgesic activities as well as anti-convulsant and anti-histamine
histamine effects. Various parts of A. nemorosa have been used for the treatment of numerous effects. Various parts of
A. nemorosa have been used for the treatment of numerous medical conditions
medical conditions such as headaches, tertian agues, rheumatic gout, leprosy, lethargy, such as headaches, tertian
eye
agues, rheumatic
inflammation, gout, leprosy,
malignant ulcerslethargy,
and as eye inflammation, antifungal,
an antimicrobial, malignant ulcers andand
diuretic, as anabortive
antimicrobial,
agent
antifungal, diuretic, and abortive agent [5,6].
[5,6].
Although A.
Although A.nemorosa
nemorosais is
notnot
used traditionally
used for anti-cancer
traditionally treatment,
for anti-cancer reported
treatment, evidence
reported shows
evidence
the presence
shows of compounds
the presence responsible
of compounds for anti-cancer
responsible activity such
for anti-cancer as triterpenoids
activity and saponinsand
such as triterpenoids [7].
For this reason, we investigated the mode of cell death caused by an aqueous extract
saponins [7]. For this reason, we investigated the mode of cell death caused by an aqueous extract from A. nemorosa
(Figure
from A. 1) on HeLa
nemorosa cervical
(Figure 1) cancer
on HeLa cells. The aqueous
cervical extract
cancer cells. Thewas selected
aqueous based
extract wasonselected
a preliminary
based
anti-proliferative screening of ethanolic, hydroethanolic, and aqueous extracts.
on a preliminary anti-proliferative screening of ethanolic, hydroethanolic, and aqueous extracts.
Figure
Figure 1.
1. Anemone
Anemone nemorosa
nemorosa before
before harvesting.
harvesting.
2. Results
2.1. Cytotoxicity
2.1. Cytotoxicity
Cancer cells
Cancer cellsaccumulate
accumulate multiple mutations
multiple mutations in genes that regulate
in genes the cell cycle.
that regulate Certain
the cell mutations
cycle. Certain
occur more frequently than others and the sensitivity of cancer cells to anti-cancer
mutations occur more frequently than others and the sensitivity of cancer cells to anti-cancer treatment is
influenced by the specific mutations in that cancer. The cytotoxic effect of A. nemorosa was
treatment is influenced by the specific mutations in that cancer. The cytotoxic effect of A. nemorosa determined
by Hoechst
was 33342/propidium
determined iodide (PI) dual staining
by Hoechst 33342/propidium for HeLa
iodide (PI) (Figure 2),
dual staining forMeWo, and HepG2
HeLa (Figure cancer
2), MeWo,
cells. The 50% inhibitory concentration (IC ) values obtained were 20.33 ± 2.480 µg/mL,
and HepG2 cancer cells. The 50% inhibitory concentration (IC50) values obtained were 20.33 ± 2.480
50 >200 µg/mL
and 27.66
µg/mL, ± 12.27
>200 µg/mLµg/mL, respectively
and 27.66 ± 12.27 (data
µg/mL, notrespectively
shown for MeWo andshown
(data not HepG2for cells).
MeWo Following these
and HepG2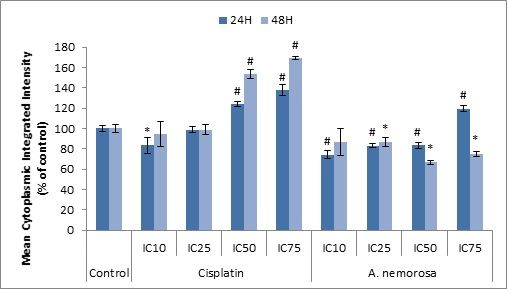
Int. J. Mol. Sci. 2019, 20, x FOR PEER REVIEW 3 of 16
cells). Following these results, all subsequent experiments were performed on HeLa cells using the
determined
Int. J. Mol. Sci.IC 10, IC
2019, , IC50, and IC75 values (Table 1).
20,251217 3 of 15
Int. J. Mol. Sci. 2019, 20, x FOR PEER REVIEW 3 of 16
cells). Following
results, these results,
all subsequent experimentsall subsequent experiments
were performed were
on HeLa performed
cells using theondetermined
HeLa cells IC
using the
10 , IC25 ,
determined
IC 50 , and IC IC
75 , IC
values
10 25 , IC
(Table
50 , and
1). IC 75 values (Table 1).
Figure 2. Cytotoxic effect of A. nemorosa on HeLa cancer cells after 48 h of exposure. Cell viability
was determined using the Hoechst 33342/propidium iodide (PI) staining method. Error bars
indicate SD of four replicate values of three individual experiments.
Figure 2. Cytotoxic effect of A. nemorosa on HeLa cancer cells after 48 h of exposure. Cell viability was
Figure 2. Cytotoxic
Table
determined 1. The the
using effect of concentration
inhibitory
Hoechst A. nemorosa on
33342/propidium HeLa
values ofcancer
iodide (PI)cells
Cisplatin after
and
stainingA. 48 h of Error
nemorosa
method. exposure.
on HeLa Cell
cells.viability
bars indicate SD of
was replicate
four determined using
values the individual
of three Hoechst 33342/propidium
experiments. iodide (PI) staining method. Error bars
Treatment
indicate SD of four replicate valuesIC10of three individual
IC25
experiments. IC50 IC75
Table 1. The inhibitory concentration values of Cisplatin and A. nemorosa on HeLa cells.
A. nemorosa
Table(µg/mL) 6.435
1. The inhibitory ± 0.785 values
concentration 11.44
of ±Cisplatin
1.395 and20.33 ± 2.480
A. nemorosa on HeLa36.14
cells.± 4.408
Treatment IC10 IC25 IC50 IC75
Cisplatin (µM) 0.068 ± 0.012 0.336 ±±0.060 1.675±±2.480
0.301 8.342 ± 1.499
A.Treatment
nemorosa (µg/mL) IC±10 0.785
6.435 11.44 IC 1.395
25
20.33 IC50 36.14 ± 4.408
IC75
Cisplatin (µM) 0.068 ± 0.012 0.336 ± 0.060 1.675 ± 0.301 8.342 ± 1.499
A. nemorosa
2.2. Cell (µg/mL)
Cycle Analysis 6.435 ± 0.785 11.44 ± 1.395 20.33 ± 2.480 36.14 ± 4.408
2.2. Cell Cycle Analysis
DNA cell cycle
Cisplatin analysis was
(µM) 0.068 ± 0.012 to determine
performed 0.336 ± 0.060 1.675in± a0.301
arrest of cells certain phase8.342of± the
1.499
cell
cycle. DNA
HeLa cell
cellscycle
wereanalysis
exposedwas to A.performed
nemorosa to determine
at its arrest
respective IC10of
, ICcells
25, IC in50,aandcertain
IC75 phase of the cell
concentrations
cycle.
for HeLa
2.2.24Cell
and 48cells
Cycle were
h.Analysis
As exposed
shown, to A. nemorosa
treatment at its respective
with cisplatin IC10 , in
arrested cells ICthe
25 , IC
G2 50 ,phase
and ICwhereas
75 concentrations
with A.
for 24 and
nemorosa 48 h.
arrest As shown,
occurred in thetreatment with cisplatin
early M phase (Figure 3).arrested
The samecellswasin theseen G2afterphase
48 whereas with A.
h for treatment
DNA
nemorosa cell
arrest cycle analysis
occurred in was
the performed
early M phaseto determine
(Figure 3). arrest
The sameof cells
was
with cisplatin but early M phase arrest for A. nemorosa was not as pronounced (Figure S1). in
seen a certain
after 48 phase
h for of the cell
treatment
cycle. HeLa cells were exposed to A. nemorosa at its respective IC 10, IC 25
with cisplatin but early M phase arrest for A. nemorosa was not as pronounced (Figure S1)., IC 50 , and IC 75 concentrations
for 24 and 48 h. As shown, treatment with cisplatin arrested cells in the G2 phase whereas with A.
nemorosa arrest occurred in the early M phase (Figure 3). The same was seen after 48 h for treatment
with cisplatin but early M phase arrest for A. nemorosa was not as pronounced (Figure S1).
(a) (b)
CellCycle
Figure3.3.Cell
Figure CycleAnalysis
AnalysisofofHeLa
HeLacells
cellsafter
after2424hhofoftreatment withA.A.nemoroasa
treatmentwith nemoroasa(a)
(a)and
andcisplatin
cisplatin
(b). Cell cycle analysis was determined by the NucRed Live 647 staining method. Error
(b). Cell cycle analysis was determined by the NucRed Live 647 staining method. Error bars indicatebars indicate
SD of four replicate values
(a) of three individual experiments. Significance was determined
(b) using the
#
two-tailed Student t-test: * p < 0.05 and p < 0.005 compared to control.
Figure 3. Cell Cycle Analysis of HeLa cells after 24 h of treatment with A. nemoroasa (a) and cisplatin
(b). Cell cycle analysis was determined by the NucRed Live 647 staining method. Error bars indicate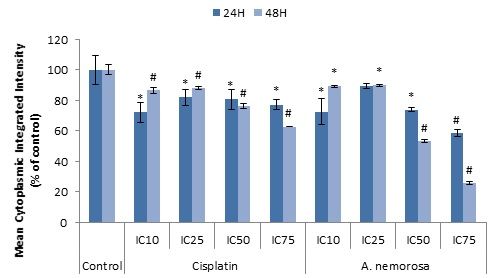
Int. J. Mol. Sci. 2019, 20, x FOR PEER REVIEW                                                                              4 of 16

2.3. Histone H3 Phosphorylation
Int. J. Phosphorylation
        Mol. Sci. 2019, 20, 1217of
                             Histone H3 at Ser10 is believed to be a marker for cells entering mitosis.      4 of 15
Increased levels of phosphorylated histone H3 confirms cell cycle arrest in the M phase.
Immunofluorescence staining with phospho-H3 (ser10) antibody was performed after 24 and 48 h
2.3. Histone H3 Phosphorylation
of extract treatment. No significant increase in the percentage of phosphorylated H3 was observed
after Phosphorylation
       24 or 48 h, except of
                           for Histone
                               the IC75 treatment  of A.isnemorosa
                                         H3 at Ser10        believed(Table  2). aIt was
                                                                        to be            also for
                                                                                    marker     evident
                                                                                                   cellsthat there
                                                                                                          entering
was a decrease in phosphorylated histone H3 after 48 h which could support the low percentage of
mitosis.   Increased  levels  of  phosphorylated   histone   H3  confirms    cell  cycle arrest  in the  M  phase.
cells in the early M phase
Immunofluorescence            of the
                         staining    cellphospho-H3
                                   with  cycle analysis after 48
                                                      (ser10)    h.
                                                              antibody    was performed after 24 and 48 h of
extract treatment. No significant increase in the percentage of phosphorylated H3 was observed after
24 orTable
       48 h, 2. Changes
             except for in phosphorylated
                         the IC75 treatmentHistone H3 levels after
                                             of A. nemorosa  (Table24 2).
                                                                      andIt48 h ofalso
                                                                            was     exposure to cisplatin
                                                                                       evident            andwas a
                                                                                                 that there
      A. nemorosa.
decrease in phosphorylated histone H3 after 48 h which could support the low percentage of cells in
the early M phase of the cell cycle analysis after 48 h.
                               Cells Stained Positive for Phosphorylated Histone H3 (%)
      Table 2. Changes in phosphorylated Histone H3 levels after 24 and 48 h of exposure to cisplatin and A.
                Treatment              A. Nemorosa                          Cisplatin
      nemorosa.
                                        24 h                 48 h                24 h              48 h
                                          Cells Stained Positive for Phosphorylated Histone H3 (%)
                Treatment
                     control         12.28 ± 1.88     5.35 ± 0.52
                                               A. Nemorosa                  12.28 ± 1.88 Cisplatin
                                                                                           5.35 ± 0.52
                                          24 h                 48 h                 24 h                  48 h
                       IC10          11.54 ± 0.93        5.20 ± 0.68        13.01 ± 1.35        5.32 ± 0.99
                  control             12.28 ± 1.88         5.35 ± 0.52          12.28 ± 1.88          5.35 ± 0.52
                      IC25
                   IC10              11.17
                                      11.54±±0.49
                                              0.93       6.45
                                                           5.20±±
                                                                0.77
                                                                  0.68      11.95 ± 0.76
                                                                               13.01 ± 1.35 5.83 ±5.32
                                                                                                   1.23± 0.99
                   IC25               11.17 ± 0.49         6.45 ± 0.77          11.95 ± 0.76          5.83 ± 1.23
                      IC50
                   IC50              11.50
                                      11.50±±0.47
                                              0.47       7.01
                                                           7.01±±
                                                                0.69
                                                                  0.69      7.907.90
                                                                                  ± 0.52 * * 8.70 ±8.70
                                                                                     ± 0.52         1.42±*1.42 *
                   IC75              41.31 ± 6.23 **     11.70 ± 1.77 **        6.04 ± 1.16 *         4.55 ± 1.47
                     ICdetermined
       Significance was 75      41.31
                                  using± the
                                          6.23 ** 11.70
                                             two-tailed     ± 1.77
                                                        Student      *** p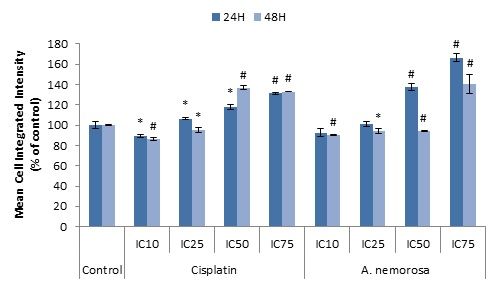
Int. J. Mol. Sci. 2019, 20, x FOR PEER REVIEW                                                                   5 of 16

      Figure 4. Assessment of genotoxicity in HeLa cells after 48 h using the NucRed Live 647 staining
      method. Error bars indicate SD of four replicate values of three individual experiments. Significance
      was determined using the two-tailed Student t-test: # p < 0.005 compared to control.
Int. J. Mol. Sci. 2019, 20, 1217                                                                                 5 of 15

2.5. Phosphatidylserine (PS) Translocation
 2.5. Phosphatidylserine (PS) Translocation
      PS translocation is considered an early feature of apoptosis due to the loss of membrane
integrity  upon induction
       PS translocation        of apoptosis.
                          is considered       Annexin
                                          an early  featureV, is
                                                              ofaapoptosis
                                                                   35–36 kDa duecalcium-dependent      phospholipid-
                                                                                  to the loss of membrane      integrity
binding    protein of
 upon induction     that  is capable
                       apoptosis.      of binding
                                     Annexin    V, is to   PS with
                                                      a 35–36    kDahigh   affinity [10]. Thephospholipid-binding
                                                                      calcium-dependent         presence of PS was
determined
 protein that isbycapable
                    Annexin    V-FITC to
                            of binding   and
                                           PSPI   staining
                                               with           after 24
                                                      high affinity     (Figure
                                                                     [10].        S3) andof48PSh.was
                                                                           The presence            Results    recorded
                                                                                                       determined    by
indicated    that more
 Annexin V-FITC      andPS PI was   present
                              staining  afterafter  48 h ofS3)
                                              24 (Figure       treatment
                                                                 and 48 h.(Figure
                                                                            Results5).   Significant
                                                                                      recorded        increases
                                                                                                 indicated   that were
                                                                                                                  more
seen  forpresent
 PS was    all treatments
                   after 48of  A. treatment
                             h of  nemorosa in  a dose5).dependent
                                              (Figure        Significantmanner
                                                                         increaseswith  theseen
                                                                                     were   greatest  increase
                                                                                                 for all         in the
                                                                                                         treatments   of
number    of  apoptotic  cells  recorded  for the  IC     treatment.
 A. nemorosa in a dose dependent manner with the greatest increase in the number of apoptotic cells
                                                       75

 recorded for the IC75 treatment.

                                   (a)                                                  (b)
      Figure 5. Analysis of phosphatidylserine (PS) translocation in HeLa cells using Annexin V-FITC and
      Figure 5. Analysis of phosphatidylserine (PS) translocation in HeLa cells using Annexin V-FITC and
      PI dual staining after 48 h of treatment with A. nemoroasa (a) and cisplatin (b). Results displayed as
      PI dual staining after 48 h of treatment with A. nemoroasa (a) and cisplatin (b). Results displayed as
      percentage positively stained cells. Error bars indicate SD of four replicate values of three individual
      percentage positively stained cells. Error bars indicate SD of four replicate values of three individual
      experiments. Significance was determined using the two-tailed Student t-test: * p < 0.05 and # p < 0.005
      experiments. Significance was determined using the two-tailed Student t-test: * p < 0.05 and # p <
      compared to control.
      0.005 compared to control.
 2.6. Mitochondrial Membrane Potential (MMP) Analysis
2.6. Mitochondrial Membrane Potential (MMP) Analysis
      The onset of the intrinsic mode of apoptosis is believed to be indicated by the loss of mitochondrial
      The
 membrane   onset  of theand
               potential    intrinsic   mode of apoptosis
                                the subsequent      release of ispro-apoptotic
                                                                     believed to proteins.
                                                                                    be indicated Theby     the loss of
                                                                                                        mitochondrial
mitochondrial     membrane      potential   and   the  subsequent      release   of  pro-apoptotic
 membrane potential was measured by using a lipophilic cationic dye, tetramethylrhodamine ethyl         proteins.   The
mitochondrial      membrane
 ester (TMRE), which              potential
                          reversibly           was measured
                                       accumulates                    by using matrix
                                                       in the mitochondrial          a lipophilic
                                                                                            in a voltagecationic   dye,
                                                                                                            dependent
tetramethylrhodamine       ethyl   ester  (TMRE),     which     reversibly   accumulates      in
 manner. During apoptosis the ability of TMRE to accumulate inside the mitochondria is hampered   the   mitochondrial
matrix
 and theindye
            a voltage
               becomes dependent    manner. During
                         evenly distributed              apoptosis
                                                throughout            the ability
                                                                the cytosol.  Thisofleads
                                                                                       TMRE    to overall
                                                                                            to an  accumulate
                                                                                                            dropinside
                                                                                                                  in the
the  mitochondria   is hampered     and  the dye   becomes     evenly   distributed   throughout
 fluorescence intensity which can then be quantified by fluorescence microscopy (Figure 6) [11].     the  cytosol. ThisA
leads  to an  overall drop   in the  fluorescence   intensity    which   can  then  be  quantified    by
 significant decrease in the mean cytoplasmic integrated intensity was seen after 24 and 48 h of exposure fluorescence
microscopy    (Figure
 to A. nemorosa        6) [11].
                 compared     toA  significant
                                 the            decrease
                                      control (Figure   5). in thesuggests
                                                            This    mean cytoplasmic
                                                                             depolarizationintegrated    intensity was
                                                                                                of the mitochondrial
seen  after 24  and 48  h of  exposure   to A. nemorosa     compared     to the control
 membrane and therefore the involvement of mitochondria in the onset of apoptosis.        (Figure   5).  This suggests
depolarization of the mitochondrial membrane and therefore the involvement of mitochondria in
the onset of apoptosis.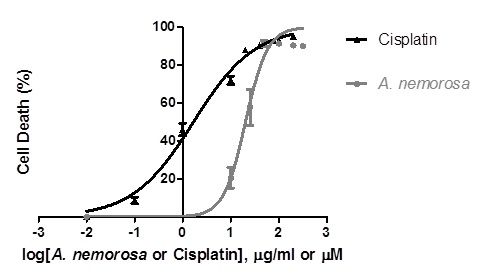
Int. J. Mol. Sci. 2019, 20, 1217                                                                                           6 of 15
   Int. J. Mol. Sci. 2019, 20, x FOR PEER REVIEW                                                                    6 of 16

         Figure
      Figure   6. 6.Changes
                     Changesin  inmitochondrial
                                   mitochondrial membrane
                                                      membranepotential
                                                                    potential(MMP)
                                                                               (MMP)after 24 24
                                                                                       after  and  48 48
                                                                                                 and  h ofh exposure to to
                                                                                                            of exposure
         cisplatin  and   A. nemorosa.  Results   displayed    as mean    cytoplasmic integrated  intensity.
      cisplatin and A. nemorosa. Results displayed as mean cytoplasmic integrated intensity. Error bars      Error bars
         indicate
      indicate  SDSD    of four
                     of four     replicate
                             replicate     values
                                        values       of three
                                                of three       individual
                                                           individual       experiments.
                                                                         experiments.    Significance
                                                                                      Significance  waswas  determined
                                                                                                         determined  using
         using  the  two-tailed  Student  t-test: * p < 0.05# and # p < 0.005 compared to control.
      the two-tailed Student t-test: * p < 0.05 and p < 0.005 compared to control.

2.7.2.7. Caspase8 8and
      Caspase       and3 3Activation
                           Activation
        Caspase
      Caspase      8 and
                 8 and    3 the
                       3 are are two
                                  the main
                                       two main    caspases
                                              caspases        involved
                                                       involved   in theininitiation
                                                                            the initiation   and execution
                                                                                      and execution           of
                                                                                                      of apoptosis,
   apoptosis,   respectively.  Activation   of caspase  8 and   3  was  determined     after  24
respectively. Activation of caspase 8 and 3 was determined after 24 and 48 h by immunofluorescenceand  48  h  by
   immunofluorescence
staining  with antibodies  staining
                              againstwith    antibodies against
                                        activated/cleaved         activated/cleaved
                                                             caspase                   caspase 8in and
                                                                       8 and 3. An increase               3. An cell
                                                                                                     the mean
   increase  in the  mean  cell integrated  intensity values,  when  compared     to the control,
integrated intensity values, when compared to the control, indicates the presence of cleaved,      indicates the or
   presence of cleaved, or activated, caspase 8 or 3. Treatments with A. nemorosa indicated significant
activated, caspase 8 or 3. Treatments with A. nemorosa indicated significant dose dependent increases in
   dose dependent increases in the mean cell integrated intensity for both caspase 8 and 3 after 24 and
the mean cell integrated intensity for both caspase 8 and 3 after 24 and 48 h of exposure (Tables 3 and 4).
   48 h of exposure (Tables 3,4).
      Table 3. Changes in cleaved caspase 8 levels in HeLa cells after 24 and 48 h of exposure to A. nemorosa
        Table 3. Changes in cleaved caspase 8 levels in HeLa cells after 24 and 48 h of exposure to A.
      extract and cisplatin.
         nemorosa extract and cisplatin.
                                          Cleaved Caspase 8 Mean Cell Integrated Intensity (% of control)
                 Treatment         Cleaved Caspase 8 Mean Cell Integrated Intensity (% of control)
                                                  A. Nemorosa                              Cisplatin
                 Treatment                24A.h Nemorosa        48 h               24Cisplatin
                                                                                      h                 48 h
                   control            100.0 ± 1.15          100.0 ± 1.82       100.0 ± 1.15        100.0 ± 1.82
                    IC10              24 h ± 4.47
                                      104.7              48102.7
                                                              h ± 0.14       2499.14
                                                                                 h ± 1.23        48102.9
                                                                                                     h ± 1.46
                    IC25              110.9 ± 12.6          102.7 ± 3.13      105.9 ± 2.66 *      108.2 ± 2.77 *
                   control
                    IC50           100.0 ± 1.15
                                      101.6 ± 4.98    100.0107.9
                                                             ± 1.82
                                                                 ± 3.90 * 100.0 ± 1.15
                                                                              116.3 ± 0.21 ** 100.0 ± 1.82
                                                                                                  151.8 ± 8.08 **
                    IC75              116.5 ± 17.5        112.8 ± 3.06 **     124.7 ± 2.24 **     167.2 ± 7.37 **
                     IC10          104.7 ± 4.47       102.7 ± 0.14        99.14 ± 1.23        102.9 ± 1.46
       Significance was determined using the two-tailed Student t-test: * p < 0.05 and ** p < 0.005 compared to control.
                     IC25          110.9 ± 12.6       102.7 ± 3.13       105.9 ± 2.66 *      108.2 ± 2.77 *
      Table 4. Changes in cleaved caspase 3 levels in HeLa cells after 24 and 48 h of exposure to A. nemorosa
                  IC50       101.6 ± 4.98    107.9 ± 3.90 *     116.3 ± 0.21 **     151.8 ± 8.08 **
      extract and cisplatin.
                     IC75          116.5 ± 17.5      112.8 ± 3.06 **    124.7 ± 2.24 **      167.2 ± 7.37 **
                                          Cleaved Caspase 3 Mean Cell Integrated Intensity (% of control)
   SignificanceTreatment
                was determined using the two-tailed Student t-test: * p < 0.05 and ** pCisplatin
                                          A. Nemorosa                                   < 0.005 compared to control.
                                          24 h                  48 h               24 h                 48 h
         Table 4. Changes in cleaved caspase 3 levels in HeLa cells after 24 and 48 h of exposure to A.
                control             100 ± 4.86        100 ± 1.17         100.0 ± 4.86        100.0 ± 1.17
         nemorosa extract and cisplatin.
                  IC10             101.5 ± 4.65      100.2 ± 2.46        103.5 ± 5.20       105.1 ± 1.94 *
                  IC25             102.8 ± 5.28     104.4 ± 0.19 **      110.6 ± 5.94       111.2 ± 3.29 *
                  IC50        Cleaved
                                   103.4 Caspase
                                         ± 5.64  3 Mean   Cell
                                                    108.4 ± 2.65Integrated
                                                                 **         Intensity
                                                                        123.2 ± 5.28 * (% of155.7
                                                                                             control)
                                                                                                  ± 7.82 **
                  IC75             106.1 ± 4.95     126.7 ± 4.31 **     129.1 ± 6.23 **     174.0 ± 8.58 **
                Treatment
       Significance was determined usingA. Nemorosa
                                         the                                         Cisplatin
                                             two-tailed Student t-test: * p < 0.05 and ** p < 0.005 compared to control.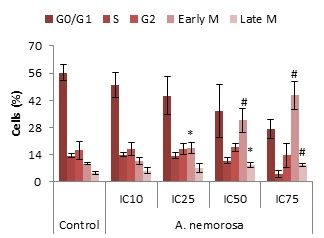
Int. J. Mol. Sci. 2019, 20, 1217                                                                                                    7 of 15

2.8. Reactive Oxygen Species (ROS) Production
      The levels of reactive oxygen species in cells, under normal physiological conditions, are controlled
by the balance between anti-oxidants and free radicals. Excessive production of reactive oxygen species
can induce lipid peroxidation, depletion of sulfhydryl groups, altered signal transduction pathways,
altered calcium homeostasis and DNA damage, which could lead to the induction of apoptosis [12].
CellRox orange is a dye that indicates the presence of reactive oxygen species. An increase in the mean
cell integrated intensity indicates an increase in the levels of reactive oxygen species. HeLa cells treated
with  A. nemorosa were stained with CellRox orange and images were acquired (Figure 6). Exposure
   Int. J. Mol. Sci. 2019, 20, x FOR PEER REVIEW                                                  8 of 16
                                                                                                          to
A. nemorosa indicated more significant increases, compared to the control, in the mean cell integrated
intensity after 24 h as opposed to 48 h (Figure 7).

                                                                   (a)

                        (b)                                        (c)                                        (d)

         Figure
      Figure      7. Changes
               7. Changes     in in levels
                                  levels ofof  reactive
                                            reactive    oxygenspecies
                                                      oxygen     speciesfor
                                                                          formeasurement
                                                                               measurementofofoxidative
                                                                                                   oxidativestress
                                                                                                                stressin
                                                                                                                       inHeLa
                                                                                                                           HeLa cells
         cells
      after  24 after
                and 4824 hand  48 h of exposure
                           of exposure              to cisplatin
                                           to cisplatin           and A. nemorosa
                                                         and A. nemorosa              (a). Results
                                                                             (a). Results   displayeddisplayed
                                                                                                          as mean as cell
                                                                                                                      mean    cell
                                                                                                                          integrated
         integrated
      intensity.       intensity. (10
                   Micrographs       Micrographs     (10× magnification)
                                       × magnification)                       indicating
                                                            indicating positive            positive
                                                                                     staining          stainingoxygen
                                                                                                for reactive       for reactive
                                                                                                                           species in
         oxygen
      HeLa    cellsspecies
                    after 24inh HeLa    cells after
                                 of treatment       24 h of treatment
                                                 compared   to control compared       to control
                                                                         (b), cisplatin   (c), and(b),   cisplatin (c),
                                                                                                     A. nemorosa          CellsA.were
                                                                                                                    (d). and
         nemorosa
      stained   with(d).  Cells were
                      CellRox      Orangestained   with CellRox
                                            and Hoechst    33342.Orange
                                                                    Nuclei:and    Hoechst
                                                                               blue; reactive33342.
                                                                                                oxygenNuclei:    blue;yellow.
                                                                                                            species:   reactiveError
         oxygen
      bars  indicatespecies:   yellow.
                       SD of four         Error values
                                     replicate    bars indicate
                                                        of three SD   of fourexperiments.
                                                                  individual      replicate values       of threewas
                                                                                                  Significance       individual
                                                                                                                        determined
         experiments.     Significance    was   determined  using  #the  two-tailed    Student   t-test:  * p < 0.05  and   # p <
      using the two-tailed Student t-test: * p < 0.05 and p < 0.005 compared to control.
          0.005 compared to control.
2.9. Autophagy Induction
   2.9. Autophagy Induction
      Autophagy is a catabolic process that is regulated by the mammalian target of rapamycin (mTOR)
kinase. Autophagy    is a catabolic
        It is characterized   by its process that is
                                     homeostatic     regulated
                                                   role         by the mammalian target ofdegradation
                                                        in the autophagosomic-lysosomal     rapamycin of:
(1) (mTOR)   kinase. Itcontents,
    bulk cytoplasmic     is characterized  by itsprotein
                                  (2) abnormal     homeostatic   role and
                                                          aggregates  in the
                                                                          (3) autophagosomic-lysosomal
                                                                              excess or damaged organelles.
   degradation of: (1) bulk cytoplasmic contents, (2) abnormal protein aggregates and (3) excess or
   damaged organelles. This role mainly reflects on its pro-survival function but several studies have
   suggested a role in cell death as monitored by the accumulation of LC3-II in cells in which apoptotic
   signaling has been perturbed [13]. Lysotracker™ Red is an acidotrophic dye that indicates the
   presence of late autophagic vesicles and autophagy activation. An increase in the mean cytoplasmic
   integrated intensity indicates an increase in the number of acidic organelles such as late autophagic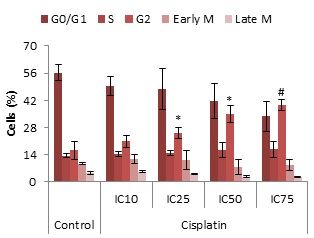
Int. J. Mol. Sci. 2019, 20, 1217                                                                                               8 of 15

 This role mainly reflects on its pro-survival function but several studies have suggested a role in
 cell death as monitored by the accumulation of LC3-II in cells in which apoptotic signaling has been
 perturbed [13]. Lysotracker™ Red is an acidotrophic dye that indicates the presence of late autophagic
 vesicles and autophagy activation. An increase in the mean cytoplasmic integrated intensity indicates
 an increase in the number of acidic organelles such as late autophagic vesicles. HeLa cells treated
Int.
 withJ. Mol.
         A. Sci. 2019, 20,were
             nemorosa     x FORstained
                                PEER REVIEW
                                         with Lysotracker™ Deep Red and images were acquired (Figure        9 of 16
                                                                                                                  8).
 Significant decreases in LTR staining were evident for treatment with A. nemorosa as opposed to
nemorosa
 significant as increases
                 opposed to     significant
                             observed        increasestreatment
                                        for cisplatin  observed after
                                                                for cisplatin treatment
                                                                      both 24 and        after bothto24the
                                                                                   48 h compared        and   48 h
                                                                                                           control
compared
 (Figure 8).   to  the  control  (Figure 8).

                                                                (a)

                     (b)                                        (c)                                          (d)

     Figure
      Figure 8.8. Changes
                  Changes in inlevels
                                 levelsofofacidic
                                             acidic organelles
                                                  organelles     after
                                                             after     24 and
                                                                   24 and        48exposure
                                                                           48 h of  h of exposure        to cisplatin
                                                                                               to cisplatin             and A.
                                                                                                               and A. nemorosa.
     nemorosa.    Results displayed
      Results displayed                     as mean cytoplasmic
                             as mean cytoplasmic                       integrated
                                                       integrated intensity     (a). intensity
                                                                                     Micrographs   (a). (10  × magnification)
                                                                                                          Micrographs      (10×
     magnification) indicating positive staining for acidic organelles in HeLa cells after 48 h of treatment
      indicating    positive  staining   for  acidic organelles   in HeLa   cells after  48  h  of  treatment     compared    to
      control   (b), cisplatin  (c), and  A.  nemorosa  (d). Cells  were  stained   with  Lysotracker
     compared to control (b), cisplatin (c), and A. nemorosa (d). Cells were stained with Lysotracker Red   Red   and   Hoechst
      33342.
     and       Nuclei:
           Hoechst      blue;Nuclei:
                      33342.   acidic organelles:
                                        blue; acidicorange.   Errororange.
                                                      organelles:    bars indicate
                                                                             Error SDbarsofindicate
                                                                                            four replicate
                                                                                                       SD of values     of three
                                                                                                                four replicate
     values of three individual experiments. Significance was determined using the two-tailed Studentand
      individual   experiments.     Significance   was determined    using  the  two-tailed  Student      t-test: * p < 0.05  t-
      # p <  0.005 compared      to control.
     test: * p < 0.05 and # p < 0.005 compared to control.

3. Discussion
     To date there has been no evidence of the use of A. nemorosa for the treatment of cancer.
Studies involving A. nemorosa mainly consist of anti-microbial activity against known hospital and
fish pathogens such as E. coli and Vibrio anguillarum, respectively [14,15]. However, the isolation of
numerous phytochemical compounds from other species of the Anemone genus has provided
sufficient reasons as to why A. nemorosa could be used for cancer treatment.
     Raddeanin A is a pentacyclic triterpenoid saponin, isolated from A. raddeana, and induces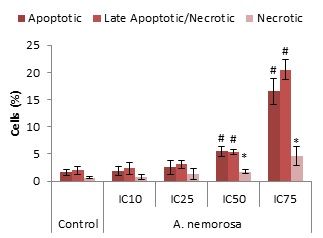
Int. J. Mol. Sci. 2019, 20, 1217                                                                   9 of 15

3. Discussion
      To date there has been no evidence of the use of A. nemorosa for the treatment of cancer. Studies
involving A. nemorosa mainly consist of anti-microbial activity against known hospital and fish
pathogens such as E. coli and Vibrio anguillarum, respectively [14,15]. However, the isolation of
numerous phytochemical compounds from other species of the Anemone genus has provided sufficient
reasons as to why A. nemorosa could be used for cancer treatment.
      Raddeanin A is a pentacyclic triterpenoid saponin, isolated from A. raddeana, and induces
apoptosis in multiple cell lines by means of increased Bax expression, reduced Bcl-2 and Survivin
expression and the activation of caspases 3, 8 and 9 in gastric cancer cells [5]. Whilst isolated
triterpenoid saponins from A. flaccida, hedera saponin StI4a, hedera saponin St-J, anhuienoside E,
hedera saponin B and flaccidoside II, have been shown to induce apoptosis in HeLa cervical cancer
cells [7].
      Dose-response assays (Figure 1) were performed by means of the Hoechst 33342/PI dual staining
method and results indicated that A. nemorosa inhibits proliferation of HeLa cells in a dose dependent
manner. For a crude extract to be considered promising for systemic application, the IC50 should be
less than 100 µg/mL in vitro [16]. The IC50 of A. nemorosa was determined to be 20.33 ± 2.480 µg/mL.
      One of the basic characteristics of cancer cells is their ability to proliferate uncontrollably.
Therefore, DNA cell cycle analysis remains an important aspect in the search for new and improved
chemotherapeutic agents. Uncontrollable proliferation can be ascribed to the alteration of the various
cell cycle checkpoints [17]. Extracts, such as A. nemorosa, with cytotoxic activity may counteract these
alterations by activating cell cycle arrest through the damage to the mitotic spindle or by affecting the
signaling pathways that regulate proliferation [18]. A. nemorosa was shown to dose dependently arrest
HeLa cells in the early M phase of the cell cycle after 24 h of exposure whereas cisplatin arrested cells
in the G2 phase (Figure 3). The exact mechanism of how A. nemorosa and cisplatin cause arrest in the
early M and G2 phase, respectively, cannot be deduced from the NucRed staining and more than one
possibility exists. There are two parallel cascades that ultimately serve to inactivate the CyclinB1-CDK1
complex subsequently blocking entry into mitosis. The first cascade occurs quite rapidly where Chk1
phosphorylates Cdc25C preventing it from activating CDK1, leading to G2 arrest. The slower second
parallel cascade involves the phosphorylation of p53 by means of activating CKI’s (such as p21) which
inactivate the CyclinB1-CDK1 complex. Mitotic arrest is mainly due to the disruption of the formation
of the mitotic spindle resulting in mitotic catastrophe [19].
      Early M phase arrest by A. nemorosa was confirmed through staining with phospho-H3 (ser10)
antibody as the phosphorylation of histone H3 is believed to be a marker for cells entering into
mitosis [20]. Treatment with the IC75 value of extract showed a significant increase in phosphorylated
histone H3 after 24 h (Table 2). Cisplatin treatments indicated a dose dependent decrease in
phosphorylated histone H3 which supports the G2 phase arrest obtained during cell cycle analysis.
Treatment with staurosporine has also showed to inhibit histone H3 phosphorylation leading to G2
phase arrest [20]. Studies done by Hans and Dimitrov (2001) showed that during cell division, the
phosphorylation of histone H3 is initiated at different phases. However, metaphase chromosomes
have been found to always be the most heavily phosphorylatedand suggests a possible role for histone
H3 in the passage of cells from metaphase to anaphase [21]. The low level of phosphorylation seen in
this study suggests that HeLa cells would then be mitotically arrested in metaphase which is relatively
early in the process of mitosis supporting the early M phase arrest obtained for the cell cycle analysis.
      Mitotic catastrophe is a regulated process that uses anti-proliferative measures such as apoptosis,
necrosis and senescence during defective or failed mitosis in order to prevent proliferation of
cells. Mitotic catastrophe is characterized by the formation of giant multinucleated cells and also
micronucleated cells, the former is due to clusters of missegregated uncondensed chromosomes,
whereas the latter is as a result of lagging chromosomes or chromosome fragments, during anaphase,
which are not incorporated into the daughter nuclei during telophase [22]. Cell death through mitotic
catastrophe can manifest in a caspase-dependent or -independent manner. The caspase-dependent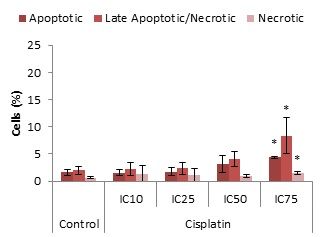
Int. J. Mol. Sci. 2019, 20, 1217                                                                  10 of 15

manner involves the release of cytochrome c following mitochondrial membrane depolarization and
oligomerization of Bax/Bak. Caspase-independent cell death on the other hand can occur through a
sudden Ca2+ overload, oxidative stress and mitochondrial permeability transition facilitated by the
permeability transition pore complex which acts as a bridge between the inner and outer mitochondrial
membranes [9]. After 48 h of treatment with A. nemorosa significant increases were seen in the formation
of micro-nucleated cells which suggests the possible onset of mitotic catastrophe (Figure 3).
      Phosphatidylserine translocation is believed to be an early feature of apoptosis due to the loss of
membrane asymmetry upon induction of apoptosis. During apoptosis the membrane phospholipid
PS is translocated from the inner to the outer leaflet of the plasma membrane. During late necrosis,
the membrane integrity becomes compromised and Annexin V may enter the cell and bind to PS in
the inner leaflet. Therefore, staining of cells with Annexin V is commonly used in conjunction with
PI. Non-apoptotic or healthy cells would stain negative for both Annexin V and PI whereas cells
undergoing early apoptosis would be positive for Annexin V but negative for PI. Late apoptotic/early
necrotic cells would stain positive for both Annexin V and PI, whereas necrotic cells would only
be positive for PI [10]. Treatment with A. nemorosa after 48 h showed a dose dependent increase
in apoptotic, late apoptotic/necrotic and necrotic cells. The most significant increases were seen
for percentage of apoptotic and late apoptotic/necrotic cells for both the IC50 and IC75 treatments
(Figure 5). Cells undergoing necrosis can also stain positive for both Annexin V and PI and therefore
it cannot be determined whether or not the cells categorized as late apoptotic/necrotic are actually
apoptotic or necrotic, respectively.
      Mitochondrial membrane potential plays a key role in the generation of ATP through the
respiratory chain and opening of the mitochondrial permeability transition pore would lead to a
collapse of this potential and the subsequent release of cytochrome c (Cyt-c), Smac/DIABLO, Apoptosis
Inducing Factor (AIF) and endonuclease G (Endo G) which all play a role in the initiation of apoptosis
either through activation of caspases or leading to DNA fragmentation [23–25]. Treatment with
A. nemorosa for 24 and 48 h indicated a decrease in the mean cytoplasmic integrated intensity of TMRE
(Figure 6) and therefore suggests the involvement of the mitochondria in the onset of apoptosis by
A. nemorosa.
      Caspases are proteases that contain a cysteine in their active site which cleave in the C-terminal
region of aspartate residues and are synthesized as inactive zymogens. Initiator and effector caspases
are two groups of caspases involved in cell death. Initiator caspases contain long pro-domains and
form aggregates in response to scaffolding co-factors leading to their auto-activation [26]. In contrast,
effector caspases are not capable of auto-activation but become activated through cleavage by initiator
caspases. Caspase 8 is an initiator caspase whose activation is promoted by CD95 (Fas/APO-1) and
tumor necrosis factor receptor 1 (TNFR1). The active fragments, p18 and p10, of caspase 8 are released
during its activation. The activated caspase 8 cleaves and activates effector caspase-1, -3, -6, and -7.
Caspase 3 is ultimately responsible for the morphological changes, such as DNA fragmentation and
cell shrinkage associated with apoptosis [27]. The activation of both caspase 8 and caspase 3 without
the depolarization of the mitochondrial membrane potential would therefore suggest that the extrinsic
pathway plays a role in the execution of apoptosis. Similarly the activation of caspase 3, preceded by
mitochondrial membrane depolarization would suggest a role of the intrinsic pathway in the execution
of apoptosis [28]. Significant increases in the mean cell integrated intensities of both caspase 8 and 3
after 24 and 48 h, respectively, was evident in a dose dependent manner (Tables 3 and 4). Thus it can be
deduced that the induction of apoptosis by A. nemorosa involves both the extrinsic and intrinsic pathway.
Caspase-dependent apoptosis preceded by mitochondrial membrane depolarization is often associated
with increased reactive oxygen species generation. ROS are known to interact with mitochondrial
permeability transition complex proteins leading to a significant impact on mitochondrial anion fluxes.
The release of cytochrome c also leads to further ROS increases due to a disrupted electron transport
chain [29]. Treatment with A. nemorosa significantly increased ROS levels as was evident in the increase
Int. J. Mol. Sci. 2019, 20, 1217 11 of 15
in the mean cell integrated intensity (Figure 6). It can therefore be said that ROS contributes to the
induction of apoptosis by A. nemorosa.
Apoptosis, mitotic catastrophe, autophagy, and regulated necrosis constitute the four major forms
of programmed cell death. Cell death is hardly ever due to single pathway activation but rather
the result of cross-talk between multiple pathways of which most of the key players participate in
more than one signaling cascade. Autophagy is often observed to occur before apoptosis induction,
essentially inhibiting it, and is deemed to be a rescue mechanism in which a cell adapts to stress.
However, the induction of apoptosis can lead to the cleavage of autophagy-related genes such as
ATG3, BECN1, or AMBRA1 which in turn leads to the inhibition of autophagy [22]. Therefore, the
negative or decreased staining observed for treatment with A. nemorosa (Figure 7) may be attributed to
the absence of autophagy, possibly through inhibition, or it may favor apoptosis induction by tipping
the cell survival: cell death balance [30].
4. Materials and Methods
4.1. Reagents
HeLa cervical cancer cells were purchased from Highveld Biological, Johannesburg, South Africa.
RPMI 1640 cell culture medium and fetal bovine serum was purchased from GE Healthcare Life
Sciences (Logan, UT, USA). Trypsin-EDTA, Dulbecco’s phosphate buffered saline (DPBS) with Ca2+
and Mg2+ and Dulbecco’s phosphate buffered saline (DPBS) without Ca2+ and Mg2+ were purchased
from Lonza (Wakersville, MA, USA). Trypan blue, bisBenzamide H 33,342 trihydrochloride (Hoechst
33342), cisplatin, penicillin/streptomycin and bovine serum albumin fraction V were purchased from
Sigma-Aldrich (St. Louis, MI, USA). NucRedTM Live 647, CellRox® Orange reagent, Lysotracker™
Deep Red and Tetramethylrhodamine ethyl ester (TMRE) were purchased from Molecular Probes® -Life
Technologies-Thermo Fisher Scientific (Logan, UT, USA). Annexin V-FITC/PI kit was purchased from
MACS Miltenyi Biotec (Cologne, Germany). Cleaved caspase 3 (Asp175) (D3E9) Rabbit mAb, Cleaved
caspase 8 (Asp391) (18C8) Rabbit mAb, Anti-rabbit IgG (H+L), F(ab’)2 fragment (Alexa fluor® 647
conjugate), Anti-rabbit IgG (H+L), F(ab’)2 fragment (Alexa fluor® 488 conjugate) and Phosphorylated
Histone H3 were purchased from Cell Signaling Technology (Danvers, MA, USA).
4.2. Plant Material and Extract Preparation
The aerial part of A. nemorosa was harvested from Piatra Neamţ, Neamţ county (April, 2014)
and the identity was established by comparing with herbarium specimens from ‘Dimitrie Brandza’
Botanical Garden, Bucharest. Voucher specimens are available in the herbarium collection of the
“Dimitrie Brandza” Botanical Garden, Bucharest (no. 405889) and at the Department of Botany and
Cell Biology, “Carol Davila” University of Medicine and Pharmacy, Bucharest.
The aqueous extract of A. nemorosa was prepared by grounding approximately 10 g (mesh 14) and
then extracting with 3 × 100 mL water under reflux. This was followed by concentration through rotary
evaporation (RVO 004; Ignos, Prague, Czech Republic) and lyophilization at −55 ◦ C (CoolSafe ScanVac
55; LaboGene, Lynge, Denmark), yielding 16.67% dry extract. The reproducibility of the extraction
was evaluated on three batches obtained from the same plant material using IR spectra on a JASCO
FT/IR-4200 spectrometer with an ATR PRO450-S accessory, on the spectral range of 4000–400 cm−1 .
For all experiments the plant extract was reconstituted in DMSO at a final concentration of 100 mg/mL
and stored at −20 ◦ C until use.
Total polyphenol content (TPC) and total flavonoid content (TFC) were determined according to
the Folin-Ciocalteu method at λ = 750 nm and at λ = 429 nm using the aluminum chloride method [31].
The determinations were performed in triplicate using a UV-VIS spectrophotometer (Halo DB-20-220;
Dynamica, Salzburg-Mayrwies, Austria). TPC and TFC were calculated using linear regression by
interpolation on calibration curves made in the same conditions and expressed as the means ± SD
of the experiments in milligram gallic acid equivalents (GAE) per gram of dry extract (DE) for TPCInt. J. Mol. Sci. 2019, 20, 1217 12 of 15
and in milligram quercetin equivalents (QE) per gram of DE for TFC. TPC was 23.98 mg GAE/g DE,
whereas TFC was 1.12 mg QE/g DE.
4.3. Cell Culture Conditions
HeLa cells were routinely maintained in 10 cm culture dishes in RPMI 1640 culture medium
supplemented with 10% fetal bovine serum and incubated at 37 ◦ C in a humidified incubator with 5%
CO2 . Cell number and viability was determined by using a LunaTM cell Counter (Logos Biosystems,
Inc., Anyang, South Korea) after staining cells with trypan blue.
4.4. Experimental Imaging and Analysis
For all experiments, unless otherwise indicated, the ImageXpress Micro XLS Widefield
High-Content Analysis System (Molecular Devices® , San Jose, CA, USA) was used to image cells.
The images were analyzed using the applicable modules of the MetaXpress® High-Content Image
Acquisition & Analysis Software supplied by Molecular Devices® (San Jose, CA, USA).
4.5. Cytotoxicity
HeLa cells were seeded in 96-well plates at densities of 5000 cells/well using 100 µL aliquots and
left overnight to attach. For treatment, an additional 100 µL of the treatments at varying concentrations
of A. nemorosa (0.1–300 µg/mL) and cisplatin (0.1–200 µM) were added. Treated cells were incubated
at 37 ◦ C in a humidified 5% CO2 incubator for 48 h. Treatment medium was removed and replaced
with 100 µL phosphate buffered saline (PBS with Ca2+ and Mg2+ ) containing Hoechst 33,342 at a final
concentration of 5 µg/mL. PI was added at final a concentration of 10 µg/mL using 10 µL per well of
a 110 µg/mL stock and the cells were imaged.
4.6. Cell Cycle Analysis and Micronucleus Assay
HeLa cells were seeded in 96-well plates at a density of 5000 cells/well using 100 µL aliquots and
left overnight to attach. The cells were treated with the IC10 , IC25 , IC50 and IC75 concentrations of A.
nemorosa and cisplatin. Treated cells were incubated at 37 ◦ C in a humidified 5% CO2 incubator for 24
and 48 h. Treatment medium was removed and cells were fixed using 4% formaldehyde for 15 min at
room temperature prior to the addition of 100 µL NucRedTM Live 647 stain (50 µL NucRed in 10mL
PBS, according to manufacturer’s instructions). Cells were incubated for 15 min at room temperature
prior to imaging.
4.7. Histone H3 Phosphorylation
HeLa cells were seeded and treated as described for cell cycle analysis. Staining was performed
as described for cell cycle analysis, after which cells were permeabilized using 80% ice cold methanol
at minus 20 ◦ C for 10 min. Phospho-Histone H3 (Ser10) (D2C8) XP® Rabbit mAb (Cell Signaling
Technology, Danvers, MA, USA) was used to determine the presence of phosphorylated Histone H3.
After permeabilization the cells were blocked using PBS containing 0.5% BSA and thereafter incubated
with the primary antibody (1:250) for 1 h at 37 ◦ C. Cells were washed and incubated with a conjugated
secondary antibody (1:1000), anti-rabbit IgG (H+L), F(ab’)2 Fragment (Alexa Fluor® 488 Conjugate)
(Cell Signaling Technology, Danvers, Massachusetts, USA) for 30 min at 37 ◦ C in the dark. After
staining with the secondary antibody, the cells were washed once to eliminate unbound antibodies
and then imaged.
4.8. Phosphatidylserine Translocation
The Annexin V-FITC/PI kit from MACS Miltenyi Biotec (Cologne, Germany) was used with
modifications. HeLa cells were seeded and treated as described for cell cycle analysis. After 24 and
48 h, cells were stained by removing treatment medium and adding 50 µL aliquots of a mixture ofInt. J. Mol. Sci. 2019, 20, 1217 13 of 15
Annexin V-FITC (50 µL) and Hoechst 33,342 (1 µL) in 5 mL PBS containing 250 µL of Binding Buffer
(20×). Cells were incubated in the dark for 15 min at room temperature. PI (50 µL per well of 2 µg/mL
stock) was added to the Annexin/Hoechst stain just before image acquisition.
4.9. Mitochondrial Membrane Potential (MMP) Analysis
HeLa cells were seeded and treated as described for cell cycle analysis. Cells were
stained by removing treatment medium and adding 100 µL aliquots of a mixture of 0.05 mM
tetramethylrhodamine ethyl ester (TMRE) (50 µL) and Hoechst 33,342 (2 µL) in 10 mL PBS. Cells
were incubated in the dark for 30 min at 37 ◦ C prior to image acquisition.
4.10. Caspase 8 and 3 Activation
HeLa cells were seeded and treated as described for cell cycle analysis analysis. Cells were
treated for 24 and 48 h, after which they were fixed and permeabilized as described for histone H3
phosphorylation. Cleaved caspase 8 (Asp391) and cleaved caspase 3 (Asp175) (D3E9) rabbit monoclonal
antibodies (Cell Signaling Technology) were used to determine the presence of activated caspase 8 and
caspase 3, respectively. After permeabilization the cells were blocked using PBS containing 0.5% BSA
and thereafter incubated with the antibodies separately (1:100 for caspase 8 and 1:200 for caspase 3)
for 1 h at 37 ◦ C. Cells were washed and incubated with a conjugated secondary antibody (1:500),
anti-rabbit IgG (H+L), F(ab’)2 Fragment (Alexa Fluor® 647 Conjugate) for 30 min at 37 ◦ C in the
dark. After staining with the secondary antibody, the cells were washed once to eliminate unbound
antibodies and Hoechst 33,342 was used as a counterstain prior to imaging.
4.11. Reactive Oxygen Species (ROS) Production
HeLa cells were seeded and treated as described for cell cycle analysis. Cells were stained by
removing treatment medium and adding 100 µL aliquots of a mixture of 2.5 mM CellRox orange (20
µL) and Hoechst 33,342 (2 µL) in 10 mL PBS. Cells were incubated in the dark for 30 min at 37 ◦ C prior
to image acquisition.
4.12. Autophagy Induction
HeLa cells were seeded and treated as described for cell cycle analysis. Cells were stained by
removing treatment medium and adding 100 µL aliquots of a mixture of 50 nM Lysotracker red (0.5 µL)
and Hoechst 33,342 (2 µL) in 10 mL PBS. Cells were incubated in the dark for 30 min at 37 ◦ C prior
to imaging.
4.13. Statistical Analysis
At least three experiments were completed for each cell line in which three different transfer
numbers were used. Statistical analysis was performed by means of the student t-test for two samples
assuming equal variance. Error bars represent the standard deviation of the mean (SD).
5. Conclusions
Taken together, our results demonstrate that the crude aqueous extract of A. nemorosa may have
anti-cancer potential. This study has shown that upon treatment of HeLa cells with A. nemorosa
apoptosis is induced. The mechanism of induction of apoptosis is accompanied by early M phase
cell cycle arrest, induction of mitotic catastrophe, mitochondrial membrane depolarization, caspase
activation and reactive oxygen species generation. Future studies will focus on the isolation and
identification of active component(s) and to characterize the precise mechanism of action induced by
A. nemorosa.
Supplementary Materials: Supplementary materials can be found at http://www.mdpi.com/1422-0067/20/5/
1217/s1.Int. J. Mol. Sci. 2019, 20, 1217 14 of 15
Author Contributions: Conceptualization, B.S. and M.v.d.V.; Formal analysis, B.S., L.V., O.T.O. and M.v.d.V.;
Funding acquisition, M.v.d.V.; Methodology, B.S., L.V., O.T.O., G.M.N. and M.v.d.V.; Project administration,
M.v.d.V.; Resources, O.T.O., G.M.N. and M.v.d.V.; Supervision, M.v.d.V.; Writing—original draft, B.S. and O.T.O.;
Writing—review and editing, L.V., G.M.N. and M.v.d.V.
Funding: This research was funded by NATIONAL RESEARCH FOUNDATION (NRF, South Africa), grant
number RJCT14050666847.
Conflicts of Interest: The authors declare no conflict of interest.
Abbreviations
AIF apoptosis inducing factor
MMP mitochondrial membrane potential
PI propidium iodide
PS phosphatidylserine
ROS reactive oxygen species
SD standard deviation of the mean
TMRE tetramethylrhodamine ethyl ester
References
1. Kerr, J.F.R.; Wyllie, A.H.; Currie, A.R. Apoptosis: A basic biological phenomenon with wide-ranging
implications in tissue kinetics. Br. J. Cancer 1972, 26, 239–257. [CrossRef] [PubMed]
2. Cryns, V.; Yuan, J. Proteases to die for. Genes Dev. 1998, 12, 1551–1570. [CrossRef] [PubMed]
3. Indran, I.R.; Tufo, G.; Pervaiz, S.; Brenner, C. Recent advances in apoptosis, mitochondria and drug resistance
in cancer cells. Biochim. Biophys. Acta Bioenerg. 2011, 1807, 735–745. [CrossRef] [PubMed]
4. Wong, R.S.Y. Apoptosis in cancer: From pathogenesis to treatment. J. Exp. Clin. Cancer Res. 2011, 30, 87.
[CrossRef] [PubMed]
5. Hao, D.C.; Gu, X.; Xiao, P. Anemone medicinal plants: Ethnopharmacology, phytochemistry and biology.
Acta Pharm. Sin. B 2017, 7, 146–158. [CrossRef] [PubMed]
6. Lukianchuk, A.; Khropot, O.; Konechnyi, Y.; Konechna, R.; Novikov, V. Wood anemone. Anemone Nemorosa
L. Analytical review. Sci. Pharm. Sci. 2017, 7, 38–42. [CrossRef]
7. Han, L.T.; Fang, Y.; Li, M.M.; Yang, H.B.; Huang, F. The antitumor effects of triterpenoid saponins from the
Anemone flaccida and the underlying mechanism. Evide.-Based Complement. Altern. Med. 2013, 2013, 517931.
8. Imreh, G.; Norberg, H.V.; Imreh, S.; Zhivotovsky, B. Chromosomal breaks during mitotic catastrophe trigger
γH2AX–ATM–p53-mediated apoptosis. J. Cell Sci. 2011, 124, 2951–2963. [CrossRef] [PubMed]
9. Mc Gee, M.M. Targeting the Mitotic Catastrophe Signaling Pathway in Cancer. Mediat. Inflamm. 2015, 2015,
146282. [CrossRef] [PubMed]
10. Hervouet, E.; Cartron, P.F.; Jouvenot, M.; Delage-Mourroux, R.; Hingorani, R.; Deng, J.; Elia, J.; McIntyre, C.;
Mittar, D.; Lin, G.G.; et al. Detection of Apoptosis Using the BD Annexin V FITC Assay on the BD
FACSVerseTM System. BD Biosci. 2016, 8, 1–2.
11. Krohn, A.J.; Wahlbrink, T.; Prehn, J.H.M. Mitochondrial Depolarization Is Not Required for Neuronal
Apoptosis. J. Neurosci. 1999, 19, 7394–7404. [CrossRef] [PubMed]
12. Florea, A.M.; Büsselberg, D. Cisplatin as an Anti-Tumor Drug: Cellular Mechanisms of Activity, Drug
Resistance and Induced Side Effects. Cancers 2011, 3, 1351–1371. [CrossRef] [PubMed]
13. Duprez, L.; Wirawan, E.; Berghe, T. Vanden; Vandenabeele, P. Major cell death pathways at a glance.
Microbes Infect. 2009, 11, 1050–1062. [CrossRef] [PubMed]
14. Hearst, M.; Nelson, D.; McCollum, G.; Ballard, L.M.; Millar, B.C.; Moore, S.; McClean, S.; Moore, J.E.; Rao, J.R.
Antimicrobial properties of protein extracts from wild mushroom fungi and native plant species against
hospital pathogens. J. Pharmacogn. Phyther. 2010, 2, 103–107.
15. Turker, H.; Yıldırım, A.B. Screening for antibacterial activity of some turkish plants against fish pathogens:
A possible alternative in the treatment of bacterial infections. Biotechnol. Biotechnol. Equip. 2015, 29, 281–288.
[CrossRef] [PubMed]
16. Schink, M.; Garcia-Käufer, M.; Bertrams, J.; Duckstein, S.M.; Müller, M.B.; Huber, R.; Stintzing, F.C.;
Gründemann, C. Differential cytotoxic properties of Helleborus niger L. on tumour and immunocompetent
cells. J. Ethnopharmacol. 2015, 159, 129–136. [CrossRef] [PubMed]Int. J. Mol. Sci. 2019, 20, 1217 15 of 15
17. Pietenpol, J.A.; Stewart, Z.A. Cell cycle checkpoint signaling: Cell cycle arrest versus apoptosis. Toxicology
2002, 181, 475–481. [CrossRef]
18. Koczurkiewicz, P.; Czyz, J.; Podolak, I.; Wójcik, K.; Galanty, A.; Janeczko, Z.; Michalik, M. Multidirectional
effects of triterpene saponins on cancer cells—Mini-review of in vitro studies. Acta Biochim. Pol. 2015, 62,
383–393. [CrossRef] [PubMed]
19. Busino, L.; Chiesa, M.; Draetta, G.F.; Donzelli, M. Cdc25A phosphatase: Combinatorial phosphorylation,
ubiquitylation and proteolysis. Oncogene 2004, 23, 2050–2056. [CrossRef] [PubMed]
20. Van Hooser, A.; Goodrich, D.W.; Allis, C.D.; Brinkley, B.R.; Mancini, M.A. Histone H3 phosphorylation is
required for the initiation, but not maintenance, of mammalian chromosome condensation. J. Cell Sci. 1998,
111, 3497–3506. [PubMed]
21. Hans, F.; Dimitrov, S. Histone H3 phosphorylation and cell division. Oncogene 2001, 20, 3021–3027. [CrossRef]
[PubMed]
22. Hagenbuchner, J.; Lungkofler, L.; Kiechl-Kohlendorfer, U.; Viola, G.; Ferlin, M.G.; Ausserlechner, M.J.;
Obexer, P. The tubulin inhibitor MG-2477 induces autophagy-regulated cell death, ROS accumulation and
activation of FOXO3 in neuroblastoma. Oncotarget 2017, 8, 32009–32026. [CrossRef] [PubMed]
23. Blanc, C.; Deveraux, Q.L.; Krajewski, S.; Jänicke, R.U.; Porter, A.G.; Reed, J.C.; Jaggi, R.; Marti, A. Caspase-3
Is Essential for Procaspase-9 Processing and Cisplatin-induced Apoptosis of MCF-7 Breast Cancer Cells.
Cancer Res. 2000, 60, 4386–4390. [PubMed]
24. Tait, S.W.G.; Green, D.R. Caspase-independent cell death: Leaving the set without the final cut. Oncogene
2008, 27, 6452–6461. [CrossRef] [PubMed]
25. Elmore, S. Apoptosis: A Review of Programmed Cell Death. Toxicol. Pathol. 2007, 35, 495–516. [CrossRef]
[PubMed]
26. Pollard, T.D.; Earnshaw, W.C.; Lippincott-Schwartz, J. Cell Biology, 2nd ed.; Saunders/Elsevier: Philadelphia,
PA, USA, 2007.
27. Cohen, G.M. Caspases: The executioners of apoptosis. Biochem. J. 1997, 326, 1–6. [CrossRef]
28. Kurokawa, M.; Kornbluth, S. Caspases and Kinases in a Death Grip. Cell 2009, 138, 838–854. [CrossRef]
[PubMed]
29. Circu, M.L.; Aw, T.Y. Reactive oxygen species, cellular redox systems, and apoptosis. Free Radic. Biol. Med.
2010, 48, 749–762. [CrossRef] [PubMed]
30. Boukes, G.J.; van de Venter, M. The apoptotic and autophagic properties of two natural occurring prodrugs,
hyperoside and hypoxoside, against pancreatic cancer cell lines. Biomed. Pharmacother. 2016, 83, 617–626.
[CrossRef] [PubMed]
31. Olaru, O.T.; Venables, L.; Van De Venter, M.; Nitulescu, G.M.; Margina, D.; Spndidos, D.A.; Tsatsakis, A.M.
Anticancer potential of selected Fallopia Adans species. Oncol. Lett. 2015, 10, 1323–1332. [CrossRef]
[PubMed]
© 2019 by the authors. Licensee MDPI, Basel, Switzerland. This article is an open access
article distributed under the terms and conditions of the Creative Commons Attribution
(CC BY) license (http://creativecommons.org/licenses/by/4.0/).You can also read