Incentives and disincentives for reducing sugar in manufactured foods - An exploratory supply chain analysis
←
→
Page content transcription
If your browser does not render page correctly, please read the page content below

Incentives and disincentives for
reducing sugar in manufactured foods
               An exploratory supply chain analysis

                     A set of insights for Member States in
                   the context of the WHO European Food
                      and Nutrition Action Plan 2015–2020

                                                  xxxx    i

Incentives and disincentives for
reducing sugar in manufactured foods
               An exploratory supply chain analysis

                     A set of insights for Member States in
                   the context of the WHO European Food
                      and Nutrition Action Plan 2015–2020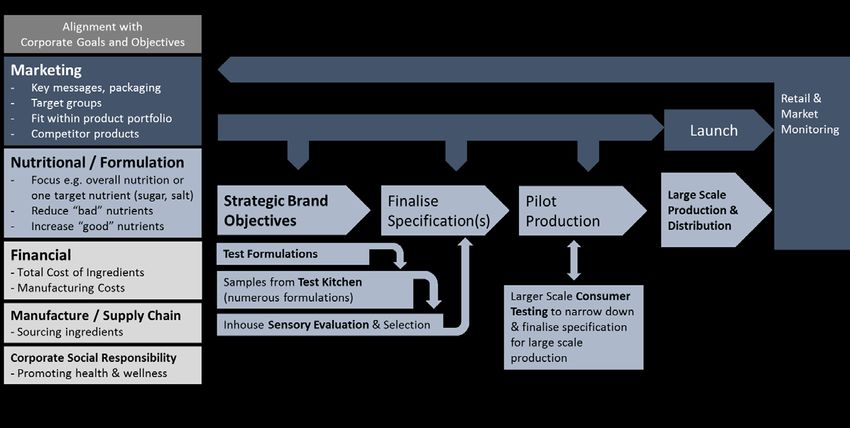
Keywords
Dietary Sucrose - adverse effects
Dietary Sucrose - administration and dosage
Food
Diet
Food Supply
Chronic Disease - prevention and control
Health Policy

    Address requests about publications of the WHO Regional Office for Europe to:
             Publications
             WHO Regional Office for Europe
             UN City, Marmorvej 51
             DK-2100 Copenhagen Ø, Denmark
    Alternatively, complete an online request form for documentation, health information, or for permission to
    quote or translate, on the Regional Office website (http://www.euro.who.int/pubrequest).

© World Health Organization 2017

All rights reserved. The Regional Office for Europe of the World Health Organization welcomes requests for permission to reproduce or
translate its publications, in part or in full.

The designations employed and the presentation of the material in this publication do not imply the expression of any opinion whatsoever
on the part of the World Health Organization concerning the legal status of any country, territory, city or area or of its authorities, or
concerning the delimitation of its frontiers or boundaries. Dotted lines on maps represent approximate border lines for which there may
not yet be full agreement.

The mention of specific companies or of certain manufacturers’ products does not imply that they are endorsed or recommended by the
World Health Organization in preference to others of a similar nature that are not mentioned. Errors and omissions excepted, the names
of proprietary products are distinguished by initial capital letters.

All reasonable precautions have been taken by the World Health Organization to verify the information contained in this publication.
However, the published material is being distributed without warranty of any kind, either expressed or implied. The responsibility for the
interpretation and use of the material lies with the reader. In no event shall the World Health Organization be liable for damages arising
from its use. The views expressed by authors, editors, or expert groups do not necessarily represent the decisions or the stated policy of
the World Health Organization.
Contents
1 Background . . . . . . . . . . . . . . . . . . . . . . . . . . . . . . . . . . . . . . . . . . . . . . . . . . . . . . . 1
1.1 Sugar and health in Europe . . . . . . . . . . . . . . . . . . . . . . . . . . . . . . . . . . . . . . . . . . . . 1
1.2 Leading sources of sugar in Europe . . . . . . . . . . . . . . . . . . . . . . . . . . . . . . . . . . . . . . . . 3
1.3 Efforts to reduce sugar intake in Europe . . . . . . . . . . . . . . . . . . . . . . . . . . . . . . . . . . . . . . 6
1.4 A food systems approach to reducing sugar intake . . . . . . . . . . . . . . . . . . . . . . . . . . . . . . . 12
1.5 Overview of policy brief . . . . . . . . . . . . . . . . . . . . . . . . . . . . . . . . . . . . . . . . . . . . . 12
2 Stages in the sugar supply chain . . . . . . . . . . . . . . . . . . . . . . . . . . . . . . . . . . . . . . . . . . . 14
2.1 Production . . . . . . . . . . . . . . . . . . . . . . . . . . . . . . . . . . . . . . . . . . . . . . . . . . . . 14
2.2 Processing . . . . . . . . . . . . . . . . . . . . . . . . . . . . . . . . . . . . . . . . . . . . . . . . . . . . 17
2.3 Imports and exports . . . . . . . . . . . . . . . . . . . . . . . . . . . . . . . . . . . . . . . . . . . . . . . 17
2.4 Use of sugar in manufactured foods and drinks . . . . . . . . . . . . . . . . . . . . . . . . . . . . . . . . . 18
2.5 Retail and food service . . . . . . . . . . . . . . . . . . . . . . . . . . . . . . . . . . . . . . . . . . . . . . 18
3 Industry perspectives on the (dis)incentives to the use of sugar in manufactured foods and drinks . . . . . . . . 19
3.1 Incentives to use sugar in manufactured foods . . . . . . . . . . . . . . . . . . . . . . . . . . . . . . . . . 20
3.1.1 Sugar is perceived as the gold standard for sweetness . . . . . . . . . . . . . . . . . . . . . . . . . . 20
3.1.2 Competitiveness among manufacturers and retailers . . . . . . . . . . . . . . . . . . . . . . . . . . 21
3.1.3 Maintaining “consumer choice” . . . . . . . . . . . . . . . . . . . . . . . . . . . . . . . . . . . . . . 22
3.1.4 Sugar provides essential functional qualities in manufactured foods . . . . . . . . . . . . . . . . . . . 22
3.2 Lack of incentives to reduce sugar . . . . . . . . . . . . . . . . . . . . . . . . . . . . . . . . . . . . . . . . 24
3.2.1 Sugar is a relatively cheap and abundant ingredient available from multiple sources . . . . . . . . . . 24
3.3 Disincentives to reducing the use of sugar . . . . . . . . . . . . . . . . . . . . . . . . . . . . . . . . . . . . 26
3.3.1 Consumer concern about the use of artificial sweeteners . . . . . . . . . . . . . . . . . . . . . . . . 26
3.3.2 Current regulations for labelling and use of artificial sweeteners . . . . . . . . . . . . . . . . . . . . . 27
3.4 Incentives for reducing sugar . . . . . . . . . . . . . . . . . . . . . . . . . . . . . . . . . . . . . . . . . . 29
3.4.1 Increasing consumer awareness of the health effects of sugar . . . . . . . . . . . . . . . . . . . . . . 29
3.4.2 Government policies and actions to reduce sugar intake . . . . . . . . . . . . . . . . . . . . . . . . . 29
3.4.3 Availability of a greater range of non-caloric sweeteners . . . . . . . . . . . . . . . . . . . . . . . . . 29
4 Insights for approaches to sugar reduction . . . . . . . . . . . . . . . . . . . . . . . . . . . . . . . . . . . . . 30
4.1 Limitations of the analysis . . . . . . . . . . . . . . . . . . . . . . . . . . . . . . . . . . . . . . . . . . . . 30
4.2 Using the framework of incentives . . . . . . . . . . . . . . . . . . . . . . . . . . . . . . . . . . . . . . . . 31
4.3 Six insights for effective sugar reduction strategies . . . . . . . . . . . . . . . . . . . . . . . . . . . . . . . 31
Appendix 1 – Methods . . . . . . . . . . . . . . . . . . . . . . . . . . . . . . . . . . . . . . . . . . . . . . . . . . 34
Appendix 2 – Sugar policies of the largest 10 global food and drink companies . . . . . . . . . . . . . . . . . . . . 38
References . . . . . . . . . . . . . . . . . . . . . . . . . . . . . . . . . . . . . . . . . . . . . . . . . . . . . . . 40Acknowledgements
This report is primarily the result of the contributions of Professor Corinna Hawkes (Centre for Food Policy, City,
University of London) and Fiona Watson (Independent Consultant), who conducted and wrote the supply chain
analysis. It also benefits from interviews conducted by Euromonitor International. Further contributions were provided
by Jo Jewell under the supervision of Dr João Breda and Dr Gauden Galea (WHO Regional Office for Europe).
Further thanks are due to Michel Chauliac, Ivon Milder, Liesbeth Temme, Sovianne ter Berg, Caroline van Rossum, Jim
Krieger, Julian Price, Anne Heughan, Yann le Bodo, Wilma Waterlander and the European Heart Network Expert Group
for their kind review and constructive input.
Thanks also to the University of Leeds Nutritional Epidemiology Group for their help in collating data on sugar intake
from European nutrition surveys. In particular, we acknowledge the efforts of Holly Rippin, Jayne Hutchinson and Janet
Cade.
Funding for this publication was partially provided by the European Commission Directorate General for Health and
Food Safety. We also acknowledge the support of funding from the Government of the Russian Federation within the
context of the WHO European Office for the Prevention and Control of Noncommunicable Diseases (NCD Office).
Definitions
Various definitions are use across jurisdictions, and some terms overlap. The below is a guide to the definitions
used in this report, but the authors accept they may not be exhaustive or definitive. Definitions have been
derived from WHO and Codex Alimentarius guidelines as well as European Union legislation.
Sugars
Sugars are carbohydrates that are soluble in water. They are usually crystalline and have a sweet taste. The two
main categories of sugars are monosaccharides, which are simple sugars, and disaccharides, which consist of
two monosaccharide molecules joined together.
Total sugars are free sugars + intrinsic sugars + milk sugars.
Free sugars include monosaccharides and disaccharides added to foods and beverages by the manufacturer,
cook or consumer, and sugars naturally present in honey, syrups, fruit juices and fruit juice concentrates.
Intrinsic sugars are sugars that are naturally contained within the structure of intact fruit and vegetables.
Milk sugars are sugars naturally contained in milk (lactose).
Added sugars are sugars added to foods and beverages by the manufacturer, cook or consumer.
Alternative sweeteners
These encompass non-caloric and caloric sweeteners that can either be natural or produced artificially.
Continued on next page
iv Incentives and disincentives for reducing sugar in manufactured foodsNon-caloric sweeteners
Natural sweeteners include stevia, luo han guo (monk fruit), thaumatin (katemfe fruit), pentadin (oubli plant),
monellin (serendipity berry) and brazzein (oubli climbing plant). They provide sweetness but no bulk to food
and drinks.
Artificial sweeteners are also referred to as “high-intensity” sweeteners and are up to 3000 times sweeter than
sugar (sucrose). Ten types of artificial sweeteners are allowed to be used in food and drink under European
Union (EU) regulations. Artificial sweeteners provide no bulk to food and drinks.
Caloric sweeteners
Polyols or sugar alcohols are a group of artificial and natural sweeteners that contain fewer calories than
sugar (2.4 kcal/g) and also have a lower sweetness index. They can be used to replace sucrose in foods,
while retaining bulk. There are seven polyols permitted for use in food under EU regulations but only in small
quantities as they have a laxative side effect.
Glucose/fructose syrups (also known as isoglucose) are purified concentrated aqueous solutions of nutritive
saccharides obtained from starch and/or inulin. This includes high-fructose corn syrup, derived from cornstarch,
which is used to replace sucrose in some foods/drinks. They have a sweet taste profile and are calorific.
Abbreviations and acronyms
ACP African, Caribbean and Pacific (countries)
AMSP Accompanying Measures for Sugar Protocol countries
AVMSD Audiovisual Media Services Directive
EBA Everything But Arms
EPA Economic Partnership Arrangements
EU European Union
HFCS high-fructose corn syrup
LDCs least developed countries
OQALI Observatoire de la Qualité de l’Alimentation
VCS Voluntary Coupled Support
WCRF World Cancer Research Fund
WHO World Health Organization
WTO World Trade Organization
vExecutive summary The amount of free sugars consumed in Europe exceeds levels recommended by the World Health Organization (WHO). A significant proportion of free sugars in the diet comes from manufactured foods, such as baked goods, breakfast cereals and sugary drinks. Excess sugar intake increases the risk of weight gain and diet-related noncommunicable diseases (NCDs) and is one of the major challenges in Europe in relation to the promotion of healthy diets. Yet the high free sugars content of certain manufactured products and the significant variation in composition, within product categories and between countries, indicate that there is significant scope to reduce the amount of sugar added to manufactured foods. Several countries have initiated national actions to reduce sugar intake, including reformulation, targeted taxation and interpretative front-of-pack labelling. These actions align with the policy tools recommended in the WHO European Food and Nutrition Action Plan 2015–2020 to create healthier food environments. Nevertheless, more fundamental action is needed. The publication of the WHO guidelines on sugar intake in 2015 has led to increasing demand from countries for more specific guidance on policies to reduce sugar intake. One recommendation for more fundamental change made by the WHO Action Plan, which is also supported by an increasing number of international reports, is to align wider “food systems” goals with the goal of making healthy diets available, affordable and appealing. In this context, this policy brief presents the results of a novel food supply chain analysis that identifies insights for governments to consider when designing sugar reduction strategies. It explores the incentives and disincentives to using sugar in manufactured foods throughout the “sugar supply chain” – the actors and activities that take sugar from farm to fork. It draws on the perspectives of entities working inside this sugar supply chain to explore the following key questions: • What are the incentives and disincentives for industry to reduce the amount of sugar in manufactured food and drink products? • At what point along the supply chain do these incentives and disincentives operate? • Are there opportunities to effectively enhance the incentives and/or lessen the disincentives for reducing sugar? The sugar supply chain consists of a series of stages: production (of sugar cane and sugar beet); trade (export and import of raw and refined sugar); processing (refining sugar cane and processing sugar beet); manufacture (adding sugar to foods and drinks); and retail (sale of manufactured sugary foods and drinks). This brief focuses on manufactured food and drink products from the perspective of industry actors in the supply chain, including producers, manufacturers and retailers. The analysis reveals that, throughout the supply chain, there are currently more incentives than disincentives to use sugar in manufactured foods (Table). Major incentives for manufacturers and retailers to use sugar in manufactured foods include the perception that sugar is the gold standard for sweetness, that sugar is needed to provide essential functional properties in manufactured foods, and that providing a range of products, including those high in sugar, is necessary to maintain “consumer choice” and competitiveness with other brands and retailers. The fact that sugar is a relatively cheap and abundant ingredient is not a direct incentive to use it, but means there is little incentive from the supply side not to use it. vi Incentives and disincentives for reducing sugar in manufactured foods
Incentives to use sugar in            1. Sugar is perceived as the gold standard for sweetness.
 manufactured foods                    2. Competitiveness among manufacturers and retailers.
                                       3. Maintaining “consumer choice”.
                                       4. Sugar provides essential functional qualities in manufactured foods.

 Lack of incentives to reduce          5. Sugar is a relatively cheap and abundant ingredient available from multiple
 sugar in manufactured foods              sources.

 Disincentives to reduce sugar         6. Consumer concern about the use of artificial sweeteners.
 in manufactured foods                 7. Current regulations on nutrition claims and use of sweeteners.

 Incentives to reduce sugar in         8. Increasing consumer awareness of the health effects of sugar.
 manufactured foods                    9. Government policy and actions to reduce sugar intake.
                                       10. Availability of a greater range of non-caloric sweeteners.

There are also incentives for reducing sugar. As consumer awareness of the negative impact of sugar on health grows,
that manufacturers and retailers are seeing a growing market in less sugary products. Policy action by governments to
stimulate reformulation or influence consumer demand for sugary products through labelling, marketing restrictions
and taxes, is also stimulating efforts to reduce sugar content in manufactured foods and drinks. The role of alternative
sweeteners is mixed, with their presence creating an opportunity to reduce sugar levels but with consumer concern
about them creating disincentives.

This framework of incentives can be used as a starting point to understand how incentives and disincentives
throughout the supply chain are influencing food environments, identify the most powerful leverage points for change,
and test out how actions taken in one part of the supply chain may have intended or unintended consequences on the
rest of the chain. It can also help to identify the range of elements needed to make comprehensive sugar reduction
strategies effective.

While it is a pilot study, the analysis of incentives and disincentives presented here leads to six interconnected insights
for the design of sugar reduction strategies.

Insight 1   Creating disincentives for manufacturers and retailers to add sugar to manufactured foods and drinks
            should be a strong focus of any sugar reduction strategy if the nutritional quality of the food supply is to
            improve.
Insight 2   Using policy to set a level playing field for manufacturers and retailers across the sector would allow a “race
            to the top” by ensuring they are competing to achieve public health goals.
Insight 3   Policies that reduce demand for sugar (for example, by helping children develop healthy taste preferences
            at an early age) will support the efforts of progressive manufacturers and retailers to grow demand for less
            sugary foods and drinks.
Insight 4   Since sugar is inherent to the functional properties of many manufactured foods, measures will be needed
            that encourage substitution of manufactured foods and drinks with fresh, non-manufactured foods with no
            added sugars. This will be necessary if sugar intake goals are to be achieved.
Insight 5   Careful consideration of the potential “substitution” effect of different policies is also needed. If sugar
            is replaced in different foods, what is it replaced with? This question must be considered to prevent
            unintended consequences.
Insight 6   Over the longer term, sugar reduction strategies also need to consider how to engage with a fuller
            transformation of the “sugar system”. Reformulation of manufactured foods has its limitations, and there
            are many incentives that mean sugar is an attractive and affordable ingredient for manufacturers. Changing
            these incentives more fundamentally will require a rethink of the whole sugar production system towards
            quality, rather than quantity, of production in the longer term.

                                                                                                 Executive summary       vii
Overall, the results of the study identify opportunities for increasing coherence between the economic and public health goals of food systems, while also highlighting some of the important challenges. The analysis shows that there is a strong case for more research and policy discussions about the most effective ways to bring about a health-oriented transformation of modern food systems. viii Incentives and disincentives for reducing sugar in manufactured foods
1 Background
1.1 Sugar and health in Europe
This policy brief explores the incentives and disincentives to the use of sugar in manufactured foods from supply to
demand.* Focusing on the perspectives of entities working within the “sugar supply chain” on the (dis)incentives that
affect them, the aim is to identify insights for public health policy-makers to consider when designing sugar reduction
strategies, while also testing out a novel methodology for identifying how food systems can be leveraged for better
diets and health. The context is the World Health Organization (WHO) recommendation that intake of free** sugars
should be less than 10% of total energy intake in both adults and children (strong recommendation) and preferably
below 5% of total energy intake (conditional recommendation***).1

This WHO guidance is based on evidence that shows, first, that adults who consume less sugar have lower body
weight and, second, that increasing the amount of sugars in the diet is associated with weight gain. 2 In addition,
research shows that children with the highest intakes of sugar-sweetened drinks are more likely to be overweight or
obese than children with a low intake of sugar-sweetened drinks. This is in a context where more than half of Europe’s
adults are now overweight (58.6%), including 23% who are obese.3 At the same time, overweight and obesity among
school-aged children (6–9 years of age) affect more than one in every four children in Europe.4 The highest levels of
childhood overweight are observed in southern European countries, where the prevalence of overweight is closer to
30%. In the majority of countries in Europe, rates of obesity and overweight are higher among low-income groups.5

The recommendation to reduce sugar in the diet is further supported by evidence showing higher rates of
dental caries (commonly referred to as tooth decay) when the intake of free sugars is above 10% of total energy
intake, compared with an intake of free sugars below 10% of total energy intake, which justifies the conditional
recommendation of 5%. Evidence shows that sugar has a role in the aetiology of dental caries, with a clear dose–
response relationship.6 Despite improvements in dental prevention and treatment, dental caries remains a significant
problem.7 In some European countries, up to 94% of children aged 5 years old have tooth decay.8

Finally, excessive consumption of sugar, especially in the form of sugar-sweetened drinks, is also reported to heighten
the risk of developing type 2 diabetes and cardiovascular disease.9 The effects for cardiovascular disease are most
evident when sugars are consumed in excess – that is, when accompanied by weight gain. However, some effects
independent of weight gain may also be present.10

In Europe, the available evidence indicates that sugars are consumed above recommended levels. The data typically
report in terms of added sugars, rather than free sugars, as used by WHO (see “Definitions”). Added sugars are more
narrowly defined, indicating that the level of free sugars intake is likely to be even higher. Moreover, evidence suggests
that dietary intake surveys may underestimate sugar intake.11

Eighteen countries in the WHO European Region report data on sugar intake, and in 13 of these countries the data
are recent (from 2010 onwards).12 Eight countries report on added sugars in at least one age group. While intake varies
across countries, the available data show that adults are universally consuming more than 5% of energy from added
sugars (roughly 25 g/day of added sugars, assuming an average 2000 Kcal diet) (Fig. 1). Some population groups
exceed 10% (roughly 50 g/day), with young men having the highest absolute intakes. Children and adolescents have
a higher percentage of their total energy intake coming from added sugars than adults, consuming more than 10% of
their daily energy intake from added sugars in Austria, Denmark, Estonia, Norway, Slovenia and the United Kingdom.

* The term “manufactured foods” is used throughout this policy brief to describe food and drink products that have been manufactured from different ingredients
through an industrial process.
** The terms “free” and “added” sugars are used throughout this policy brief; their definitions are similar but not interchangeable (see “Definitions”). WHO has based
its recommendation on free sugars intake. Dietary surveys and food labels often use added sugars.
*** Strong recommendations indicate that “the desirable effects of adherence to the recommendation outweigh the undesirable consequences” . Conditional
recommendations are made when there is less certainty “about the balance between the benefits
and harms or disadvantages of implementing a recommendation”.

                                                                                                                                          Background                 1
In the United Kingdom and Denmark, for example, children as young as 4 years old consume more than 40 g/day of
added sugars (Fig. 2).* In Portugal, more recent data not yet incorporated into the cross-country comparisons show
that 95% of the national population obtains more than 10% of their total energy intake from added sugars and one
quarter of children under 10 years of age consume more than 32 g/day.13
Fig. 1. Added sugars intake of adults in eight European countries
energy (TE)
!
+)*-&*.
*1&+-%
+.&+2%
,)&,-%
,.&,2%
-)&--%
-.&-2%
.)&.-%
..&.2%
/)&/-%
/.&/2%
0)&0-%
"
%+))2
*2&,)%
,*&/)%
/)3%
"
%+))2
*1&,-%
,.&/-%
/.3
+)**&*,
*1&0.%
+)*+
+.&,-%
,.&--%
-.&.-% &
..&/-%
/.&0-% &
$
"
#%+)*)&**
*1&+2%
,)&,2%
-)&-2%
.)&.2%
/)&0)%
#
+)*)&**
*1&,)%
,*&--%
-.&/-%
/.&1)%
" ! +)*+
*1&+-%
+.&.)%
.*&/-%
/.&1)%
+)*+&*-
*2&/-%
/.3%
) + - / 1 *) *+ *- */
* The Netherlands also provided nutrient intake data for total sugars, but then reported food group contributions based on mono/disaccharides and
polysaccharides separately. However, a further analysis of the data for population aged 7–69 years calculated free sugars intake as 14% of total energy intake, and
added sugars intake as 12% of total energy intake. Sugar consumption was higher in children than in adults.
2 Incentives and disincentives for reducing sugar in manufactured foodsFig. 2. Added sugars intake of children in seven European countries
!
-+,/(,0
,+(,.&
,/(,2&
"
&-++4
5,3&
#
-+,-
,0(,1&
-+,,(,.
/(4&
,+(,2&
$&-+,0(,1
(
/&
4& (
%
"
,.&
" ! -+,-
2(4&
,+(,-&
,.(,/&
-+,-(,/
,'0(.&
/(,+&
,,(,3&
+ - / 1 3 ,+ ,- ,/ ,1 ,3 -+
1.2 Leading sources of sugar in Europe
The available data suggest that the major sources of sugars in the European diet are sugary drinks and sweet foods,
including confectionery (sweets/candy), chocolates, cakes, pastries and biscuits.14 These manufactured foods and
drinks are a significant source of energy in Nordic and central European countries,15 while recent data from southern
European countries reveal the same trend.16 In Iceland, the main sources of added sugars were sugar-sweetened
beverages at 34%, with sweets, cakes and pastries the second largest contributor at 22%.17 Adults in the Netherlands
also get most of their added sugars (defined as mono/disaccharide intake) from non-alcoholic beverages (22%).18 In the
United Kingdom, manufactured foods also contribute most added sugars to the diet; the leading sources are sugary
drinks, baked goods, confectionary and breakfast cereals (Fig. 3). This is similar to findings from other high-income
countries, including the United States.19 It has been estimated that up to 90% of added sugars in the US diet comes
from manufactured foods.20
Background 3Fig. 3. Sources of added sugars in the UK diet
35 30
% of total added sugar
30 26 26
24
25 22 21
19 20
20 17 16 17 16
15 15
15 12
10
8 8 8
10 6 6 6 6 5 5
5
0
1.5 to 3 4 to 10 11 to 18 19 to 64 65+
Years of age
Buns, biscuits, cakes, pastries, puddings Breakfast cereals
Yoghurt, dairy desserts, ice cream Sugar, preserves, confecHonery
SoI drinks
Source: National Diet and Nutrition Survey 2008/09 to 2011/12. London: NatCen; 2014.
There are significant variations in sugar levels in manufactured foods between countries throughout Europe. For
example, one leading breakfast cereal manufactured by a top international brand contains up to 5 g/100 g more total
sugars when marketed in the Russian Federation compared to the United Kingdom.21 A similar variation in the sugar
content of one international brand of sugar-sweetened soft drinks has been observed across Europe.22 For example,
the same brand of soft drink had 23 g/330 ml can of total sugars when marketed in the United Kingdom compared
to 38 g/330 ml can in the Russian Federation and 40 g/330 ml can in Turkey and Turkmenistan. Variation between
different brands of similar products also exists within countries. Taking the example of breakfast cereals in the United
Kingdom, some flake options contain up to 35 g total sugars per 100 g (Kellogg’s Crunchy Nut Cornflakes), while
possible substitutes such as Kellogg’s Special K (17 g total sugars per 100 g) and Kellogg’s Corn Flakes (8 g total sugars
per 100 g) have completely different values.23 Comparable children’s varieties such as Kellogg’s Frosties can contain
even higher amounts of sugar (37 g total sugars per 100 g).
In 2015, the Dutch National Institute for Public Health and the Environment conducted an inventory of food
composition within product groups in the Netherlands, Germany, France, Italy, Finland, the United Kingdom and
Slovakia and found a large variation both within and between countries.24 The selected food groups (bread,
soup, sausages, cheese and breakfast cereals) were judged to make a significant contribution to the intake of salt,
saturated fat, and/or sugar among European populations. For sugar in foods, the study investigated the mono- and
disaccharides content of ready-to-eat breakfast cereals and found a large variation within and across countries (inter-
quartile range = 20 g) (Fig. 4). The highest median sugar content identified in a study country was 27 g/100 g, while
the highest sugar content identified in an individual breakfast cereal was 56 g/100 g. The authors concluded that
the wide variation in nutritional content points to significant scope for improving product composition, including by
reducing sugars in manufactured foods.
4 Incentives and disincentives for reducing sugar in manufactured foodsFig. 4. Variations in sugar content of breakfast cereals sold in different European Union Member States (MS)*
Mean Median [no. products]
Source: EuroFIR, edited by Dutch National Institute for Public Health and the Environment. 25
In France, the Oqali (Observatoire de la Qualité de l’Alimentation) initiative has been monitoring the composition of
specific food product categories since 2008, tracking changes in nutritional content but also exploring associations
between composition, presence of labels and claims on packaging, and price.26 In the case of breakfast cereals, the
initiative has also found significant variability in nutritional composition. For total sugars, the variation in some product
categories (e.g. muesli flakes with added sugar or frosted cornflakes) was as high as 39%, with a median sugar content
of 27 g/100 g and 31 g/100 g respectively.27 Similar results were found for cakes and biscuits, with, for example, a
variation for “breakfast biscuits” at 28% (median = 25.7 g, but with some products exceeding 29 g) and as high as 53%
for fruitcake (median = 29.5 g, but with some products exceeding 43 g).28 Comparison between 2008 and 2011 shows
that there have been some minor falls in median sugar levels in breakfast cereals, but the levels are still universally
high, with significant variation across brands (Fig. 5). Monitoring found no systematic cross-category differences
in composition between “entry-level” products or retailers’ own-brand (private label) ranges when compared
to other “higher-end” market sectors such as national brands.29
* In the boxplot, the mean is indicated with a diamond (◊), the median with a horizontal line (–), and the 25th and 75th percentiles (P25 and P75) are indicated by the
bottom and top of the boxplot; the minimum and maximum are indicated with the whiskers below and above the box. “ALL” indicates data of the countries combined.
“MS” indicates Member State. The number of products for which data were available is indicated between brackets [n]. To describe the variation, the inter-quartile
range (IQR), and the coefficient of variation (CV%) are presented. The IQR is the difference between P25 and P75. This gives an indication of the variation for the bulk
of items within the food group. The CV% is the ratio of the standard deviation to the mean composition (%) expressed as a percentage.
Background 5Fig. 5. Variation in total sugars content of breakfast cereals sold in France (changes 2008 – 2011)*
60
50
40
Total sugars (g/100g)
30
20
10
0
2008 2011 2008 2011 2008 2011 2008 2011 2008 2011 2008 2011 2008 2011 2008 2011 2008 2011
Chocolate- and Chocolate- Filled cereals Honey-flavoured Fibre-rich "Light" cereals Crunchy muesli Muesli flakes Cornflakes
caramel- flavoured cereals cereals
flavoured cereals
cereals
Source: Oqali30
1.3 Efforts to reduce sugar intake in Europe
Concerns about unhealthy diets in the WHO European Region are not limited to sugar. In general, diets in Europe are
characterized by an excessive food energy intake and excessive intake not only of sugar but also of saturated fats, trans
fats and salt, often consumed as manufactured foods and sugar-sweetened beverages. At the same time, inadequate
consumption of vegetables, fruits and whole grains remains a significant challenge.31
With the aim of improving diets as a whole, the WHO European Food and Nutrition Action Plan 2015–2020
recommends that governments use a variety of policy tools to create healthier food environments, improve literacy
and skills throughout the life-course, reinforce health systems, support surveillance and research, and take a “health-
in-all-policies” approach.32 To create healthier food environments, the plan recommends that countries introduce
restrictions on the marketing of foods to children and consider consumer-friendly labelling, pricing policies and school
food standards, as well as “reformulation strategies”. This is a call echoed by many other actors, based on evidence
of effectiveness but also cost implications.33 A report by the McKinsey Global Institute called for implementation of
as many interventions as possible, including reducing default portion sizes and introducing marketing restrictions,
delivered “at scale and … effectively by the full range of sectors in society” in order to “overcome obesity” and limit the
damaging costs to economies.34
With attention on the harmful health impact of excessive sugar intake having increased since publication of the WHO
guidelines, several of these strategies are being used with the goal of reducing sugar intake in Europe. Initiatives
designed to encourage “reformulation” are now beginning to target sugar. European Union (EU) Member States
have been working collectively since 2015 to encourage reformulation to reduce free sugars (Box 1). In 2017, 76%
of countries in the WHO European Region reported that measures are being put in place to reformulate foods and
beverages high in saturated fatty acids, trans fatty acids, free sugars or salt/sodium.35 The largest proportion of these
* The methodology for monitoring food composition, based on collecting nutrition and ingredient information from food packaging for specific food categories
and “families” of food products (i.e. subcategories), has since been incorporated into the Joint Action on Nutrition and Physical Activity (JANPA), involving 25 EU
Member States and Norway (http://www.janpa.eu/about/project.asp). In Fig. 5. the 25th and 75th percentiles (P25 and P75) are indicated by the bottom and top of
the boxplot; the minimum and maximum are indicated with the whiskers below and above the box.
6 Incentives and disincentives for reducing sugar in manufactured foodsefforts still focus on salt (57%), but 37% of countries report having specific initiatives to reduce sugar. In addition, 17%
have reportedly agreed sugar reduction targets (76% of which depend exclusively on voluntary action). Examples of
four countries – France, the Netherlands, Norway and the United Kingdom – explicitly working to reduce free sugars in
manufactured foods, with well-defined actions and targets are decsribed in Box 2.
Box 1. EU approach to reformulation of manufactured products
The EU platform for action on diet, physical activity and health is a forum for European-level organizations,
including representatives of the food industry, consumer organizations and public health NGOs, willing to
commit to “tackling current trends in diet and physical activity”.36 It was set up in 2005, and since then platform
members have made more than 300 voluntary commitments, including commitments by industry to reduce
sugars in foods and/or reduce portion sizes. Commitment holders submit annual monitoring reports on
activities and progress against commitments, but - to the authors’ knowledge - there has been no attempt
to objectively quantify the size of the impact of these commitments on, for example, the marketing and
composition of foods.
In addition, the EU Framework for National Initiatives on Selected Nutrients was adopted in 2011 by the High
Level Group on Diet, Physical Activity and Health (formed exclusively of EU Member States). This framework
expanded previous work on salt to other nutrients, including saturated fat and sugar. In 2015 a specific Sugar
Annexe was developed to support, guide and harmonize efforts across countries.37 Priority is given to food
categories that “commonly represent major sources of added sugars [in diets across Member States], that have
a high public health impact or that are recommended to be consumed”. According to these criteria, the relevant
food categories where efforts should be focused are sugar-sweetened beverages, dairy products, breakfast
cereals, bread and bread products, confectionary, bakery goods (including cakes and biscuits), ready meals,
sauces, savoury snacks, desserts, canned fruits, and school and catering offer. On the basis of experience in
Member States, it was agreed to set a general benchmark for added sugars reduction of a minimum of 10% by
2020 in food products against 2015 baseline levels, and to adhere to the principles that reformulation should: (i)
be mainstreamed across products with the largest market share; (ii) improve the overall nutrient profile of the
products; (iii) apply to all food industry actors to ensure a level playing field; and (iv) pay due attention to the
concerns of inequalities and children’s diets.
In 2016, the Dutch and Maltese presidencies* of the EU also focused attention on reformulation. A Roadmap
for Action on Food Product Improvement was published in 2016, highlighting the need for government action,
but also calling for public private cooperation.38 The Council Conclusions** on Food Product Improvement that
emerged following the Dutch presidency called on food business operators throughout the food chain to take
responsibility for improving the mainstream products and meals they offer and, by doing so, to contribute to
making the healthy choice the easy choice.39 The Council Conclusions under the Maltese presidency restated
the importance of food reformulation and consumer-friendly labelling in driving improvements to food
products.40
* The presidency of the Council of the European Union is responsible for the functioning of the Council. It rotates among EU Member States every six months. The
presidency is not an individual, but rather a position held by a national government. The presidency’s function is to chair meetings of the Council, determine its
agendas, set a work programme, and facilitate dialogue both at Council meetings and with other EU institutions.
** A process used to identify specific issues of concern for the EU and outline particular actions.
Background 7Box 2. Four examples of European countries with sugar reduction strategies
France
The French government has, since 2008, pursued a voluntary approach in the context of their national nutrition
action plan. “Charters of voluntary engagement” have been signed with 37 food manufacturers and retailers,
which include specific commitments to reduce sugar in certain products. While each engagement is agreed on
a case-by-case basis with the government, a typical commitment might be for a breakfast cereal manufacturer
to undertake to reduce sugar in their range of products by between 3.8% and 15%.41 Two examples include
commitments signed with the main retailer chains in France, Casino and Leclerc, covering a range of product
categories and private label products accessible to lower socioeconomic groups.42
The Netherlands
In the Netherlands, sector-wide agreements have been reached covering the period 2014–2020 with the aim
of making it easier for consumers to consume less salt, saturated fat and energy.43 The agreements involve,
alongside government authorities, the Dutch Central Bureau for the Food Trade, the Dutch Federation for the
Food Industry, the Royal Dutch Hotel and Catering Association and the Dutch Catering Association. To achieve
the objectives by 2020, manufacturers are encouraged, wherever possible, to reduce the energy density of
products via a reduction in sugar and/or (saturated) fat and/or portion sizes. In relation to sugar, specific
agreements have been reached for dairy drinks and desserts, and for soft drinks category-based benchmarks
have been established.44 In the case of soft drinks, in 2015 an agreement was made to lower the weighted
average energy density per 100 ml to 10% by 2020 compared to the baseline year 2012. In January 2017, the
reduction target was made more stringent with a maximum energy density of to 5%. The agreement consists
of three tracks: (i) to increase sales of less energy-dense soft drinks and decrease sales of high energy-dense
products; (ii) to lower the energy density of certain types of drinks through reformulation; and (iii) to decrease
portion sizes of energy-dense products.
Norway
In Norway, the health minister established a Food Industry Group to address the industry’s responsibilities
to improve public health. In late 2016, the members of this group signed a letter of intent for improving the
Norwegian diet.45 In this letter, the industry set specific population intake goals to be achieved:
(i) reduction in salt intake from 10 g per day to 8 g per day (by 2021);
(ii) a 12.5% reduction of added sugars intake, corresponding to a population average intake of about 11% of
total energy from added sugars (by 2021);
(iii) reduction in intake of saturated fat from 14% of energy to 13% of energy (by 2018); and
(iiii) increase in the intake of healthy foods such as fruit, vegetables, whole grain products and seafood by 20%
(by 2021).
The signatories are free to choose the approach they would like to take in order to contribute to the common
goal, but possible actions include:
• reformulating existing products, creating new healthy products or shifting advertising to healthier products;
• helping consumers to make healthier choices, such as through placement, portion sizes, pricing, packaging,
labelling and advertising.
Continued on next page
8 Incentives and disincentives for reducing sugar in manufactured foodsA specific goal to reduce sugar in sweetened beverages by 20% has already been set; in other areas, discussion
is underway. When it comes to actions relating to sugar, the prioritized categories are the most common
sources of added sugar, based on food consumption data:
• breakfast cereals
• bakery goods (including cakes and biscuits)
• fruit and berry products (including jams and drinks)
• dairy products (including milk, yoghurts and ice cream)
• sugar and confectionery (including chocolate, sweets and sweet spreads)
• sugary beverages.
A process of evaluation is planned on an annual basis in which signatories are invited to publicly show their
contribution in the preceding year.
United Kingdom
In the United Kingdom, guidelines have been developed for all actors in the food and drink industry; these
include 14 targets specific to particular food categories, and the aim is to reduce overall sugar across a range of
products that contribute most to children’s sugar intakes by at least 20% by 2020, including a 5% reduction in
the first year of the programme.46 The guidelines recognize that, depending on the product category, different
approaches will be more effective. In the case of confectionery, portion size reductions will potentially achieve
more; in the case of sugary drinks, a two-tiered tax has been introduced to drive down sugar content.47
Some governments have also introduced taxes on sugary drinks (N = 9), along with “consumer-friendly front of pack”
labelling using words, colours or symbols (N = 13), school food standards (N = 40), and some limited marketing
restrictions (N = 25), with the aim (among others) of reducing sugar intake by influencing the availability and
promotion of foods high in sugar and reducing consumer demand. Notable developments include adoption of the
Nutri-Score front-of-pack logo in France,48 and a system of warning symbols (or “negative front-of-pack labelling”) on
foods packages in Israel to highlight their nutritional content, using easily identifiable icons.49 Some of these measures,
such as taxation and front-of-pack labelling, also explicitly aim to influence reformulation,50 while other initiatives aim to
directly target consumers by limiting access to some products (e.g. in public and childhood settings), influencing social
norms (e.g. through mass media) or providing advice at an individual level.51
Some leading food manufacturers and supermarket chains have also committed to reducing free sugar levels through
voluntary reformulation efforts, as exemplified in Box 3, and the largest 10 global food and drink companies now have
sugar reduction policies (Appendix 2). These reformulation efforts involve either reducing or removing added sugars
without replacement, replacing sugar with non-caloric/low-energy sweeteners, or replacing sugar with alternative
ingredients. For foods where sugar provides bulk, the entire composition of the product has to be modified to ensure
that replacement of sugar is feasible while at the same time maintaining the product’s form and ensuring replacement
ingredients do not replicate or increase energy density. A brief insight into considerations manufacturers make when
formulating and reformulating a product is found in Box 4. Evidence from France suggests the products chosen for
reformulation have higher (or much higher) sugar content than the market median.52 So, while this indicates willingness
to reformulate products across the full market range, it also indicates that sugar reduction efforts are made in the
context of a very “sweet” starting point.53
Background 9Box 3. Examples of reformulation
Reducing added sugars without any replacement
In the United Kingdom, Tesco has lowered the sugar content of its own-brand fruit yoghurt. Tesco reports that
consumers found this to be acceptable because the fruit flavour was enhanced when not masked by sugar.54
Similarly, in France, Nestlé committed to reduce sugar in infant foods; specifically, they committed to no added
sugars in fruit-based desserts or snacks in 90% of their product ranges, and an increase from 11% to 57% of
cereal-based products for infants that have no added sugars.55 Also in France, Orangina Schweppes committed
to a 7–12% reduction in added sugars in their leading drinks products.56 In the Netherlands, a different
approach has been adopted, with sector-wide agreements to achieve specific benchmarks. For example, a
benchmark of 11.6 g maximum sugar content for yoghurts has been calculated on the basis of a 5% reduction in
sugar from baseline; for desserts and puddings, a benchmark of 18.2 g was calculated.57
Replacing sugar with low-energy sweeteners
Globally, Unilever has a commitment to reduce sugar in its sweetened tea beverages by 25% by 2020. Between
2010 and the end of 2016, a 12% reduction had been reported worldwide. Unilever markets beverages globally,
including unsweetened, diet (zero calories), and sugar-reduced teas. All variants on the UK market are sugar-
reduced using stevia (steviol glycosides), a natural sweetener, and are low-calorie. As stevia has a bitter taste
and affects the mouthfeel of iced tea, 4.5 g/100 ml of sugar is still added.58 Similarly, in France, Quick – a major
“fast food” service chain – committed to reduce sugar in drinks by between 19% and 100%. The major vehicle
for achieving this was also to introduce stevia-based drinks.59
Replacing sugars with alternative ingredients: Dolmio Original Bolognese Sauce
Dolmio Original Bolognese Sauce is sold throughout Europe and the added sugars content has been gradually
reduced over time. It now contains 5.6 g total sugars per 100 g, of which 1.7 g is added sugars. In other words,
70% of the total sugars originate from the tomato.
Added sugars/100 g
1994 3.8 g
2006 2.6 g
2012 1.9 g
2016 1.7 g
When added sugars were removed, the remaining ingredients had to be rebalanced to replicate the taste
preferred by customers. Herbs such as fennel and basil were used to balance the flavour and deliver taste. The
largest volume of Dolmio tomato sauces (90%) is sold in the United Kingdom and Ireland, and a whole range
of “No added sugars” items were launched in these countries in 2017. If successful, they will be sold in other
European countries as well.60
Capitalizing through rebranding: Honey Monster Puffs
In the United Kingdom, following falling sales, Sugar Puffs were rebranded as Honey Monster Puffs in 2014.
Added sugars were replaced with 20% more honey, lowering the total sugar content from an initial 31 g/100 g
to 28.6 g/100 g. The packaging was redesigned with traffic light labelling included on the front of the pack. The
launch of the new product was supported by a £3 million marketing campaign. More recently, the recipe was
changed again and the total sugars content reduced to 22 g/100 g, which meant that the traffic light for sugars
could be changed from red to amber.61
Continued on next page
10 Incentives and disincentives for reducing sugar in manufactured foodsExtending the range of products: tomato ketchup
Tesco now sells four variants of its own-brand tomato ketchup in the United Kingdom, with variations in the
amount of total sugars to suit a range of consumer preferences.62
Organic Standard Everyday Reduced salt and sugar
Total sugars/100 g 18.8 g 18.1 g 13.4 g 5.7 g
Price/100 g 32 p 11 p 8p 11 p
Box 4. Considerations when formulating and reformulating manufactured food and drinks
Reformulation is a complex process involving many actors and numerous departments within a company
manufacturing foods, as illustrated for breakfast cereals in Fig. 6. It takes up to six months to complete and
involves many factors, including product specification, packaging, testing and quality control. For retailers,
existing stock has to be sold before being replaced with reformulated products, and this can take up to three
months.
Product development requires input from the technical team, who will be heavily involved in developing
formulations, while finance will ensure that costs are controlled. Manufacturing must also ensure that
new formulations are compatible with the existing production process. The corporate social responsibility
department will be involved with setting and driving nutritional commitments; it will also monitor aspects
such as ingredient sourcing to ensure that it is in compliance with factors such as responsible sourcing and
sustainability.
Fig. 6. Reformulation of cereal products to reduce sugar content
Source: Euromonitor International63
Background 111.4 A food systems approach to reducing sugar intake It is evident that, from a health perspective, more fundamental action is needed to bring down the levels of sugar in manufactured foods in Europe – action that expands the implementation of known effective strategies, but also considers possible new approaches. A “food systems” approach is increasingly being discussed to drive forward more fundamental change in improving diets as a whole. Food systems can be defined as “all the elements (environment, people, inputs, processes, infrastructures, institutions, etc.) and activities that relate to the production, processing, distribution, preparation and consumption of food, and the outputs of these activities, including socioeconomic and environmental outcomes”.64 A food systems approach to improving diet and health means aligning the way that food systems function, and the incentives and disincentives that influence the behaviour of food system actors, with the availability, affordability, acceptability and appeal of healthy, nutritious diets. The proposal that food systems should align to produce healthier, available, affordable and acceptable diets has been made by a series of recent international initiatives and reports. The WHO European Food and Nutrition Action Plan 2015–2020 specifically states that creating healthier food environments will require: creating or adjusting incentives along the food supply chain, such as through investments in production, supply chain logistics and procurement policies, in order to realign broader food system policies with public health goals and improve the availability and affordability of healthy diets.65 The report Nutrition and food systems, published in 2017 by the High Level Panel of Experts of the Committee on World Food Security, recommends that food systems should be reoriented to improve diet and nutrition outcomes.66 The Work programme of the United Nations Decade of Action on Nutrition (2016–2025) states that “Coherent and innovative actions covering the entire food system – from inputs and production, through processing, storage, transport and retailing to consumption – are needed to ensure access to sustainable, healthy diets for all”.67 In its report Food systems and diets (2016), the Global Panel on Agriculture and Food Systems for Nutrition calls for “incentives for private sector actors throughout the food system so that they can make decisions more favourable to the adoption of higher-quality diets”.68 Recommendations on improving food systems to improve diets have also featured in government-endorsed strategies and advocacy strategies of civil society organizations. For example, the EU Action Plan on Childhood Obesity 2014– 2020 identifies agricultural producers, retailers and manufacturers as key actors influencing the supply of foods,69 and EU Member States have started to put transforming food systems for healthy diets on the policy agenda.70 A landmark publication on food policies to prevent cardiovascular diseases from the European Heart Network recognized that today’s food systems are intricate – with long food chains that involve many different actors – and called for action along the supply chain to positively influence what food is produced, how it is sold and at what price.71 1.5 Overview of policy brief In this context, the remaining sections of this policy brief present the results of an exploratory food systems-oriented analysis for sugar. It explores the perspectives of the industries that make up the sugar supply chain, along with some supply chain experts, on the incentives and disincentives to the use of sugar levels in manufactured foods. The aim is to identify insights for governments to consider when designing sugar reduction strategies, while also testing out a novel methodology for identifying how food systems can be leveraged for better diets and health. The method focuses on one element of food systems: food supply chains, also sometimes termed “value chains”.72 While the term food supply chains is widely used to describe the actors and activities that take food from farm to fork, gate to plate, boat to throat (see, for example, Fig. 7), analysing supply chains from a nutrition and health perspective is relatively new. The method used here builds on studies that have proposed and begun to use supply chains as 12 Incentives and disincentives for reducing sugar in manufactured foods
a framework for better understanding how to improve diets.73 It adopts this supply chain approach as a means of
examining the incentives and disincentives from upstream supply to downstream demand. This enables, for example,
an exploration of whether an “upstream” supply-side change, such as the significant changes to EU sugar policy in 2017
involving liberalization of the sugar beet and isoglucose markets, would alter incentives for the use of sugar.* 74

As an exploratory scoping exercise, the analysis focuses in on just one aspect of sugar reduction through the supply
chain – reducing the use of sugars in manufactured food and drink products; and in exploring largely one perspective
– the perspective of the industry actors in the supply chain, including producers, manufacturers and retailers. These
specific aspects were selected because manufactured foods contribute the overwhelming majority of free sugars in
European diets; reformulation is being widely considered as a policy option; and understanding the perspective on
the (dis)incentives from an industry standpoint could provide novel insights into the barriers and opportunities for
government sugar reduction strategies.

A secondary aim was to test out a novel way to analyse sugar supply chains taking account of nutrition and public
health aspects. As indicated, the method adopted is exploratory in nature. It involved desk research to map the supply
chain; interviewing informants from this supply chain; and reviewing relevant literature to inform, complement and
validate the interviews. The primary source of data was information gained from 34 interviews with informants with
experience and expertise across the sugar supply chain. These included eight interviews with informants involved in
sugar production, trade and processing; 15 interviews with those involved in manufacture of food and drink; nine
interviews with informants involved in retail; and two with academic experts.

These interviews were carried out by an academic institution (Centre for Food Policy, City, University of London) and
a market research company (Euromonitor International). Euromonitor International focused on interviewing those
involved along the supply chain in the manufacture of breakfast cereals, including those active in the United Kingdom
and the Russian Federation. The rationale for involving both an academic institution and a market research company
was that Euromonitor International had better access to business informants and thus could increase the number of
interviews, while the Centre for Food Policy was able to ensure that academic rigour was used in the analysis of the
interviews. The methods are described in greater detail in Appendix 1.

This brief consists of four sections. Following this Background section, Section 2 describes a generic supply chain for
sugar. Section 3 then presents the results of the supply chain analysis that addresses a series of questions:

•   What are the incentives and disincentives for industry to reduce the amount of sugar in manufactured food and
    drink products?
•   At what point along the supply chain do these incentives and disincentives operate?
•   Are there opportunities to effectively enhance the incentives and/or lessen the disincentives for reducing sugar?

On the basis of these findings, Section 4 sets out six key insights for governments to consider when designing sugar
reduction strategies.


* Isoglucose is a glucose/fructose syrup sweetener sweetener made from corn, wheat or rice starch. When made from corn, it is also referred to as high-fructose
corn syrup (HFCS).

                                                                                                                                       Background             13
You can also read