Inclusion of frequency control constraints in energy system investment modeling
←
→
Page content transcription
If your browser does not render page correctly, please read the page content below
Inclusion of frequency control constraints in energy system
investment modeling

Downloaded from: https://research.chalmers.se, 2021-09-11 11:09 UTC

     Citation for the original published paper (version of record):
     Ullmark, J., Göransson, L., Chen, P. et al (2021)
     Inclusion of frequency control constraints in energy system investment modeling
     Renewable Energy, 173: 249-262
     http://dx.doi.org/10.1016/j.renene.2021.03.114

N.B. When citing this work, cite the original published paper.

research.chalmers.se offers the possibility of retrieving research publications produced at Chalmers University of Technology.
It covers all kind of research output: articles, dissertations, conference papers, reports etc. since 2004.
research.chalmers.se is administrated and maintained by Chalmers Library

                                           (article starts on next page)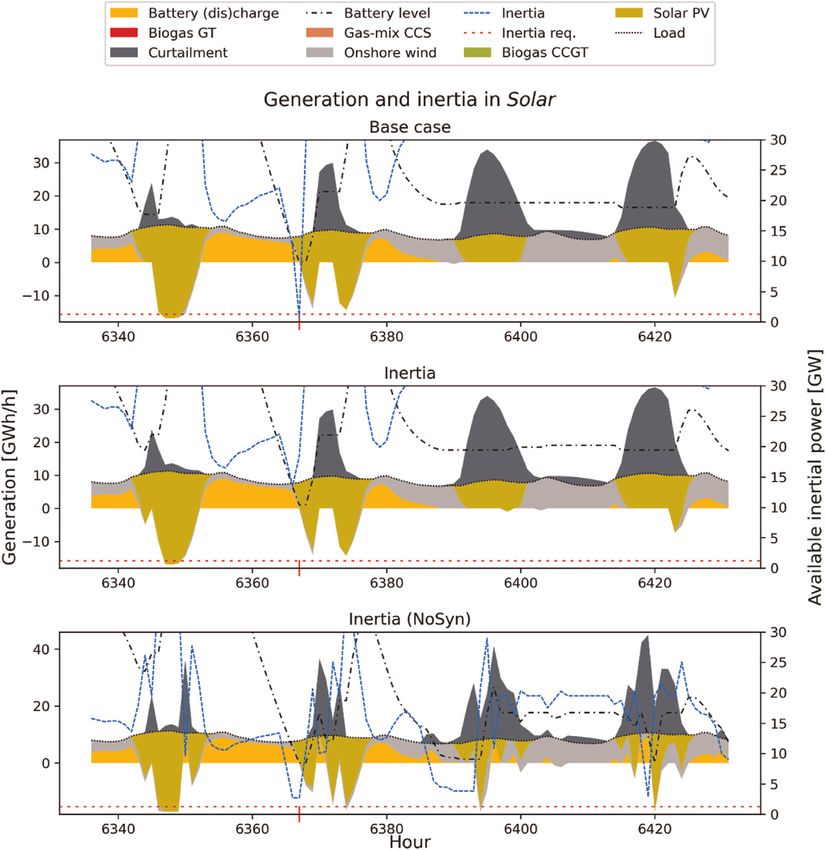
Renewable Energy 173 (2021) 249e262

                                                             Contents lists available at ScienceDirect

                                                                   Renewable Energy
                                              journal homepage: www.elsevier.com/locate/renene

Inclusion of frequency control constraints in energy system
investment modeling
Jonathan Ullmark a, *, Lisa Go
                             € ransson a, Peiyuan Chen b, Massimo Bongiorno b,
Filip Johnsson a
a
 Department of Space, Earth and Environment, Division of Energy Technology, Chalmers University of Technology, Gothenburg, 412 96, Sweden
b
 Department of Electrical Engineering, Electric Power Engineering, Power Grids and Components, Chalmers University of Technology, Gothenburg, 412 96,
Sweden

a r t i c l e i n f o                                  a b s t r a c t

Article history:                                       This study investigates how the inclusion of frequency control constraints in electricity system modeling
Received 3 December 2020                               impacts the levels of investment and dispatch in electricity generation and storage technologies for
Received in revised form                               futures that include high-level penetration of variable renewable energy. This is achieved using a linear
1 March 2021
                                                       cost-minimizing investment and dispatch model using historic load, wind and solar conditions from
Accepted 22 March 2021
Available online 28 March 2021
                                                       Spain, Ireland, Sweden and Hungary for Year 2050. With an hourly time-resolution, constraints are added
                                                       so as to ensure that, within each hour, sufficient inertial power and reserves are available to control the
                                                       frequency of the power grid. Comparing the results obtained with and without these constraints reveals
Keywords:
Synthetic inertia
                                                       that the main impacts on the results are from battery investments and operation. Furthermore, it is
Fast frequency reserve                                 found that the reserve requirements exert a greater impact on system composition and operation than
Operating reserves                                     do the inertial power requirements.
Frequency control                                        © 2021 The Authors. Published by Elsevier Ltd. This is an open access article under the CC BY license
Energy system modeling                                                                                             (http://creativecommons.org/licenses/by/4.0/).
Variable renewable energy

1. Introduction                                                                          synchronous inertia that is insufficient to secure frequency stability.
                                                                                         In addition to reduced synchronous inertia, operating reserves
    Variable renewable energy (VRE) sources, such as wind and                            (ORs) can also be adversely affected when dispatchable power
solar PV, are projected to provide a substantial proportion of our                       plants are replaced by VRE [2].
electricity if we are to meet climate targets. Given the non-                                Since both inertia and OR are vital to power system operation
dispatchable nature of these energy sources, their increased                             and may be adversely affected by a transition to VRE, various power
deployment will also increase the need for variation management                          engineering tools that simulate the physical principles and re-
strategies (VMS) for efficient integration of VRE, thereby main-                          lationships have been used to study how frequency deviations
taining its value with increasing share. Examples of VMS are the                         could be managed in future systems [3,4,5,6,7,8] and more). How-
strategic use of batteries, hydrogen storages and power-to-heat                          ever, the tools used to simulate frequency responses are unable,
systems, as well as flexible combined heat and power plants [1].                          due to limitations linked to model complexity and purpose, to
However, the transition to VRE-dominated power systems                                   optimize the system in terms of generation capacity and dispatch
adversely affects the conventional mode for controlling the fre-                         on a system level.
quency of the power grid. Conventional grid frequency control re-                            To study how new technologies and constraints affect cost-
lies on the mechanical inertia in synchronous generators to                              optimal generation capacity and dispatch, several energy systems
dampen and decelerate fluctuations. However, the dominant wind                            models have been developed with varying levels of detail in terms
turbine type (variable speed) is interfaced through converters, as                       of temporal resolution and span, as well as operational constraints,
are all solar PVs, and thus does not provide synchronous inertia.                        geographic scale and technology representation [9,10,11,12,13,14].
Thus, the transition to VRE carries with it the risk of a level of                       Some of these models have been used to study the system impact of
                                                                                         constraints on reserve capacity [15,16] and inertia [17]. Other
                                                                                         studies have included constraints on inertia or reserves but have
    * Corresponding author.                                                              not explicitly studied them [10,18,19]. Nonetheless, studies
      E-mail address: Jonathan.Ullmark@chalmers.se (J. Ullmark).

https://doi.org/10.1016/j.renene.2021.03.114
0960-1481/© 2021 The Authors. Published by Elsevier Ltd. This is an open access article under the CC BY license (http://creativecommons.org/licenses/by/4.0/).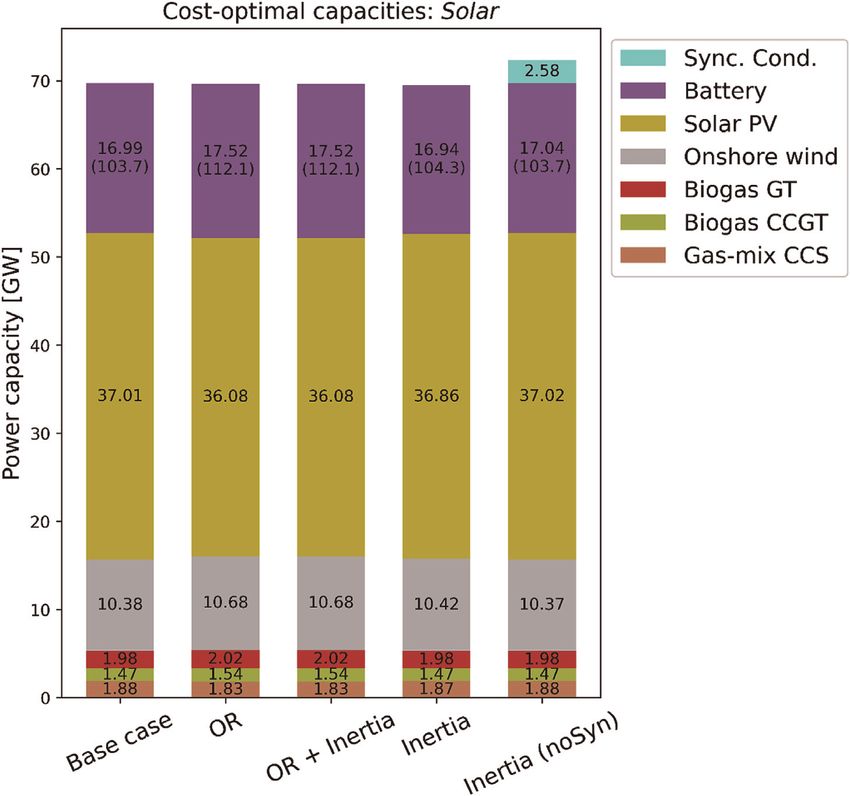
€ransson, P. Chen et al.
J. Ullmark, L. Go                                                                                                                        Renewable Energy 173 (2021) 249e262

investigating how inertia and reserves impact the cost-optimal                             FFR when delivered from batteries. The assumed H-values are
system composition in future carbon-neutral electricity systems                            based on [20]; and can be found in Table 1, along with the resulting
with high shares of VRE are lacking. In particular, there is a need to                     increased power output during a dimensioning fault. The latter was
investigate the extent to which strategies aimed at managing the                           calculated using Eq. (1) and the inertia constant, so as to keep the
variability of wind and solar PV can be deployed to provide fre-                           rate of change of frequency below 2 Hz/s, which is:
quency control and ORs. Thus, it is unclear as to: 1) what the cost of
providing these services will be in future carbon-neutral systems;                         2H df
                                                                                              * ¼  DP                                                                     (1)
2) how these services will be provided; and 3) how their provision                          f  dt
will affect the cost-optimal system composition.
   This study imposes constraints regarding the intra-hourly                               where H is the inertia constant, f is the nominal frequency of the
operational reserve and inertial power capacity on the electricity                         grid, and DP is the change in power output from the generator.
system model described previously [9]. The model minimizes total                               In addition to the technologies shown in Table 1, batteries, fly-
system cost through linear optimization of both investments and                            wheels and wind power are assumed to be able to provide inertial
operation, on an hourly time-scale with a time horizon of 1 year.                          power response (synthetic inertia) and contribute to the total
The combination of one full year and hourly resolution makes the                           system inertia. While batteries and flywheels can contribute as
model suitable for studying the interactions between generation                            much as their capacities allow, wind power is assumed to limit its
technologies and VMS, including strategies for short-term                                  contribution to an additional 13% of the current production, in or-
balancing of generation and load, as well as options for multiday                          der to avoid significant recovery effects [based on the findings of
and seasonal storages. A list of the included VMS and generation                           [21]]. Hydrogen storage systems are assumed to be too slow to
technologies is provided in Table 2. The model, on a technology                            provide power for inertia responses owing to the nonsynchronous
level, includes operational constraints such as ramping, part-load                         nature and the need for mass transportation to function, although
and start-up, all of which have been demonstrated by Ref. [15] to                          they can provide reserve power.
be important when analyzing the requirement for reserve capacity                               For every time-step, the total available inertia response needs to
and the value of energy storages. The model only studies one region                        at least cover the dimensioning fault (N-1). These values are further
at a time, and does not include inter-regional transmission. Thus,                         explained, and listed in Table 6, in the Cases section.
the results are primarily relevant to understanding the interactions
between intra-regional electricity generation technologies and
                                                                                           2.2. Operating reserve
VMS, rather than to suggest appropriate electricity system com-
positions for actual regions or countries.
                                                                                               When there is an imbalance between the electricity load and
   This study aims to investigate how the demands of inertia and
                                                                                           level of generation, some generation (or load) must be added or
OR in various system contexts affect the investments and operation
                                                                                           removed in order to restore equilibrium and prevent the frequency
of generation and storage technologies, as well as the total system
                                                                                           from deviating even further. Traditionally, this reserve generation
cost, through cost-minimizing linear optimization. Special atten-
                                                                                           has been categorized as primary, secondary and tertiary reserves,
tion is paid to synergies between VMS and the provision of ancillary
                                                                                           referring to the order in which they are activated following an
services. In addition, the consequences of not allowing inverter-
                                                                                           imbalance. However, this categorization is based on traditional,
interfaced technologies to provide synthetic inertia are
                                                                                           fuel-based systems and is not necessarily suitable for future sys-
investigated.
                                                                                           tems with high shares of VRE, for which different technical limi-
                                                                                           tations to providing reserve capacity apply. Furthermore, the
2. Methodology
                                                                                           historic reserve levels may also be unsuitable as the share of VRE,
                                                                                           electrified industries and number of prosumers increase. For
   In order to investigate how constraints imposed on inertia and
                                                                                           example, in a high-VRE electricity system, different types of stor-
OR influence the cost-optimal investments and dispatch in various
                                                                                           ages, gas turbines or VRE would be able to provide down-
system contexts, the principles underlying these constraints must
                                                                                           regulation, whereas VRE typically cannot provide up-regulation
be understood. This section focuses on the formulation of these
                                                                                           without constantly curtailing some energy. Therefore, it is
constraints, the optimization model in which they are imple-
                                                                                           assumed that downregulation is significantly easier to handle than
mented, as well as the investigated system cases.
                                                                                           upregulation in high-VRE systems, so only upregulation is studied.
                                                                                               In this study, OR has been implemented as a requirement for
2.1. Inertia
                                                                                           spare capacity within each hour. The hour has been split into 7
                                                                                           intervals, corresponding to 10 se1 min, 1e10 min, 10e20 min and
    While conventionally expressed in terms of GWs or MWs [20],
                                                                                           so on, where the first 10 s instead are covered by the inertia power
the inertia is, in this work, expressed in terms of the power needed
                                                                                           response1 and the FFR described in the previous section. All in-
to cope with a dimensioning fault (N-1). This is to avoid inertia time
                                                                                           tervals are implemented with a uniform need for reserves, which
constants (H) for technologies that provide synthetic inertia, and to
                                                                                           can be met by any dispatchable units, such as hydro power, thermal
facilitate comparisons with the provision of fast frequency reserves
                                                                                           generation, storages, and curtailed VRE. The amount of OR that each
(FFR). While FFRs are not explicitly studied in this work, the syn-
                                                                                           thermal unit can contribute depends on whether the unit is online
thetic inertia is implemented such that it can be considered as an
                                                                                           or offline and on the specific interval being considered. The frac-
                                                                                           tions of rated capacity that can be added are given in Table 2. For
Table 1                                                                                    example, a combined-cycle gas turbine running at part-load can
Assumed inertia constants and resulting power response per technology type for             increase its output to its rated power for intervals 3 to 7, whereas it
synchronous generators. The power response is expressed as the increased output in
the form of a percentage of the rated power of all online units.

              Nuclear        Other thermal   Hydro     Synchronous condensers                1
                                                                                               In practice, the duration of inertial support or FFR may vary. However, the
                                                                                           assumption of 10 s is reasonable from a modeling point-of-view because of the vast
  H [s]       6              4               3         6
                                                                                           capacity for fast frequency control in the investigated scenarios. Further treatment
  DP [%]      48             32              24        48
                                                                                           of this topic can be found in the Discussion section.

                                                                                     250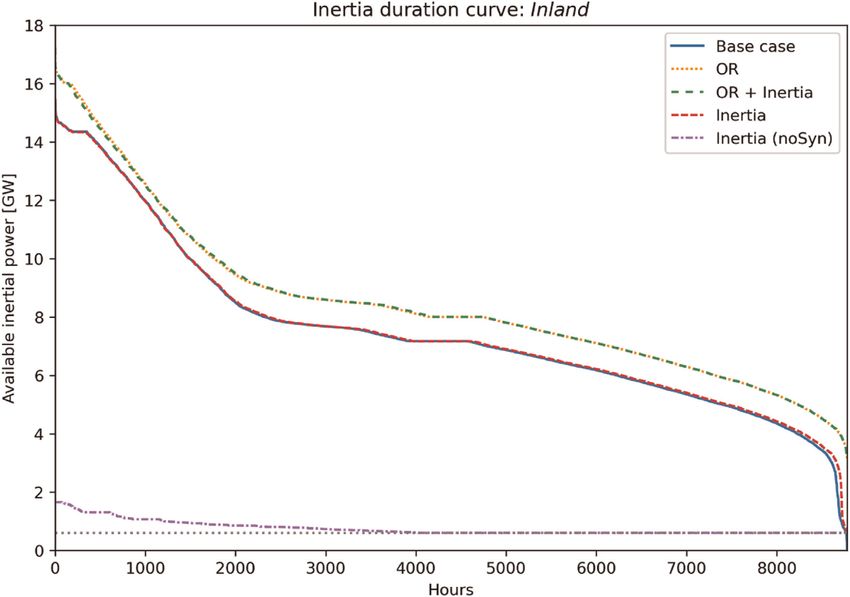
€ransson, P. Chen et al.
J. Ullmark, L. Go Renewable Energy 173 (2021) 249e262
is limited to an increase corresponding to 60% of its rated power for technology (P), and the main decision variables are production and
the second interval (O2dur). Offline combined-cycle gas turbines storage technology investments (i) and power generation (g).
can at most reach 67% of their rated power within the hour. The Additional variables include total system cost (ctot) and hourly
ramp rates and start-up times are based on information from storage level (l), charging (c), and discharging (d). Furthermore, the
Refs. [22,23]; and can be found in Table A2 in Appendix A. model includes a linearized and continuous variable approximation
Furthermore, it is assumed that nuclear power in Year 2050 will be to represent thermal cycling with variables for online capacity
state-of-the-art in terms of ramping ability due to the system (gactive) and capacity being started up (gstart), as described by
context in which it will be. Refs. [24,25]. This means that generators can be run at part-load
The levels of required reserves are calculated as the sum of three and can be subject to start-up costs and time. Equation (2) ex-
sources: the dimensioning fault (N-1), and load variations and presses the total system cost that is being minimized in the model.
variations from VRE on an intra-hourly scale. The first two pa-
0 1
X X X X X
min @ ir;p *Cpinv þ gr;t;p *CpOPEX þ active
gr;t;p
partload
gr;t;p *Cp þ start
gr;t;p *Cpstart A (2)
r2R p2P t;p2T;P\P ESS t;p 2 T;P t;p 2 T;P
rameters are exogenously given to the model,2 although the vari- As shown in Eq. (3), the net electricity generation, considering
ations derived from VRE will increase as VRE investments increase. storage charging and discharging, has to meet an exogenous de-
The N-1 size is assumed to be constant throughout the year, while mand, Dr, at each time-step. However, the generation is limited, for
the reserve demand from load variations vary each day and the each technology, by the online capacity (gr,ctive), which in turn is
demand from VRE variations varies each hour. The reserve demand limited by the installed capacity in Eq. (4). The right-hand-side of
associated with VRE variations is taken as the difference in the Eq. (4) also contains the generation profile (Gr), which limits the
production profile for each consecutive hour. In other words, it is hourly production for VRE technologies. For all non-thermal tech-
assumed that intra-hourly forecast errors and variations are limited nologies, gr, ctive has no meaning and does not influence the
by the inter-hourly variations on a larger regional scale. For operation. The operation of storage is limited by the state-of-charge
balancing the stochastic demand variations, the required reserve according to Eq. (5) and by the investments in power capacity ac-
has been estimated using a heuristic formula and parameters from cording to Eq. (6). In Eq. (6), the p and q terms represent energy
the UCTE Operation Handbook: storage technologies and their respective power capacity in-
qffiffiffiffiffiffiffiffiffiffiffiffiffiffiffiffiffiffiffiffiffiffiffiffiffiffiffiffiffi vestments for charging and discharging.
Ri ¼ a*Li; max þ b2 b
X X discharge charge
gr; t;p þ sr;t;p sr;t;p ¼ Dr;t ; cr; t2R; T (3)
where Ri represents the (secondary) reserves required for day i p2 Pgen p2P ESS
with daily max load Li,max, and the parameters a and b are 10 MW
and 150 MW, respectively. These parameters are given in the
handbook as empirically established values for the recommended active
gr;t;p gr;t;p ir;p *Gt ; ct; p2T; P (4)
minimum levels of secondary reserves.
2.3. Electricity system model discharge
charge sr;t;p
gr;tþ1;p gr;t;p þ sr;t;p *hESS
p ; cr; t; p2R; T; P ESS (5)
hESS
p
The model used in this study is a linear investment and dispatch
electricity system model with time-resolution of 1 h and a time-
span of 1 year. The model minimizes the total cost (annualized
investment and operational costs) to meet the demand for elec- ir;q sdischarge
r;t;p scharge rate
r;t;p ir;q ir;p * Sp ; cr; t; ðp; qÞ2R; T; Q
tricity in one region, under the assumption that transmission (6)
within the region is without congestion (i.e., no inter-regional or
These equations make up the core of the model expanded upon
intra-regional transmission is modeled). Unit commitment has
in this work. A complete description, including all the relevant
been linearly approximated as was done previously [24,25]. A
equations, can be found in Refs. [9,26]. The remainder of this sec-
mathematical formulation of the model can be found in Ref. [9];
tion will detail the additions made to the original model.
with additions regarding the VMS described in Ref. [26]. The pre-
In similarity to production meeting the power demand, the
sent work adds several equations, variables and parameters
inertia power response, asr,nertia, and OR, asr,t,pOR, must also
designed to capture the demand and supply of OR and inertia. This
attain the minimum level required to ensure sufficient frequency
section includes a basic mathematical description of the model,
control, as described by Eqs. (7) and (8). In the equations listed
followed by the additions made in this work. All the sets, variables
below, Ir, ad refers to the intra-load variations described in the
and parameters used in the description of the modeling can be
Operating Reserves section, and IrN1 refers to the N-1 values in
found in Table 3.
Table 6.
The main sets in the model are region (R), time (T) and
X
asinertia N1
r;t;p Ir ; cr; t2R; T (7)
2
For example, N-1 and load variations result in 520e730 MW of reserve demand p2P
in the Wind case with an average load of 3.3 GW, and 1552e1678 MW of reserve
demand in the Hydro þ wind case with an average load of 10.5 GW.
251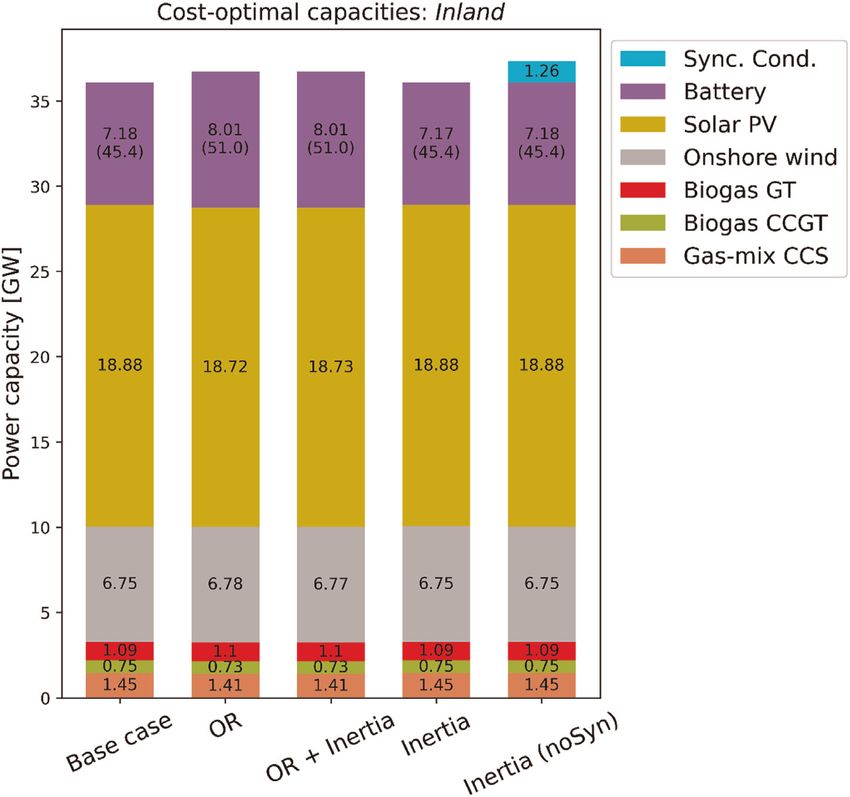
€ransson, P. Chen et al.
J. Ullmark, L. Go Renewable Energy 173 (2021) 249e262
Table 2
Fractions of rated capacity that can be ramped up for each intra-hourly reserve interval, Odur
o [as used in Eq. (12)].
Odur
1 Odur
2 Odur
3 Odur
4 Odur
5 Odur
6 Odur
7
10e60 s 1e10 min 10e20 min 20e30 min 30e40 min 40e50 min 50e60 min
Energy storages
Li-ion battery 1 1 1 1 1 1 1
Hydrogen 1 1 1 1 1 1 1
Flywheels 1 1 1 1 1 1 1
Hydro power 1 1 1 1 1 1 1
Online thermal plants
CC GT 0.06 0.6 1 1 1 1 1
OC GT 0.125 1 1 1 1 1 1
ST 0.045 0.45 0.9 1 1 1 1
Nuclear 0.045 0.45 0.9 1 1 1 1
GT CCS 0.08 0.8 1 1 1 1 1
ST CCS 0.06 0.6 1 1 1 1 1
Offline thermal plants
CC GT 0 0.21 0.67 0.67 0.67 0.67 0.67
OC GT 0 0.31 1 1 1 1 1
ST 0 0 0 0 0 0 0
Nuclear 0 0 0 0 0 0 0
GT CCS 0 0 0 0 0 0 0
ST CCS 0 0 0 0 0 0 0
CC: Combined-cycle, OC: open cycle, GT: gas turbine, ST: steam turbine, CCS: carbon capture and storage.
Table 3
X X
Sets, variables and parameters used in the equations describing the modeling. asOR load N1
r;o;t;p Ir;t þ Ir þ ir;p * max
Sets p2P p2P VRE
R Regions, {1,..,4} Gr;t;p Gr;t1;p ; Gr;tþ1;p Gr;t;p ; cr; o; t2R; O; T (8)
T Time-step, {1,..,8784}
P Technology In Eq. (8), ir,*maxGr,t,pGr,t1,p, Gr,tþ1,pGr,t,p represents the
P VRE Variable renewable technologies (wind and solar) hour-to-hour variations of VRE, i.e., the extent to which the pro-
P inertia Technologies able to provide inertia duction may be ramped up/down during the time-step. The vari-
P OR Technologies able to provide operating reserves able for spinning capacity, gr,ctive, is further constrained to
P ESS Energy storage technologies
approximate the start-up cost, start-up time, minimum load and
P gen Electricity generating technologies
part-load operation using continuous variables [the complete
O Operating reserve interval {1,..,6}
Variables thermal cycling approximation can be found in Ref. [9]]. Addi-
ir;p Investment in technology p in region r [GW] tionally, gr,t, pactive also determines how much inertia power
gr;t;p Generation from technology p at time-step t in region r [GWh/ response, asr,t,pinertia, and OR, asr,t,pOR, is available for synchro-
h] nous technologies according to Eqs. (9) and (10).
charge
sr;t;p Charging of storage p in region r at time-step t [GWh/
h]
active sync
discharge
sr;t;p Discharging of storage p in region r at time-step t [GWh/ asinertia
r;t;p gr;t;p *Ip ; cr; t; p2R; T; P inertia (9)
h]
asinertia
r;t;p
Available inertial power [GW]
asOR
r;t;p;o
Available operating reserves [GW] asOR active on
r;t;p;o gr;t;p gr;t;p *Or;p;o
Parameters
hESS
p
Charging and discharging efficiency of technology p []
active
þ ir;p gr;t;p *Ooff
r;p;o ; cr; t; p; o2R; T; P
OR
(10)
Dr;t Electricity demand during hour t in region r [GWh]
Gt;p Hourly profile for VRE (constant 1 for dispatchable [] The batteries and flywheels are also able to provide synthetic
technologies) inertia (depending on the scenario) and reserves. The two factors
Cpinv Investment cost for technology p [kV/ that limit the ability of storage systems to provide inertia and
GW]
CpOPEX Running cost (fuel and variable O&M) for technology p [kV/
GWh]
Table 4
Cpstart Start-up cost for technology p [kV/
The scenarios (excluding sensitivity analyses) and cases used as input to the
GW]
modeling. Modeled cases are based on real regions in terms of load profiles and
Cppart Part-load cost [kV/
access to renewable resources.
GW]
load
Ir;t Power reserve demand due to intra-hourly load variations [GW] Description
IrN1 Power reserve demand to cover for worst single fault (N-1) [GW]
Scenario
I dur Duration of inertia power response (10 s) [s]
Base Core model without inertia or OR constraints
Ipsync Inertial power response from synchronous generators (see []
Table 1) OR Hourly ORs need to meet the sum of demands
Oon Ability of technology p to increase output until reserve [] Inertia Hourly inertia must meet the static value
p;o
interval o Inertia (noSyn) Same as Inertia but without nonsynchronous sources
off Ability of technology p to start up until reserve interval o [] OR þ Inertia Combined OR and inertia constraints
Op;o
Regional case
Odur
o
Duration of reserve window o [s] Hydro þ wind Based on southern Sweden
Q P P matrix connecting energy storages with their respective [] Wind Based on Ireland
power capacity technology (e.g., fuel cells, inverters) Solar Based on central Spain
Srate
p
Storage (dis)charge rate as a fraction of storage per hour [] Inland Based on Hungary
252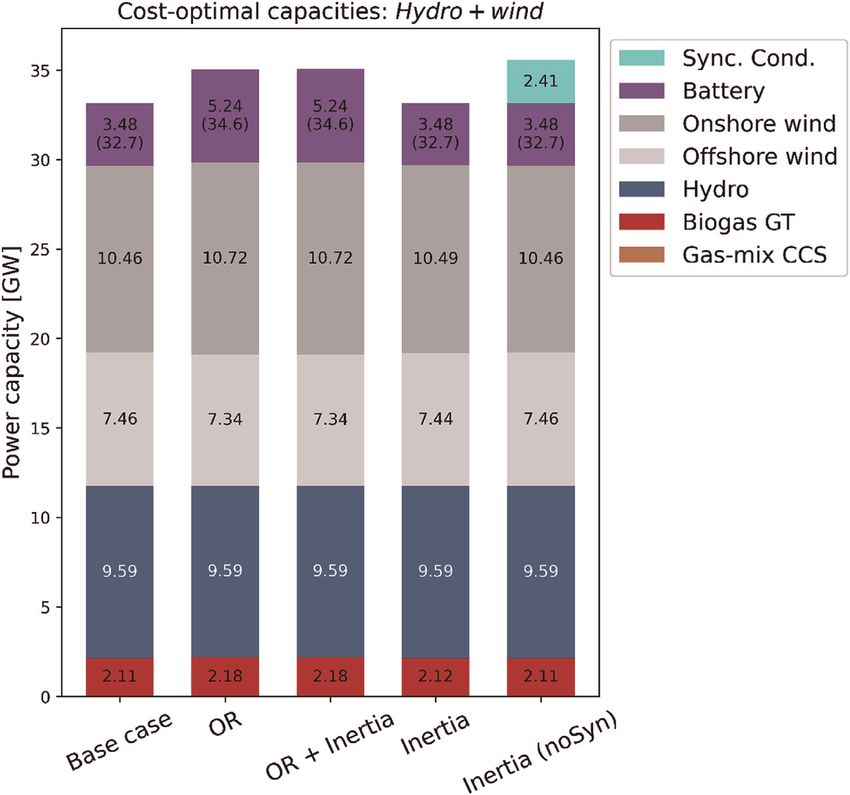
€ransson, P. Chen et al.
J. Ullmark, L. Go Renewable Energy 173 (2021) 249e262
Table 5
Storage and inertia technologies included in the modeling, as well as their investment costs and operational limitation. Note that additional operation and maintenance (O&M)
costs apply, and reservoir hydropower cannot be expanded beyond the capacity in Year 2020. The costs for batteries, hydrogen storage, and flywheels are based on [27] while
the synchronous condenser costs are based on [28]. Reservoir hydro power is shown without values, as investment decisions cannot be made for this.
Costs Limitation
Li-ion battery Energy 79 V/kWh 100% (dis)charge per hour
Power 68 V/kW
Hydrogen storage Energy (Cavern storage) 11 V/kWh 5% discharge per hour, 2.5% charge per hour
Charge (Electrolyzer) 395 V/kW
Discharge (Fuel cell) 841 V/kW
Flywheels Energy and power (E/P ¼ 1/6) (OR and inertia only) 155 V/kW 100% (dis)charge per 10 min
Synchronous condensers Power (inertial power only) 30 V/kW Only for synchronous inertia
Reservoir hydro - e e
Table 6 power availability; 2) Wind, which is based on Ireland with very
Dimensioning fault (N-1) values for the regional cases included in this work. high availability of wind power; 3) Solar, which is based on central
Solar Inland Wind Hydro þ wind Spain with high solar availability; and 4) Inland, which is based on
N-1 [MW] 1239 605 440 1388
Hungary with low VRE resources. As indicated above, these regions
are modeled in isolation without the inclusion of any inter-regional
transmission. In the context of studying operational reserve and
inertia, this limitation resembles conditions of extreme self-
reserves are: (i) power capacity, which is determined by the in-
sufficiency, since interconnected countries typically share both
vestment in the storage’s corresponding power technology (i.e.,
reserves and inertia. Using this approach, therefore, gives the upper
inverter and grid connection); and (ii) storage level. Power capacity
limit of the impact of the studied services by not allowing regions to
(i) is considered in Eqs. (11) and (12). The limitation from storage
provide services for each other when possible. However, as long as
level (ii) is implemented according to Eq. (13) for inertia, and ac-
part of the reserves and inertia is required to remain local (e.g., for
cording to Eq. (14) for reserves:
stability or energy security reasons), the technologies and strate-
charge discharge gies used to provide the services will largely be the same.
asinertia
r;t;p sr;t;p þ sr;t;p ir;q
For each regional case, five scenarios (listed in Table 4) are
ir;p *Rdischarge
p ; cr; t; ðp; qÞ2R; T; Q investigated, to distinguish the impacts of OR, inertia and synthetic
inertia. All five scenarios feature a carbon-neutral Greenfield sys-
(11)
tem for Year 2050 with only the present levels of hydropower as
pre-existing generation capacity. Additional scenarios are imple-
charge discharge
asOR
r;t;p;o sr;t;p þ sr;t;p ir;q mented, as described in the Sensitivity Analysis section.
discharge The Base scenario contains no new constraints and is used as the
ir;p *Rp ; cr; t; ðp; qÞ2R; T; Q point of reference for the other scenarios. Scenario OR includes
(12) constraints on available reserves but not on inertia, and the oppo-
site is the case for the Inertia scenario. Instead, the combination of
3600 OR and inertia constraints is implemented in the OR þ Inertia
charge discharge
asinertia
r;t;p gr;t;p þ sr;t;p sr;t;p * dur ; cr; t; p2R; T; P ESS scenario. Lastly, the Inertia (noSyn) scenario is used to test the
I
(13) importance of synthetic inertia by not allowing for nonsynchro-
nous sources. Further details of the OR and inertia constraints can
be found in the following subsections.
X Odur charge
asOR
r;t;p;o *
o
gr;t;p *hESS
t þ sr;t;p Since this study focuses on inertia, ORs and VMS in carbon-
o2O
3600 neutral energy systems, several VMS are available in the model
discharge and are listed in Table 2. In addition, a range of thermal power
sr;t;p ; cr; t; p2R; T; P ESS (14)
technologies is available. A full list of the technologies available in
I dur and Odur the model, including nuclear power, biomass, biogas, and fossil-
o are the lengths of each commitment and add up to
and biogas-mixed carbon capture and storage (CCS) can be found in
3600 s (1 h), such that when inertia and all reserve intervals o are
Table A1, Appendix A.
satisfied, the whole hourly time-step has sufficient power and en-
The N-1 values used to dimension the inertia and OR re-
ergy for frequency control.
quirements were calculated in two steps and are listed in Table 6.
It should be noted that while this implementation of inertia and
Initial values for reasonable largest power plant block sizes were
reserves affects investments and operation such that the system
chosen by looking at the technology mix and sizes in the Base
has extra power to use for frequency management, it does not
case for each region. It was found that the ratio of the largest
activate the extra power. The implications of this and the perfect
plausible power block size to the yearly electricity demand was
foresight of linear optimization models are considered in the Dis-
similar for all regions (in the range of 15e20 MW*yr/TWh) with
cussion section.
the exception of the Hydro þ wind case, for which the ratio was
about one-third (6.5). Since the purpose of this study was to
2.4. Cases investigate the impact of inertia constraints in systems with
different technology mixes, rather than systems of different sizes,
The modeling is applied to four cases, corresponding to four the N-1 value was adjusted to give the same ratio (15 MW*yr/
regions with distinctly different modes of access to renewable re- TWh) for each region investigated. For Hydro þ wind, this
sources and different load profiles: 1) Hydro þ wind, which is based adjusted N-1 value is similar to the currently N-1 dimensioning
on southern Sweden with high levels of hydropower and wind nuclear reactor in Sweden.
253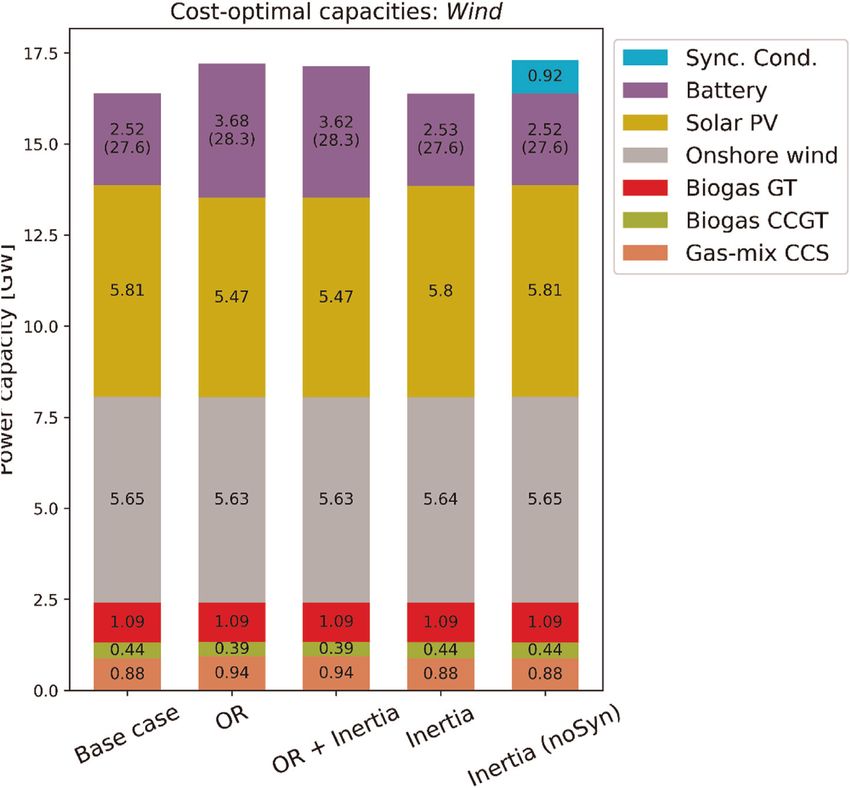
€ransson, P. Chen et al.
J. Ullmark, L. Go                                                                                                                          Renewable Energy 173 (2021) 249e262

3. Results                                                                                   that inertia constraints alone have little impact on the system when
                                                                                             synthetic inertia is allowed. The VRE share is separated into solar
    Figs. 1 and 2 show the installed electricity generation, storage                         share and wind share, to show how the OR requirement causes a
and synchronous condenser capacities for the five scenarios                                   slight shift from solar to wind. The reason for this is that the reserve
investigated for the Inland and Wind cases, respectively (corre-                             requirement is formulated so as to depend on hour-to-hour varia-
sponding results for the Solar and Hydro þ wind cases are presented                          tions in VRE production. Thus, the required level of reserve can be
in Appendix B). From the figures, it is evident that the installed                            decreased by shifting investments away from solar PV, which is
capacity is very similar for all the scenarios, indicating that the                          particularly variable.
requirements related to capacity available for inertia and ORs have                              In general, an increase in battery storage capacity is the main
weak impacts on the cost-optimal technology mix for electricity                              change in investments in all regions when OR constraints are
generation and storage. The most notable effect in terms of                                  introduced. While small changes in dispatch can be seen for some
installed capacity is seen for the scenarios with reserve re-                                hours in the Hydro þ wind region, the main source of reserves is
quirements, for which more investments are made in battery                                   from having additional energy in the batteries during hours of
storage and power.                                                                           otherwise low storage levels. The curtailment is also slightly reduced
    A slight decrease in solar PV capacity is also found in the Wind                         in the OR scenarios for all regions, since the increased storage ca-
region, due to the increased OR demand from ramping solar PV. The                            pacity allows for more excess electricity to be absorbed (except in
effect of requiring capacity available for the inertia power response                        the Hydro þ wind case, which has a large share of dispatchable
is even weaker than the impact of requiring capacity for ORs. This                           generation and a lot of flexibility from reservoir hydropower). This
because a higher capacity is required for OR and the already                                 advantage of double-use of the additional batteries is evident, in
installed battery and wind power capacities can provide sufficient                            part, when comparing the investment and O&M costs imposed on
levels of synthetic inertia at no, or low, additional cost in terms of                       the model from the battery investments with the difference in sys-
dispatch. When synthetic inertia is not allowed, synchronous                                 tem cost. If the increase in system cost is smaller than the cost of the
condensers are preferred over thermal options for inertia provision,                         new battery capacity, then there must be additional uses for the
since it would be very costly for thermal plants to remain online for                        additional capacity. On the other hand, if the increase in system cost
a few hours solely to provide inertia.                                                       is larger than the battery cost, then there must be other costs
    Table 7 lists the indicators for all scenarios and regional cases                        imposed from the OR requirements. The differences between these
listed in the Methodology section. It is evident that the synchronous                        two costs are shown for the Base and OR case for all regions in Table 8.
condenser and battery are the main providers of synchronous                                      Table 8 shows that for the Inland and Hydro þ wind cases, there
inertia and reserve, respectively. The small change in cost shows                            is double-usage of the extra batteries, as the system cost increase is

Fig. 1. Cost-optimal installed capacities for all scenarios in the Inland region. Numbers in parentheses for batteries are the storage capacities in GWh. Sync. Cond.: synchronous
condensers.

                                                                                       254
€ransson, P. Chen et al.
J. Ullmark, L. Go                                                                                                                         Renewable Energy 173 (2021) 249e262

Fig. 2. Cost-optimal installed capacities for all scenarios in the Wind region. Numbers in parentheses for batteries are the storage capacities in GWh. Sync. Cond.: synchronous
condensers.

Table 7
Summary of the scenarios according to indicators. The main changes that occur between the base case and each scenario are highlighted in bolded text.

                          Annual system cost     Cost change    Wind share    Solar share   Curtailed energy Synchronous condenser capacity Battery storage/power
                          [GV/yr]                []            []           []           []              [GW]                           [GWh/GW]

  Solar  Base             3.627                  e              29.2%         65.1%         16.9%             0                                 103.68/16.99
         OR               3.685                  1.59%          30.5%         63.8%         16.4%             0                                 112.06/17.52
         OR þ Inertia     3.685                  1.60%          30.7%         63.6%         16.4%             0                                 112.06/17.52
         Inertia          3.629                  0.06%          29.8%         64.6%         16.8%             0                                 104.28/16.94
         Inertia          3.632                  0.16%          31.6%         62.8%         16.7%             2.58                              103.73/17.04
         (noSyn)
  Inland Base             2.116                  e              36.7%         53.5%         15.8%             0                                 45.43/7.18
         OR               2.141                  1.17%          37.4%         52.9%         15.6%             0                                 50.99/8.01
         OR þ Inertia     2.141                  1.17%          37.1%         53.3%         15.6%             0                                 50.99/8.01
         Inertia          2.117                  0.05%          36.7%         53.5%         15.9%             0                                 45.44/7.17
         Inertia          2.119                  0.15%          39.3%         51.0%         15.7%             1.26                              45.43/7.18
         (noSyn)
  Wind Base               1.254                  e              75.7%         16.3%         18.8%             0                                 27.59/2.52
         OR               1.265                  0.84%          76.1%         15.5%         18.2%             0                                 28.28/3.68
         OR þ Inertia     1.265                  0.85%          76.4%         15.2%         18.1%             0                                 28.28/3.62
         Inertia          1.255                  0.04%          76.7%         15.3%         18.7%             0                                 27.58/2.53
         Inertia          1.257                  0.19%          75.9%         16.1%         18.9%             0.92                              27.59/2.52
         (noSyn)
  Hydro Base              2.845                  e              60.7%         0.0%          24.3%             0                                 32.72/3.48
  þwind OR                2.859                  0.51%          60.8%         0.0%          24.5%             0                                 34.62/5.24
         OR þ Inertia     2.860                  0.51%          60.8%         0.0%          24.5%             0                                 34.62/5.24
         Inertia          2.845                  0.01%          60.7%         0.0%          24.3%             0                                 32.67/3.48
         Inertia          2.851                  0.22%          60.7%         0.0%          24.3%             2.41                              32.71/3.48
         (noSyn)

smaller than the costs imposed by the extra battery capacity.                               using batteries. Since much of the reserve demand in the Solar case
However, in the Solar and Wind cases, the higher system cost in-                            comes from ramping solar PV output, imposing OR requirements
dicates that the OR requirement was met in other ways than just                             causes a slight shift from solar PV to wind power (about 2% of the

                                                                                      255
€ransson, P. Chen et al.
J. Ullmark, L. Go Renewable Energy 173 (2021) 249e262
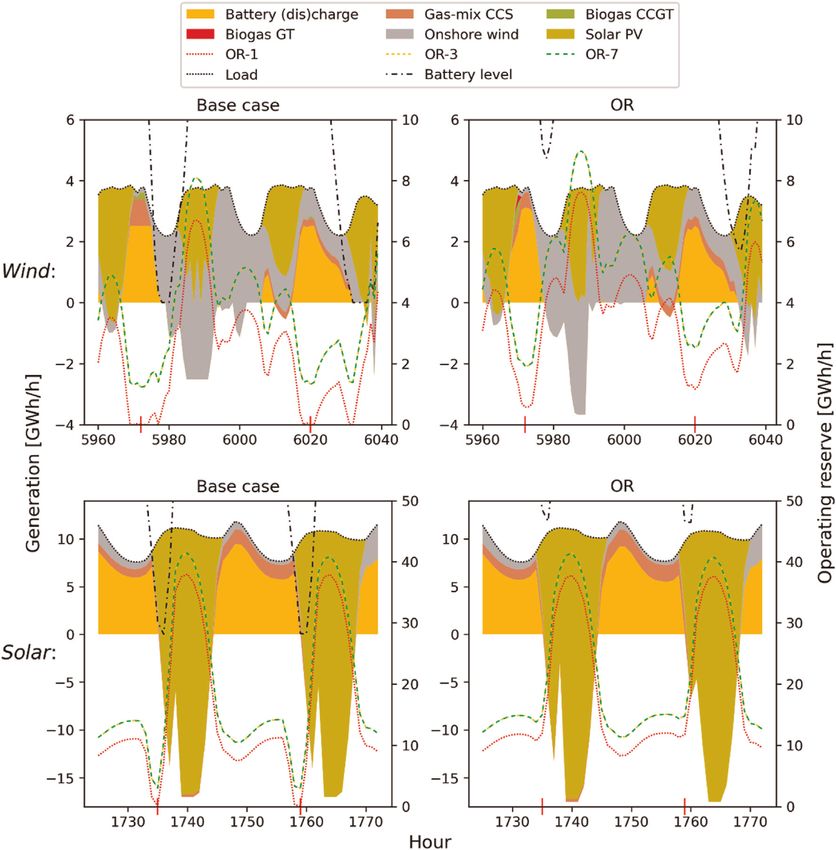
Table 8 Fig. 4 shows the levels of generation, battery (only the useable
Comparisons of the increased system costs and the battery costs for the OR scenarios battery portion), and available reserves for 2 days in the Solar case
in each region.
and 3 days in the Wind case. Comparing the operation and cause of
Solar Inland Wind Hydro þ wind insufficient reserves in the Wind and Solar cases in Fig. 4 highlights
Battery cost [MV/yr] 49.5 35.5 10.1 20.0 an important difference between wind-dominated and solar-
System cost increase [MV/yr] 57.8 24.8 10.5 14.3 dominated systems. In the Solar case, the lack of reserves occurs
System cost increase/Battery cost (%) 117 70 104 72 during hours of empty battery storage as a consequence of dis-
charging during a high net-load event (see Hours 1735 and 1,759,
marked in red on the x-axis in Fig. 4). However, in the Wind case,
there is a lower battery power capacity, as excess wind power is less
yearly energy supply). This moves the system away from the cost- concentrated in time than excess solar power. This lower power
optimal energy mix and reduces the need for batteries as a VMS, capacity causes reserve deficiencies also during high net-load
which explains the greater increase in system cost for the Solar case events when the battery discharge hits the capacity cap. This
in Table 8. While this shift is also observed for the Wind and Inland behavior can be seen during Hours 5972 and 6020 for the Wind case
cases, the poor wind and solar conditions of the Inland region lead (marked in red on the x-axis). However, also in the Wind case, oc-
to a greater benefit being derived from the extra batteries. casions with insufficient reserves due to empty batteries occur, as
Fig. 3 gives the available inertial power of the Inland electricity shown during Hour 6035.
system for all hours of the year ordered from the hour with the Similar to the OR shown in Fig. 4, the inertia in Fig. 5 is not
highest available inertial power to the hour with the lowest avail- increased by a change in dispatch but rather by investments in
able inertial power. Comparison of the Base and OR scenarios in batteries (as shown in Table 7). At Hour 6368 (indicated in red on
Fig. 3 reveals that adding OR constraints significantly increases the x-axis), the only difference between the Base and Inertia sce-
inertia for all hours of the year. This is because the batteries added narios is that the increased battery storage capacity in Inertia allows
for OR provision can also provide synthetic inertia. Thus, adding the battery to still have about 1 GWh left at the end of the nightly
inertia requirements to already existing OR requirements has discharge cycle. It should be noted that changes in dispatch can be
almost no effect. It can also be seen in Fig. 3 that when synthetic found, for example in the Solar case where thermals at one point
inertia is not allowed, almost all the inertia is instead supplied by replace battery discharge to allow the batteries to provide fast re-
investments in synchronous condensers. serves instead. In the Hydro þ wind region, where both hydro
Fig. 3. Duration curves showing the available inertia in the Base, OR, Inertia and Inertia (NoSyn) scenarios for the Inland region. The dotted line indicate the inertia requirements,
when applicable (605 MW).
256€ransson, P. Chen et al.
J. Ullmark, L. Go Renewable Energy 173 (2021) 249e262
Fig. 4. Generation level, battery level (only useable battery portion) and available reserves for 2 days in the Solar case and 3 days in the Wind case. Note that a level of generation
below zero means that the batteries are being charged, and the state-of-charge continues above the border of the graph but has been cut off in the image.
reservoirs and batteries are present, there are also hours during Wind, Solar, and Inland cases, where their absence leads to exten-
which the hydropower is discharging instead of batteries to in- sive replacement by synchronous condensers. In the Hydro þ wind
crease inertia. Note that the large differences in timing for battery case, inertia from wind power plays a greater role than batteries,
charging in Fig. 5 [compare, for example, Hour 6420 for Inertia and although the absence of either leads to replacement by synchro-
Inertia (NoSyn)] are caused by the excess curtailment enabling nous condensers.
several same-cost solutions. Increasing battery investment costs affects the results by shift-
ing all the solutions away from batteries and VRE, towards thermal
generation of electricity. However, an increased battery cost has
3.1. Sensitivity analysis
little effect on the impacts of adding inertia and OR constraints.
When adding OR constraints, a higher battery cost slightly increases
The results presented here are not sensitive to the synchronous
the additional battery investments, as there is a lower pre-existing
condenser cost, as a halving or tripling of the investment cost has
battery capacity to use for OR. For inertia, an increase in battery cost
no impact on the investments. In terms of providing synthetic
yields no change, except for a slight increase in the use of syn-
inertia, it is found, by disabling inertia from either batteries or wind
chronous condensers in the Solar case.
power (one at a time), that batteries are especially important in the
257€ransson, P. Chen et al.
J. Ullmark, L. Go Renewable Energy 173 (2021) 249e262
Fig. 5. Generation level, battery level and available inertia for 1 week the Solar case. Note that a level of generation below zero means that the batteries are being charged, and some
lines continue above the border of the graph but have been cut off in the image.
4. Discussion longer high net-load periods. These factors could mitigate any po-
tential energy deficits. However, before drawing generalized con-
Since the model used in the present study has an hourly reso- clusions about frequency control in future high-VRE systems, the
lution and the inertia and OR constraints are implemented as a operability and extent of potential energy deficits in the system
requirement on the availability of inertia and reserves, the batteries compositions obtained in this study should be further tested in
need to be available but are not actually discharged for the sake of separate dispatch and frequency simulation studies.
OR/inertia. This might lead to an energy deficit, although the bat- Comparing the Base, Inertia and Inertia (NoSyn) scenarios in
teries are also not charged during intra-hourly periods of excess Table 7 suggests that providing inertial power, even for high esti-
generation. It is assumed that the combined effect of not charging mates of N-1 values, may be carried out at virtually no additional
and not discharging is close to zero on the scale of several hours, cost to the system. Furthermore, if a system operator instead wants
whereas the fastest storage cycles in the results are once per day (in to maintain a fleet of synchronous inertia, the cost is in the single
the Solar case). Furthermore, the high-VRE containing systems digits of MV per year (3, 3, 5 and 6 MV/yr for the Wind, Inland, Solar
investigated in this study are all characterized by high levels of and Hydro þ Wind cases, respectively). When borne by the con-
curtailment and the online presence of thermal plants during sumers, this cost corresponds to approximately 0.1 V/MWh or
258€ransson, P. Chen et al.
J. Ullmark, L. Go Renewable Energy 173 (2021) 249e262
about 0.15%e0.2% of the average marginal cost of electricity. Clearly, wind-dominated systems and battery storage capacity in solar PV-
inertia costs will not have a significant impact on the design of a dominated systems. Furthermore, the capacity to provide inertia
future renewable electricity system. during all hours of the year is found to already exist (mostly in the
Unlike inertia, OR requirements significantly affect the battery form of synthetic inertia) from energy-purpose optimization. If
investments, especially in the Hydro þ wind and Wind regions, synchronous inertia is mandated, all the investigated regional cases
where the battery power capacity was increased by 45%e50%. will invest in synchronous condensers with virtually no other
While this suggests that excluding reserve requirements in elec- change to the system. This suggests that requirements for inertia in
tricity system models will lead to an underestimation of the value electricity system modeling are unnecessary, unless explicitly
of batteries, the system cost impact is still low (1%e1.5%), and the studied.
total VRE share is very similar in the OR and Base scenarios. To conclude, batteries combined with wind power are cost-
The results of this work point to OR constraints being more efficient ways to provide reserves and inertia in future, high-VRE
influential than inertia when modeling high-VRE electricity sys- energy systems.
tems. While it can be argued that an inertia constraint with a 10-s
timeframe is too long, this would only be true if the inertial CRediT authorship contribution statement
response was primarily supplied by synchronous machines. The
Inertia scenarios show that all the studied regions have battery Jonathan Ullmark: Conceptualization, Methodology, Formal
capacities that can be made available for FFR. Thus, complementing analysis, Data curation, Writing e original draft, Visualization. Lisa
the inertial response from synchronous machines with FFR can be Go€ ransson: Conceptualization, Methodology, Writing e review &
done at little to no additional cost to the investigated systems. Still, editing, Supervision. Peiyuan Chen: Conceptualization, Writing e
this raises the questions as to how and when to transition from review & editing. Massimo Bongiorno: Conceptualization, Writing
thermal plant-based OR, which cannot be answered with the e review & editing. Filip Johnsson: Conceptualization, Writing e
Greenfield model used in this study. Thus, it will be important to review & editing, Supervision, Funding acquisition.
investigate this in future studies of the timing and dynamics of this
transition on a broader energy-system scale. It is also important to
Declaration of competing interest
note that specific grid codes or markets may be necessary to ensure
that battery owners contribute with their potential inertial power
The authors declare that they have no known competing
and reserve capacity.
financial interests or personal relationships that could have
appeared to influence the work reported in this paper.
5. Conclusion
Using a combined investment and dispatch model with hourly Acknowledgment
time-resolution, we show that the requirements for inertial power
and ORs have weak impacts on the optimization objective (0.5%e Funding for this project was provided by the Swedish Energy
1.6% change in total system cost), as well as the resulting compo- Agency (grant no. 44986-1).
sition and dispatch. Furthermore, to satisfy the inertia and OR
constraints in energy system optimization models, investments are Appendix A
shown to play a significantly greater role than changes in dispatch.
While this suggests that dispatch-only models are insufficient to Table A1 lists the economic and technical data used in the
capture reserve services on their own, this is only true in the cost- model. The wind and solar PV, as well as the hydrogen and battery
optimal sense and in scenarios with high levels of VRE, curtailment storage system data are based on [29]; while the thermal and nu-
and batteries. However, the investments are largely confined to clear plant data are based on [30].
batteries and are specifically focused on battery power capacity in
Table A1
Techno-economic data for the electricity generation plants included in this study.
Investment cost [V/kW] Fixed O&M [kV/kW] Variable O&M [kV/kWh] Lifespan [yr] Efficiency [%] Min. load [%] Start-up cost [kV/GW]
Nuclear 4124 154 0 60 33 70 400
Biomass ST 2049 54 2.1 40 36 30 57
Gas-mix CCS 1626 40 2.1 30 55 30 57
Biogas CCGT 932 13 0.8 30 62 30 43
Biogas GT 466 8 0.7 30 42 30 20
Offshore wind 1788 36 1.1 30 e 0 0
Onshore wind 968 13 1.1 30 e 0 0
Solar PV 418 7 1.1 40 e 0 0
O&M: Operations and maintenance, CCGT: combined-cycle gas turbine, GT: gas turbine, ST: steam turbine, CCS: carbon capture and storage.
The ramping and start-up characteristics of the thermal plants, used to construct Table 2 in the Operating Reserve section, are listed in Table A2 below.
259€ransson, P. Chen et al.
J. Ullmark, L. Go Renewable Energy 173 (2021) 249e262
Table A2
Technical data from Refs. [22,23] used to construct Table 5. The biomass-fired steam turbine (ST) is assumed to share flexibility char-
acteristics with the lignite-fired and hard coal-fired power plants.
Start-up time [min] Ramping rate [%/min] Min. load [%]
Nuclear 1440 4.5 70
Biomass ST 360 4.5 30
Gas-mix CCS 180 8 30
Biogas CCGT 180a 6 30
Biogas GT 7.5 12.5 30
CCGT: combined-cycle gas turbine, GT: gas turbine, ST: steam turbine, CCS: carbon capture and storage.
a
It is assumed that the gas turbine can, if so required, start up without the combined cycle to provide reserves.
Appendix B
Figures B1 and B2 show the installed capacities for
Hydro þ wind and Solar, similar to Figs. 1 and 2 in the Results
section.
Fig. B1. Cost-optimal installed capacities for all scenarios in the Hydro þ wind case. The numbers in parentheses for batteries represent the storage capacities in GWh. Sync. Cond.:
synchronous condensers.
260€ransson, P. Chen et al.
J. Ullmark, L. Go Renewable Energy 173 (2021) 249e262
Fig. B2. Cost-optimal installed capacities for all scenarios in the Solar case. The numbers in parentheses for batteries represent the storage capacities in GWh. Sync. Cond.: syn-
chronous condensers.
References considering endogenous technology cost learning, Appl. Energy 204 (2017)
831e845, https://doi.org/10.1016/J.APENERGY.2017.07.075.
€ransson, F. Johnsson, A comparison of variation management strategies [12] R. Loulou, G. Goldstein, K. Noble, Documentation for the MARKAL family of
[1] L. Go
models. http://www.etsap.org/tools.htm, 2004. (Accessed 26 November
for wind power integration in different electricity system contexts, Wind
2020).
Energy 21 (10) (2018) 837e854, https://doi.org/10.1002/we.2198.
€, J. Kiviluoma, H. Holttinen, et al., Including Operational Aspects in [13] M. Odenberger, T. Unger, F. Johnsson, Pathways for the North European
[2] N. Helisto
electricity supply, Energy Pol. 37 (5) (2009) 1660e1677, https://doi.org/
the Planning of Power Systems with Large Amounts of Variable Generation: A
10.1016/j.enpol.2008.12.029.
Review of Modeling Approaches, Wiley Interdisciplinary Reviews: Energy and
[14] F. Wiese, et al., Balmorel open source energy system model, Energy Strategy
Environment. Wiley, 2019, p. e341, https://doi.org/10.1002/wene.341.
Reviews 20 (2018) 26e34, https://doi.org/10.1016/j.esr.2018.01.003.
[3] A.S. Ahmadyar, et al., A framework for assessing renewable integration limits
[15] A. van Stiphout, et al., Quantifying the importance of power system operation
with respect to frequency performance, IEEE Trans. Power Syst. 33 (4) (2018)
constraints in power system planning models: a case study for electricity
4444e4453, https://doi.org/10.1109/TPWRS.2017.2773091.
storage, Journal of Energy Storage 13 (2017) 344e358, https://doi.org/
[4] M. Hadjikypris, V. Efthymiou, G.E. Georghiou, Enhanced frequency response of
10.1016/j.est.2017.07.003.
inverter dominated low inertia power systems, in: 2019 1st International
[16] A. van Stiphout, K. De Vos, G. Deconinck, The impact of operating reserves on
Conference on Energy Transition in the Mediterranean Area (SyNERGY MED),
investment planning of renewable power systems, IEEE Trans. Power Syst. 32
IEEE, 2019, pp. 1e6, https://doi.org/10.1109/SyNERGY-MED.2019.8764134.
(1) (2017) 378e388, https://doi.org/10.1109/TPWRS.2016.2565058.
[5] E. Lidstrom, D. Wall, Frequency support by synthetic inertia from variable
[17] S.C. Johnson, et al., Evaluating rotational inertia as a component of grid reli-
speed wind turbines, in: CIRED Workshop 2016, Institution of Engineering
ability with high penetrations of variable renewable energy, Energy 180
and Technology, 2016, https://doi.org/10.1049/cp.2016.0676, 76 (4 .)-76 (4 .).
(2019) 258e271, https://doi.org/10.1016/J.ENERGY.2019.04.216.
[6] F. Teng, G. Strbac, Assessment of the role and value of frequency response
[18] C.F. Heuberger, I. Staffell, et al., A systems approach to quantifying the value of
support from wind plants, IEEE Transactions on Sustainable Energy 7 (2)
power generation and energy storage technologies in future electricity net-
(2016) 586e595, https://doi.org/10.1109/TSTE.2015.2505085.
works, Comput. Chem. Eng. 107 (2017) 247e256, https://doi.org/10.1016/
[7] H. Thiesen, C. Jauch, A. Gloe, Design of a system substituting today’s inherent
J.COMPCHEMENG.2017.05.012.
inertia in the European continental synchronous area, Energies 9 (8) (2016)
[19] C.F. Heuberger, Electricity System Modelling for Optimal Planning and Tech-
582, https://doi.org/10.3390/en9080582.
nology Valuation, Imperial College, London, 2018. https://spiral.imperial.ac.
[8] M. Yu, et al., Use of an inertia-less Virtual Synchronous Machine within future
uk/handle/10044/1/60646. (Accessed 5 August 2019).
power networks with high penetrations of converters, in: 2016 Power Sys-
[20] E. Ørum, et al., Future system inertia. Brussels. https://eepublicdownloads.
tems Computation Conference (PSCC), IEEE, 2016, pp. 1e7, https://doi.org/
entsoe.eu/clean-documents/Publications/SOC/Nordic/Nordic_report_Future_
10.1109/PSCC.2016.7540926.
€ransson, et al., Impact of thermal plant cycling on the cost-optimal System_Inertia.pdf, 2017. (Accessed 27 November 2020).
[9] L. Go
[21] P. Imgart, P. Chen, Evaluation of the system-aggregated potentials of inertial
composition of a regional electricity generation system, Appl. Energy 197
support capabilities from wind turbines, in: Proceedings of 2019 IEEE PES
(2017) 230e240, https://doi.org/10.1016/J.APENERGY.2017.04.018.
€, J. Kiviluoma, J. Ika
€heimo, et al., ‘Backbonedan adaptable energy Innovative Smart Grid Technologies Europe, ISGT-Europe 2019, Institute of
[10] N. Helisto
Electrical and Electronics Engineers Inc, 2019, https://doi.org/10.1109/
systems modelling framework’, Energies 12 (17) (2019) 3388, https://doi.org/
ISGTEurope.2019.8905488.
10.3390/en12173388.
[22] Agora Energiewende, Flexibility in thermal power plants - with a focus on
[11] C.F. Heuberger, E.S. Rubin, et al., Power capacity expansion planning
261€ransson, P. Chen et al.
J. Ullmark, L. Go Renewable Energy 173 (2021) 249e262
existing coal-fired power plants. https://www.agora-energiewende.de/ 32 (2020) 10e22, https://doi.org/10.1016/j.ref.2019.10.003.
fileadmin2/Projekte/2017/Flexibility_in_thermal_plants/115_flexibility- [27] Danish Energy Agency and Energinet, Technology data - energy storage.
report-WEB.pdf, 2017. (Accessed 26 November 2020). https://ens.dk/sites/ens.dk/files/Analyser/technology_data_catalogue_for_
[23] € der, et al., Current and prospective costs of electricity generation until
A. Schro energy_storage.pdf, 2018. (Accessed 26 November 2020).
2050. https://ideas.repec.org/p/diw/diwddc/dd68.html, 2013. (Accessed 26 [28] F.O. Igbinovia, et al., Cost implication and reactive power generating potential
November 2020). of the synchronous condenser, in: Proceedings of the 2nd International
[24] B. Hua, R. Baldick, J. Wang, Representing operational flexibility in generation Conference on Intelligent Green Building and Smart Grid, IGBSG 2016, Insti-
expansion planning through convex relaxation of unit commitment, IEEE tute of Electrical and Electronics Engineers Inc, 2016, https://doi.org/10.1109/
Trans. Power Syst. 33 (2) (2018) 2272e2281, https://doi.org/10.1109/ IGBSG.2016.7539450.
TPWRS.2017.2735026. [29] Danish Energy Agency and Energinet, Technology data - generation of elec-
[25] C. Weber, Uncertainty in the Electric Power Industry, Springer New York tricity and district heating. https://ens.dk/sites/ens.dk/files/Statistik/
(International Series in Operations Research & Management Science, New technology_data_catalogue_for_el_and_dh_-_0009.pdf, 2017. (Accessed 20
York, NY, 2005, https://doi.org/10.1007/b100484. October 2017).
[26] V. Johansson, L. Go € ransson, Impacts of variation management on cost-optimal [30] International Energy Agency, World Energy Outlook 2016, 2016 (Paris,
investments in wind power and solar photovoltaics, Renewable Energy Focus France).
262You can also read