Increasing the Oil and Gas Setback Requirement to 2,500-feet in Colorado - The Economic and Fiscal Impacts of 2018 Proposition 112
←
→
Page content transcription
If your browser does not render page correctly, please read the page content below
Increasing the Oil and Gas
        Setback Requirement to
         2,500-feet in Colorado
     The Economic and Fiscal Impacts
          of 2018 Proposition 112

                                                 AUTHORS
                                 CHRIS BROWN / ZHAO CHANG

                                    J U LY 2 0 1 8 / C O N D U C T E D B Y

    JULY 2018
1   THE ECONOMIC AND FISCAL IMPACTS OF 2018 PROPOSITION 112
ABOUT THE REMI PARTNERSHIP
    A partnership of public and private organizations announced in July 2013 the formation
    of a collaboration to provide Colorado lawmakers, policy makers, business leaders,
    and citizens, with greater insight into the economic impact of public policy decisions
    that face the state and surrounding regions. The parties involved include the Colorado
    Association of REALTORS®, the Colorado Bankers Association, Colorado Concern,
    Common Sense Policy Roundtable and Denver South Economic Development Partnership.
    This consortium meets monthly to discuss pressing economic issues impacting the state
    and to prioritize and manage its independent research efforts.

                                            SPECIAL THANKS
    Special thanks to Dr. Ian Lange and Dr. Braeton Smith, with the Colorado School of Mines,
    Mineral and Energy Economics Program, for their work to review the economic impact
    methodology and findings portions of the report. Their insights and feedback were
    incredibly valuable in ensuring the study appropriately estimated the economic impacts
    of this critical issue.

    JULY 2018
2   THE ECONOMIC AND FISCAL IMPACTS OF 2018 PROPOSITION 112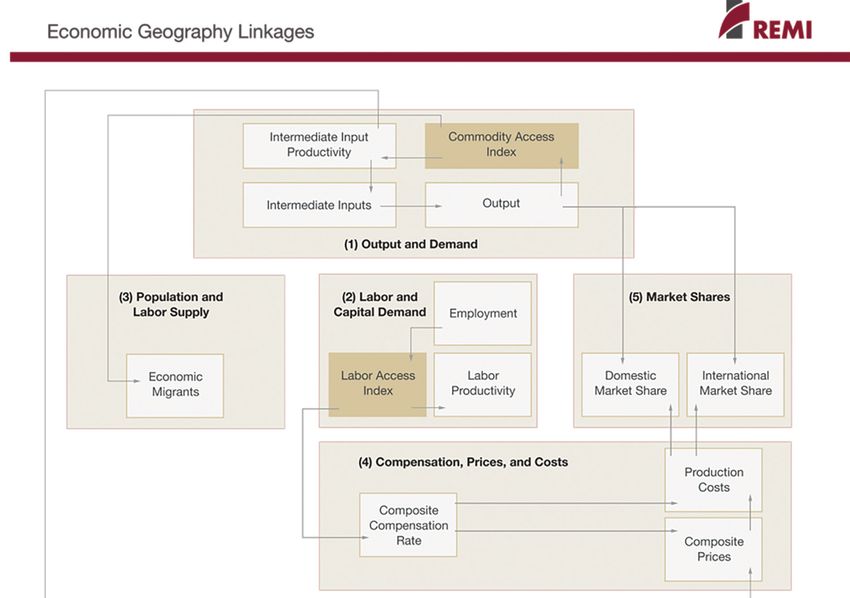
CONTENTS
    Abstract                                                   4
    Overview                                                   5
        Introduction                                           5
    Overview and History                                       5
        Current Regulatory Requirements                        6
        Previous Economic Impact Research                      7
    Findings                                                   8
        Methodology                                            8
        Results                                               10
        Direct Impacts                                        10
        Dynamic statewide impacts                             12
    Conclusion                                                14
    Appendix A - Methodology                                  15
        State and Local Tax Revenue Impact                    19
    Appendix B - Model Framework                              20
    References                                                24

    JULY 2018
3   THE ECONOMIC AND FISCAL IMPACTS OF 2018 PROPOSITION 112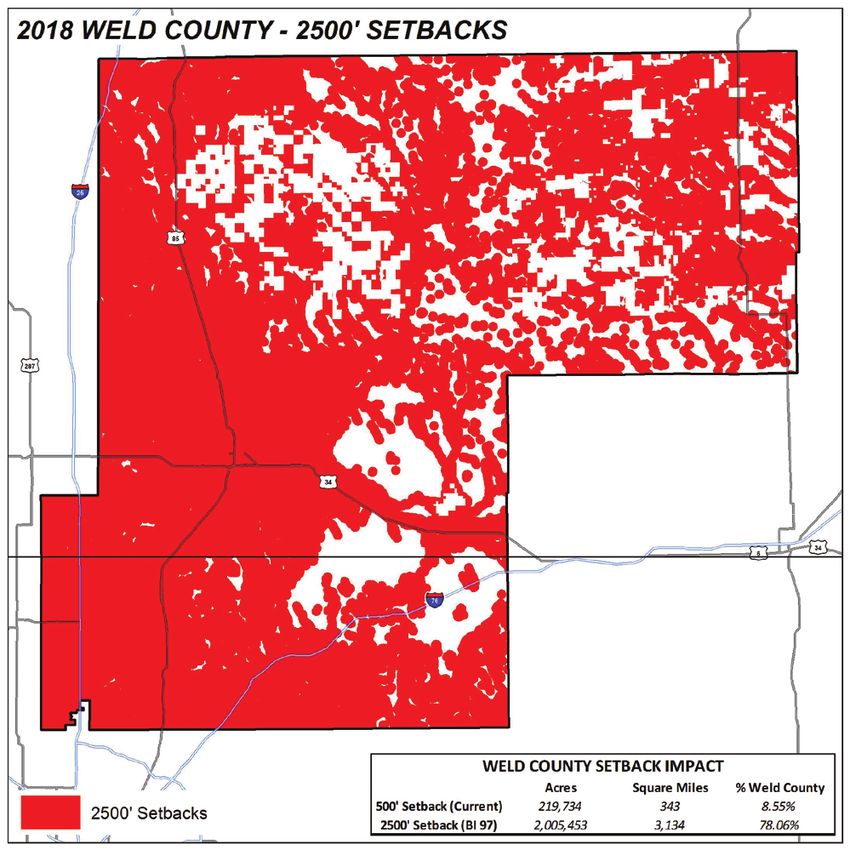
ABSTRACT
     This study evaluates the economic and fiscal impacts of the proposed Ballot Proposition 112 -
     Setback Requirement for Oil and Gas Development. If successful, the initiative would increase the
     setback requirement for new oil and gas activity on non-federal land, from 500-ft to 2,500-ft from
     designated structures and vulnerable areas.
     Mapping of surface land by the Colorado Oil and Gas Conservation Commission (COGCC)
     (Colorado Oil and Gas Conservation Commission, 2018 ) demonstrates that the increase in the
     setback to 2,500-ft would make an estimated 54% of Colorado’s entire land surface off-limits to
     new oil and gas production. However, by mapping this surface restriction to historic data on new
     wells, 89.42% of new oil production and 87.3% of new gas production, has occurred within the
     proposed 2,500-ft increased setback area.
     A projection of future oil and gas production, based on price forecasts and rig counts, shows
     strong continued growth in the oil and gas sector, of which 52.8% is projected to occur within the
     expanded setback area. It is uncertain if the amount of production that would be lost within the
     setback area could occur outside the setback area in the future, therefore this study models two
     scenarios to account for a range of 10% displacement and 30% displacement. These two scenarios
     show that between 17% and 22% of the total projected production in the first year is lost, and by
     2030 the entire production value would be reduced by 54% to 70%, as the loss in annual new
     production is combined with the future year’s lost production based on expected decline curves.
     Between 2019 and 2030, the estimated dollar amount of lost oil and gas production ranges from
     $110 Billion to $141 Billion. (Fixed 2018$)
     The results of the economic simulation, using the Colorado Tax-PI model developed by REMI are
     as follows. The lost value of production would reduce employment in the first year by around
     33,500 to 43,000 jobs, and around 115,000 to 147,800 jobs by year 2030. The direct loss in state
     and local tax revenue from new oil and gas activity, including from severance taxes, property taxes,
     income taxes, and sales and use taxes, would range from between $201 Million and $258 Million
     in the first year, growing to between $825 Million and $1.1 Billion by 2030.
TABLE 1: SUMMARY RESULTS TABLE
                        Economic and Fiscal Impacts of Proposition 112 Summary Results Table
 10% Displacement                                      2019              2030                  2019-2030
 % of New Production Loss                              -80%               -80%                    80%
 % of All Production Loss                              -22%               -70%                    57%
 Employment (Units)                                   -43,000           -147,800                -109,500
 GDP (Billion 2018$)                                  -$6.216           -$26.312                -$217.926
 Tax Revenue (Million 2018$)                          -$258.47         -$1,060.55               -$9,020.31
 30% Displacement                                      2019              2030                  2019 - 2030
 % of New Production Loss                              -62%               -62%                    62%
 % of All Production Loss                              -17%               -54%                    44%
 Employment (Units)                                   -33,500           -115,000                 -85,200
 GDP (Billion 2018$)                                  -$4.836           -$20.462                -$169.486
 Tax Revenue (Million 2018$)                          -$201.03          -$824.87                -$7,015.80

     JULY 2018
 4   THE ECONOMIC AND FISCAL IMPACTS OF 2018 PROPOSITION 112
OVERVIEW
INTRODUCTION
From education to infrastructure to energy, the REMI Partnership examines the economic impacts
of policies, initiatives, and proposed laws by employing dynamic modeling and thorough policy
analysis that measures the impact of each measure on the Colorado economy.
This study is meant to give voters and policymakers in the state of Colorado sound economic
and policy information regarding Ballot Proposition 112, which, if passed, would heavily impact
the state economy. The REMI Partnership strives to provide policymakers, community leaders
and citizens of Colorado the facts and figures on free enterprise issues that impact their lives.
OVERVIEW AND HISTORY
The proposed Proposition 112 would increase the required setback distance for new oil and gas
drilling to 2,500 ft. It also modifies and expands the definition of occupied structures
and vulnerable areas that are subject to the setback requirement.
The definition of “occupied structure” includes any building or structure that requires a certificate
of occupancy or building or structure intended for human occupancy, such as, homes, schools
and hospitals.
“Vulnerable areas” includes playgrounds, permanent sports fields, amphitheaters, public parks,
public open space, public and community drinking water sources, irrigation canals, reservoirs,
lakes, rivers, perennial or intermittent streams, and creeks and any additional vulnerable areas
designated by the state or a local government.
The proponents of Proposition 112, Colorado Rising, state that the proximity to oil and gas
development, including the use of hydraulic fracturing or fracking, has detrimental impacts
on public health, safety and welfare, and the environment overall.
Proposition 112 further states that such detrimental impacts could be reduced if oil and gas
developments are located 2,500 feet away from occupied structures and vulnerable areas.
Many questions surround the impacts of Proposition 112:
• This new language of ballot Proposition 112 would effectively take out the application
and hearing process; an effective tool used between private exploration and production
companies and local governments and communities and relegate wells and production units
automatically to abide by the 2,500-foot setback rule.
• It is unclear what effect the change in language from “High Occupancy Building Unit”
and “Occupied Structure” would have on the issuance of new drilling permits.
• However, it is likely that “Occupied Structure” would encompass far more buildings than
“High Occupancy” thus increasing not only the distance of new oil and gas activity from
structures but also increasing the number of structures subject to setback.
JULY 2018
5 THE ECONOMIC AND FISCAL IMPACTS OF 2018 PROPOSITION 112• Additionally, giving local governments the power to decide which areas meet the
“vulnerable areas” standard would effectively preempt the state constitution as it stands
now as local governments do not have the power to decide whether to ban new oil and gas
developments within their city limits.
• Any area designated as “vulnerable” by a local government in the future, would only further
decrease the available land for future oil and gas activity.
• The extent to which the increase in the required setback would benefit public health. A 2017
study released by the Colorado Department of Public Health and the Environment
(Colorado Department of Public Health and Environment, 2017 ) concluded that results from
exposure and health effect studies do not indicate the need for immediate public health
action as there was no substantial or moderate evidence of health effects of communities
living near oil and gas operations.
CURRENT REGULATORY REQUIREMENTS
The most current language to be passed regarding setbacks was last adopted as of August 2013.
Colorado law now dictates that, “No Well or Production facility shall be located five hundred
feet or less from a Building Unit.” Additionally, “No Well or Production facility shall be located
one thousand feet or less from a High Occupancy Building Unit without Commission approval
following Application and Hearing.”
Along with the existing setback requirements, there are various other areas of regulation
imposed on the oil and gas industry in Colorado (Amundson, 2018). These regulations were
updated and strengthened on a near annual basis and numerous times throughout the
last decade during the recent administrations of Democratic Governors Bill Ritter and
John Hickenlooper.
Existing oil and gas regulation covers all aspects of oil and gas operations from initial exploration
to transportation and clean-up. For more information on these regulations, see the Colorado Oil
and Gas Conservation Commission website (https://cogcc.state.co.us/reg.html#/overview) as well
as the Colorado Department of Public Health and Environment website
(https://www.colorado.gov/pacific/cdphe/aqcc-regs).
Here is a timeline of some of the previous initiatives related to oil and gas development activities;
• In 2013, five Colorado communities passed local initiatives to pass moratoriums on fracking.
These communities include Boulder, Broomfield, Fort Collins, Longmont and Brighton.
• In 2016, the Colorado Supreme Court struck down the local prohibitions on fracking, stating
that the moratoriums were invalid due to the pre-emption of state law.
• In 2016, the State Legislature prepared an initiative mirroring the language of Proposition
112 that ultimately failed to make it onto the state-wide ballot for voting.
• In 2016, there was a Colorado Ballot Proposal that would ban the use of hydraulic fracturing
altogether in the state of Colorado, which also failed.
• In 2016, a Ballot Initiative was cancelled which would have given local governments control
over how to plan and regulate land use, including the authority to regulate land use to limit
any detrimental impact on their community, including oil and gas use as it relates to public
health and safety.
JULY 2018
6 THE ECONOMIC AND FISCAL IMPACTS OF 2018 PROPOSITION 112PREVIOUS ECONOMIC IMPACT RESEARCH
In 2014, conducted by the REMI Partnership, the Business Research Division of the Leeds School
of Business at the University of Colorado analyzed price and policy impacts on the oil and gas
industry, including analyzing a failed ballot measure that would have increased the set-back as it
currently stands from to 2,000 feet in the state of Colorado. (Business Research Division, Leeds
School of Business, 2014)
According to this study, “a 2,000-foot setback would curtail drilling locations by 25% to 50%.”
Additionally, “Given a 25% reduction…the economic consequence would result in a lower GDP
by an average of $3 billion and 18,000 fewer jobs in the first five years, and a lower GDP by an
average of $3.2 billion and 24,400 fewer jobs between 2015 and 2040.”
“Given a 50% reduction in new production…the economic consequence would result in a lower
GDP by an average of $4.4 billion and 36,000 fewer jobs in the first five years, and a lower GDP
by an average of $6.4 billion and 49,000 fewer jobs between 2015 and 2040.”
In 2016, the University of Colorado analyzed price and policy impacts on oil and gas
developments in the state of Colorado by analyzing a failed ballot measure that would have
increased the setback to 2,500 feet (Business Research Division, Leeds School of Business, 2016).
According to this study, “a 2,500-foot setback would curtail accessible [surface] drilling locations
by 90.2%.”
Furthermore, “Assuming a 90.2% reduction in new production in 2017, the compounding
economic consequence would result in a lower real GDP by an average of $7.1 billion and 54,000
jobs in the first five years, and a lower GDP by an average of $14.5 billion and 104,000 fewer jobs
between 2017 and 2031.”
JULY 2018
7 THE ECONOMIC AND FISCAL IMPACTS OF 2018 PROPOSITION 112FINDINGS
METHODOLOGY
The economic impacts presented in this report were developed using the dynamic forecasting
and economic simulation model Tax-PI, developed and calibrated by Regional Economic Models
Incorporated or REMI (a private company separate from the REMI Partnership) exclusively for
the state of Colorado. The direct impacts to future oil and gas production were estimated using
historical production data and GIS maps of the 2,500-foot setback area produced by the Colorado
Oil and Gas Conservation Commission (COGCC). The average percentage of new oil and gas
production from 2015 to 2017 that has occurred on land that would be off-limits due to the large
setback was applied to a baseline forecast of new oil and gas production.
There are two scenarios for the economic impact simulations. Scenario 1 assumes that 10% of the
new oil and gas activity expected to occur within the setback area will still be able to occur on land
outside the setback area. Scenario 2 assumes that 30% of the new oil and gas activity expected
to occur within the setback area will now occur on land outside the setback area. This assumption
was not included in previous research, as there is no strong evidence to suggest exactly how
much lost production can occur from outside the setback area. There are several reasons why
it is expected to be challenging to continue to access those resources by drilling horizontally
underneath the surface setback area.
• As larger setback zones run into each other, the eventual drilling distance will be much
longer than 2,500-ft or what is possible to access with current technology.
• It is not as likely that companies could get access to drill from beyond the setback area to
access resources underneath the new setback areas. Getting the surface permits would be
more challenging for several reasons including the fact that to access the mineral rights
would require drilling through areas that the company may not have the rights to drill
through.
• The cost to access any resource that is both technologically and legally possible would be
significantly more expensive. This would make it far more likely for oil and gas companies to
invest their extraction resources elsewhere.
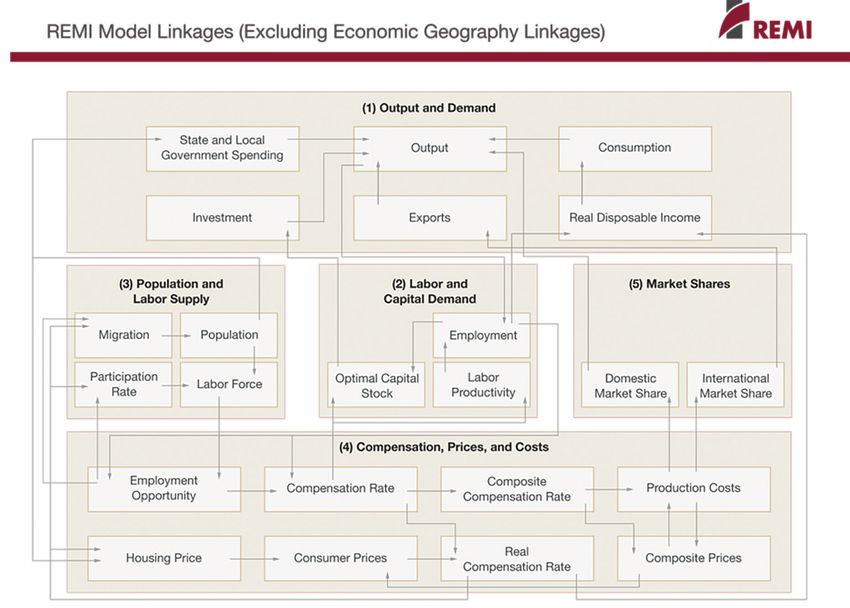
For reference, here is a map of the surface area in Weld County restricted under the current 500-ft
setback requirement, compared to the 2,500-ft setback area.
JULY 2018
8 THE ECONOMIC AND FISCAL IMPACTS OF 2018 PROPOSITION 112FIGURE 1: 2018 SURFACE SETBACK FIGURE 2: 2018 SURFACE SETBACK
AREA AT CURRENT 500 FEET AREA AT PROPOSED 2,500-FEET
TABLE 2: FORECASTED DOLLAR VALUE AND PERCENT OF OIL AND GAS PRODUCTION INSIDE
VS OUTSIDE THE PROPOSED 2,500-FT SETBACK AREA, 2019-2030
Total (New + Existing) Oil and Gas Production 2019-2030
Forecasted dollar value and percent of state total
OIL GAS
Amount % of Amount % of Statewide
(Billion 2018$) Statewide Total (Billion 2018 $) Total
INSIDE 2,500 FT SETBACK AREA
DJ Basin $106.45 69.1% $34.04 35.9%
Rest of Colorado $1.86 1.2% $14.25 15.0%
Subtotal $108.31 70.3% $48.29 51.0%
OUTSIDE SETBACK AREA
DJ Basin $42.80 27.8% $17.67 18.7%
Rest of Colorado $2.89 1.9% $28.77 30.4%
Subtotal $45.69 29.9% $46.44 49.0%
STATE TOTAL
DJ Basin $149.25 96.9% $51.72 54.6%
Rest of Colorado $4.75 3.1% $43.02 45.4%
State Total $154.00 100.00% $94.73 100.00%
JULY 2018
9 THE ECONOMIC AND FISCAL IMPACTS OF 2018 PROPOSITION 112RESULTS
The results are presented for both the direct impacts and the statewide macroeconomic impacts.
The direct impacts represent the estimated loss in new oil and gas production if Proposition 112
were to pass.
The direct impacts in Table 3 are displayed across several different dimensions:
• DJ Basin vs Rest of the State
• Oil vs Gas vs Total
• Dollar value of production
• Percentage loss of new production vs percentage loss of total production
The dynamic statewide impacts represent the economic loss to other industry sectors and
individuals as the direct losses in oil and gas extraction would ripple throughout the rest of the
state’s economy. The Tax-PI model captures several distinct economic linkages including the
disruption to the industry supply chain, the loss of consumer demand from fewer jobs and lower
income, and in lower investment in non-residential and residential capital and equipment.
The model captures the economy-wide impacts on such categories as employment, income,
and value-added.
DIRECT IMPACTS
TABLE 3: DOLLAR VALUE AND PERCENTAGE OF ESTIMATED LOST OIL AND GAS PRODUCTION
Annual Dollar Value and Percentage Loss of Oil and Gas Production (Billion $)
10% DISPLACEMENT 30% DISPLACEMENT
YEAR Dollar Value Loss in the % of New % of All Dollar Value Loss in the % of New % of All
Setback Area Production Loss Production Loss Setback Area Production Loss Production Loss
DJ BASIN
2019 -$3.76 -81.0% -26.0% -$2.93 -63.0% -20.3%
2020 -$6.64 -81.2% -46.7% -$5.16 -63.1% -36.3%
2021 -$7.92 -81.3% -54.4% -$6.16 -63.2% -42.3%
2022 -$8.88 -81.3% -59.1% -$6.91 -63.2% -46.0%
2023 -$9.76 -81.3% -62.5% -$7.59 -63.3% -48.6%
2024 -$10.56 -81.4% -65.0% -$8.22 -63.3% -50.5%
2025 -$11.36 -81.4% -67.0% -$8.84 -63.3% -52.1%
2026 -$12.14 -81.4% -68.6% -$9.44 -63.3% -53.3%
2027 -$12.94 -81.4% -69.9% -$10.07 -63.3% -54.4%
2028 -$13.60 -81.5% -71.1% -$10.58 -63.4% -55.3%
2029 -$14.18 -81.5% -74.6% -$11.03 -63.4% -58.0%
2030 -$14.70 -81.5% -75.3% -$11.44 -63.4% -58.5%
JULY 2018
10 THE ECONOMIC AND FISCAL IMPACTS OF 2018 PROPOSITION 11210% DISPLACEMENT 30% DISPLACEMENT
YEAR Dollar Value Loss in the % of New % of All Dollar Value Loss in the % of New % of All
Setback Area Production Loss Production Loss Setback Area Production Loss Production Loss
REST OF COLORADO
2019 -$0.27 -69.2% -7.0% -$0.21 -53.8% -5.4%
2020 -$0.60 -69.1% -15.7% -$0.47 -53.8% -12.2%
2021 -$0.79 -69.1% -20.7% -$0.61 -53.8% -16.1%
2022 -$0.93 -69.1% -24.6% -$0.73 -53.8% -19.1%
2023 -$1.07 -69.1% -27.9% -$0.83 -53.8% -21.7%
2024 -$1.20 -69.1% -30.7% -$0.93 -53.8% -23.9%
2025 -$1.33 -69.1% -33.3% -$1.03 -53.8% -25.9%
2026 -$1.44 -69.1% -35.8% -$1.12 -53.7% -27.8%
2027 -$1.56 -69.1% -38.1% -$1.21 -53.7% -29.6%
2028 -$1.67 -69.1% -40.2% -$1.30 -53.7% -31.3%
2029 -$1.77 -69.1% -42.2% -$1.38 -53.7% -32.8%
2030 -$1.87 -69.1% -44.1% -$1.45 -53.7% -34.3%
STATE TOTAL
2019 -$4.04 -80.1% -22.0% -$3.14 -62.3% -17.1%
2020 -$7.24 -80.0% -40.1% -$5.63 -62.2% -31.2%
2021 -$8.70 -80.0% -47.4% -$6.77 -62.2% -36.9%
2022 -$9.81 -80.0% -52.2% -$7.63 -62.2% -40.6%
2023 -$10.83 -79.9% -55.6% -$8.42 -62.2% -43.3%
2024 -$11.76 -79.9% -58.3% -$9.15 -62.2% -45.3%
2025 -$12.69 -79.9% -60.6% -$9.87 -62.2% -47.1%
2026 -$13.58 -79.9% -62.5% -$10.56 -62.1% -48.6%
2027 -$14.50 -79.9% -64.2% -$11.28 -62.1% -49.9%
2028 -$15.26 -79.9% -65.6% -$11.87 -62.1% -51.0%
2029 -$15.95 -79.9% -68.8% -$12.41 -62.1% -53.5%
2030 -$16.57 -79.9% -69.7% -$12.89 -62.1% -54.2%
JULY 2018
11 THE ECONOMIC AND FISCAL IMPACTS OF 2018 PROPOSITION 112TABLE 4: IMPACTS ON STATE AND LOCAL TAX REVENUE
Reduction in State and Local Oil and Gas Tax Revenue (Million $)
YEAR 10% DISPLACEMENT SCENARIO 30% DISPLACEMENT SCENARIO
2019 -$258.47 -$201.03
2020 -$463.40 -$360.42
2021 -$556.89 -$433.14
2022 -$628.03 -$488.47
2023 -$693.04 -$539.03
2024 -$752.96 -$585.64
2025 -$812.09 -$631.62
2026 -$869.02 -$675.91
2027 -$927.86 -$721.67
2028 -$976.89 -$759.81
2029 -$1,021.11 -$794.20
2030 -$1,060.55 -$824.87
Sum -$9,020.31 -$7,015.80
DYNAMIC STATEWIDE IMPACTS
The macroeconomic impacts represent the total change relative to the baseline for each
forecasted year. For instance, with only 10% anticipated displacement, in 2019 the estimated
impact on jobs is - 43,000 which grows to -147,800 by 2030. This means that there are estimated
to be 43,000 fewer jobs in 2019 and 147,800 fewer jobs in 2030 than were projected in the
current policy REMI baseline as a result of the direct losses in new oil and gas production.
Because the same job may continue from year-to-year, multiple years of job loss are represented
as an annual average loss rather than a cumulative loss. For Gross State Product and personal
income, the multiple year losses are summed together as each year the value of each category
starts again at $0.
TABLE 5: EMPLOYMENT IMPACTS
Impact on Employment (Units)
2019 2025 2030 2019-2030 AVERAGE
10% 30% 10% 30% 10% 30% 10% 30%
displacement displacement displacement displacement displacement displacement displacement displacement
-43,000 -33,500 -117,300 -91,200 -147,800 -115,000 -109,500 -85,200
-1.15% -0.90% -3.22% -2.50% -4.07% -3.16%
JULY 2018
12 THE ECONOMIC AND FISCAL IMPACTS OF 2018 PROPOSITION 112TABLE 6: GROSS STATE PRODUCT (GSP) IMPACTS
Impact on Gross State Product (GSP) (Billion 2018$)
2019 2025 2030 2019-2030 SUM
10% 30% 10% 30% 10% 30% 10% 30%
displacement displacement displacement displacement displacement displacement displacement displacement
-$6.216 -$4.836 -$19.386 -$15.077 -$26.312 -$20.462 -$217.926 -$169.486
-1.75% -1.36% -5.03% -3.91% -6.29% -4.89%
TABLE 7: PERSONAL INCOME IMPACTS
Impact on Personal Income (Billion 2018$)
2019 2025 2030 2019-2030 SUM
10% 30% 10% 30% 10% 30% 10% 30%
displacement displacement displacement displacement displacement displacement displacement displacement
-$3.983 -$3.098 -$13.114 -$10.201 -$18.492 -$14.386 -$147.636 -$114.845
-1.22% -0.97% -3.54% -2.82% -4.50% -3.60%
Table 8 and 9 show the impacts on employment and Value-added by the most impacted sectors as
a percent of the total. 57% of all value-added lost between 2019 and 2030 comes from industries
outside of oil and gas, while 77% of all jobs lost are outside of the oil and gas extraction industry.
TABLE 8: IMPACTS BY INDUSTRY AS PERCENT OF TOTAL VALUE-ADDED IMPACTS
Value Added Impact by Industry as a Percent of Total
INDUSTRY PERCENTAGE OF TOTAL
Oil and gas extraction 54%
Professional, scientific, and technical services 7%
Retail trade 5%
Real estate 5%
Construction 4%
Wholesale trade 3%
State and Local Government 3%
Ambulatory health care services 2%
Telecommunications 1%
Administrative and support services 1%
Food services and drinking places 1%
All other Industries 14%
JULY 2018
13 THE ECONOMIC AND FISCAL IMPACTS OF 2018 PROPOSITION 112TABLE 9: IMPACTS BY INDUSTRY AS PERCENT OF TOTAL EMPLOYMENT IMPACTS
Employment Impact by Industry as a Percent of Total
INDUSTRY PERCENTAGE OF TOTAL
Oil and gas extraction 23%
Retail trade 11%
Professional, scientific, and technical services 10%
Health care and social assistance 8%
Construction 7%
Accommodation and food services 6%
State and Local Government 6%
Other services 5%
(except public administration)
Administrative, support, waste management, and 4%
remediation services
Real estate and rental and leasing 4%
All other Industries 17%
CONCLUSION
Colorado’s oil and gas industry supports hundreds of thousands of jobs in the state across nearly
all sectors of the economy. In addition, the industry operates within some of the nation’s strictest
regulations regarding safety, water monitoring and air quality.
A change from the existing 500-foot setback requirement to a 2,500-foot requirement would
eliminate between 62% and 80% of annual new oil and gas development in the state. By 2030,
it would reduce the total value of production in the state by between 54% and 70%. The state
and local tax revenue lost from the reductions in the oil and gas industry alone would range from
-$201M to -$258M in the first year, to between -$825M and -$1.1B annually by 2030. And by 2030
there would be roughly 115,000 to 147,800 fewer jobs through all sectors of the economy.
JULY 2018
14 THE ECONOMIC AND FISCAL IMPACTS OF 2018 PROPOSITION 112APPENDIX A - METHODOLOGY
The goal of this research is to determine the economic impacts of a 2,500-foot oil and gas setback
in Colorado compared to a current policy baseline. The methodology to get to the ultimate
economic impacts is outlined in several different phases. The process can be broadly thought
of as an effort to determine the direct economic shocks of the policy and running the economic
simulation model to determine the cascading dynamic economic impacts.
1. Development of current policy baseline
2. Direct economic impacts
3. Statewide economic impacts
I. Development of current policy baseline
To determine the impacts of Proposition 112, there must first be a baseline to measure against.
While the Tax-PI Model developed by Regional Economic Models Inc, or REMI, contains a
macroeconomic baseline, it is also necessary to estimate a current baseline for the estimated
future production and economic activity of the oil and gas industry. The initial step consists of
overlaying the publicly released COGCC GIS map files released on July 2, 2018, that outline the
surface land available for new oil and gas development with historic location specific production
data. A GIS Analyst with Noble Energy performed the mapping overlay and produced annual
historic estimates on the amount of new oil and gas production that has occurred inside or outside
of the proposed setback area across several dimensions.
a. Within the DJ Basin vs Rest of Colorado
b. On federal land
c. Within municipal boundaries
Baseline production forecast
The estimate of future production from new wells was then produced for the area that under
current policy would occur within the 2,500-setback area and for what would likely occur outside
of the 2,500-foot setback area. The future production forecast combines new annual production
dictated by rig counts and forecasted prices combined with each new wells future production
based on anticipated decline curves (i.e. First year production from new wells + future annual
production of those wells).
A strong correlation is observed between historic oil and gas prices and rig counts. The correlation
coefficient between the WTI Spot Price from EIA and the Baker Hughes US Rig Count (Baker
Hughes , 2018), lagged by 3-months, is 0.96. Due to this close relationship, a forecast of future rig
counts is generated based on external pricing forecasts. The regression equation is determined as
following with a significant critical (all p-values < .05) value:
Rigs in 3 Months = -7.47678915 + 0.747902679 x Current Oil Price
JULY 2018
15 THE ECONOMIC AND FISCAL IMPACTS OF 2018 PROPOSITION 112The monthly forecast price of both oil and gas is the average of two separate sources; Moody’s
Analytics and CME Group (CME Group). The difference from the historic Colorado price and
national price, as reported by EIA (U.S. Energy Information Administration, Last Updated July
19, 2018), was removed from the national average. The price projections from CME Group are
available for each future month from 2018 to 2027. The last price in year 2027 is assumed to
remain constant until year 2030. The forecasted statewide future rig counts are then shared out
into projections of rigs in DJ basin and in the rest of Colorado based on historic averages.
Annual average production per rig is calculated by dividing the last three years of oil and gas
production by the rig counts in that year. Overall, extraction technology in the oil and gas industry
in the past 3 years remained relatively static after making significant leaps after 2014. Therefore,
future production of oil and gas from new wells in their first calendar year is determined by
multiplying the forecasted future rig counts in each region by the three-year average annual
production per rig constant.
The annual rate of production decline for each future year was estimated by a Stimulation Advisor
at Noble Energy using RS Energy Group software. The total production that occurred in the first
calendar year from new wells was estimated to decline in future years based on that estimated
decline curve. The total estimated loss in production is then estimated as the sum of future new
wells forecasted production from 2019 through 2030.
II. Direct impacts of a 2,500-ft setback policy
To model the dynamic economic and fiscal impacts of a 2,500-foot setback, the starting point is
determining the direct model inputs. The direct inputs or direct impacts represent the impacts
occurring as an immediate result of the policy change. The direct impacts are then used as inputs
to the economic simulation model, Tax-PI, developed by REMI, to estimate the ripple effects. For
this research, the direct impacts are the estimated loss in new oil and gas production described
in the section above. The total amount of production expected to occur inside of a potential
setback area, was multiplied by the projected future price to determine the total dollar value. The
estimated annual lost value of production was then divided by the total production value in the
current policy baseline and entered in the model as a percentage loss in output in Oil and gas
extraction. (NAICS 211)
NAICS 211 – Oil and Gas Extraction Definition
“Industries in the Oil and Gas Extraction subsector operate and/or develop oil and gas field
properties. Such activities may include exploration for crude petroleum and natural gas;
drilling, completing, and equipping wells; operating separators, emulsion breakers, desilting
equipment, and field gathering lines for crude petroleum and natural gas; and all other activities
in the preparation of oil and gas up to the point of shipment from the producing property. This
subsector includes the production of crude petroleum, the mining and extraction of oil from
oil shale and oil sands, the production of natural gas, sulfur recovery from natural gas, and recovery of
hydrocarbon liquids.
Establishments in this subsector include those that operate oil and gas wells on their own account
or for others on a contract or fee basis. Establishments primarily engaged in providing support
services, on a contract or fee basis, required for the drilling or operation of oil and gas wells
(except geophysical surveying and mapping, mine site preparation, and construction of oil/gas
pipelines) are classified in Subsector 213, Support Activities for Mining.”
JULY 2018
16 THE ECONOMIC AND FISCAL IMPACTS OF 2018 PROPOSITION 112Within the framework of the calculations described in Section I, two scenarios were created to
account for the uncertainty surrounding the extent to which projected production expected to
occur within the setback areas could still be accessed from outside the new 2,500-foot setback zone.
Economic Impact Scenarios
Scenario 1 – Assume 10% of lost production can occur from outside setback area
Scenario 2 – Assume 30% of lost production can occur from outside setback area
These scenarios have the effect of dampening the economic impacts of the setback by assuming
that some amount of forecasted production will be displaced to areas outside of the setback zone.
The ability for this displacement to occur is highly unlikely in most cases as numerous barriers and
economic challenges exist.
a. Even though horizontal drilling has the capacity to access resources at a distance beyond
2,500-ft, as setback “buffer zone” collides against other “buffer zones,” the actual distance to
reach most resources goes well beyond the horizontal drilling capability. Please see figure
1 and figure 2 for a map of Weld county setback areas under current 500-ft compared to
2,500-ft.
b. It is not as likely that companies could get access to drill from beyond the setback area to
access resources underneath the new setback areas. Getting the surface permits would be
more challenging for several reasons including the fact that to access the mineral rights
would require drilling through areas that the company may not have the rights to
drill through.
c. If each of the above challenges can be met, the cost of extracting the resources will be
much higher relative to more easily accessed reserves. As such, unless the price climbs
significantly, it is not likely that reserves that are now under a 2,500ft setback would be
immediately drilled in the same timeframe as current baseline, further emphasizing the
overall percent decline.
No direct assumptions were made about additional direct losses or changes because of
Proposition 112, beyond the percentage reduction in output of the oil and gas extraction industry.
There was no strong basis for direct inputs to be formulated that quantified any offsetting positive
impacts to health or land or property values that could be used as model inputs.
A 2017 report put forward by the Colorado Department of Public Health and Environment, entitled
“Assessment of Potential Public Health Effects from Oil and Gas Operations in Colorado (Colorado
Department of Public Health and Environment, 2017),” concluded the risk of harmful health
effects is low for residents living near oil and gas operations, and that at this time the research and
monitoring do not indicate the need for immediate public health action.
Given the uncertainty around the ability for oil and gas companies to continue to be able to access
resources underneath setback areas, the simulation model was run with two scenarios.
III. Statewide economic impacts of 2,500 ft setback policy
Under current policy, it is assumed that oil and gas development and production will occur on
available land based upon historic production and decline rates and projected future prices.
Through GIS mapping and data compiled by COGCC, an estimate of the amount of historical oil
JULY 2018
17 THE ECONOMIC AND FISCAL IMPACTS OF 2018 PROPOSITION 112and gas activity that would have occurred inside and outside of the expanded setback region can
be created. Then the projected production from existing wells is combined with the future drilling
activity and production of future wells. This provides a comprehensive projection of all oil and gas
activity contained within and outside of the projected 2,500 ft setback area between 2019 and 2030.
For purpose of the economic impact scenario, the new oil and gas drilling and production activity
that is projected to occur within the 2,500 ft setback area is removed from the dynamic economic
simulation model Tax-PI, developed by REMI, to produce the statewide economic and fiscal
impacts across all sectors and parts of the economy.
The statewide macroeconomic impacts included the changes in jobs, gross state product and
personal income. The impacts in each year should be interpreted as representing the impacts
relative to the baseline for that year.
Following the direct inputs, several adjustments were made within the Tax-PI model to reflect the
unique aspects of the oil and gas industry and the model’s default responses.
Adjustment 1 – Residence Adjustment – 10% of all compensation lost directly by the oil and
gas extraction industry was put back into the economy. This is to adjust for oil and gas workers
who were working in Colorado but living elsewhere, and therefore would not have their lost
compensation impact the Colorado economy. Relative to other oil and gas producing states,
a lower percentage of oil and gas workers work in Colorado but live somewhere else, but it is
still reasonable to assume it is still a higher percentage than the average of all industries.
TABLE 10: RESIDENCE ADJUSTMENT CALCULATIONS
REMI Tax-PI Model Residence Adjustment
10% DISPLACEMENT 30% DISPLACEMENT
*Average Annual
YEAR Compensation Rate 10% of Lost Jobs Million $ Increase Million $ Increase
10% of Lost Jobs in
(Current $) in Oil and Gas in Residence in Residence
Oil and Gas Extraction
Extraction Adjustment Adjustment
2019 $53,346 -933 -$49.79 -726 -$38.72
2020 $56,230 -1722 -$96.82 -1339 -$75.30
2021 $58,970 -2059 -$121.44 -1601 -$94.42
2022 $61,760 -2279 -$140.74 -1772 -$109.42
2023 $64,590 -2447 -$158.08 -1903 -$122.88
2024 $67,387 -2597 -$175.02 -2019 -$136.03
2025 $70,331 -2727 -$191.80 -2119 -$149.05
2026 $73,384 -2841 -$208.51 -2208 -$162.01
2027 $76,539 -2963 -$226.82 -2302 -$176.22
2028 $79,807 -3068 -$244.82 -2383 -$190.18
2029 $82,455 -3279 -$270.35 -2547 -$209.99
2030 $85,173 -3386 -$288.40 -2630 -$223.97
*COMPENSATION PROJECTIONS TAKEN FROM TAX-PI BASELINE CONTROL
JULY 2018
18 THE ECONOMIC AND FISCAL IMPACTS OF 2018 PROPOSITION 112Adjustment 2 – Alternative Investment Response – The alternative investment response was
turned on instead of the REMI’s current default response, because of the dynamic impacts
expected within the construction sector. With the default investment response, the loss in the
NAICS industry Oil and Gas Extraction was generating a very high response in non-residential
and residential spending which triggered significant losses in the construction industry. While
we expect to have a strong response in certain construction sectors, particularly heavy and civil
engineering construction, we expect some of the lost demand for construction workers to be
made up by demand from other parts of the economy due to the current tight labor market.
Therefore, a lower investment response impacting non-residential construction
was appropriate.
Adjustment 3 - Alternative Government Spending Response – The government spending
response to changes in GDP was turned off due to expectation that some revenue losses to
local governments would be partially offset by spending from other parts of the state budget.
With the adjustment, the relative impacts on state and local government are more in-line with
previous findings in relation to the impacts on the government sector including employment
and spending.
STATE AND LOCAL TAX REVENUE IMPACT
The fiscal impact results represent the direct impact on state and local tax revenue generated
from the activity of the oil and gas industry. According to a memo released by the Legislative
Council (Silbaugh, January 12, 2018) in January of 2018, the effective tax rate of all state and local
taxes for oil and natural gas producers was 6.4% in FY 2016-2017. This includes the categories
of production tax, property taxes, income taxes and sales and use taxes. The projected direct
revenue is derived by using the above effective tax rate multiplied by the annual value of lost oil
and gas production.
JULY 2018
19 THE ECONOMIC AND FISCAL IMPACTS OF 2018 PROPOSITION 112APPENDIX B - MODEL FRAMEWORK – WWW.REMI.COM
PI+, Tax-PI and TranSight are structural economic forecasting and policy analysis models. The
following core framework applies to all REMI model builds. More information about Tax-PI can
be found at www.remi.com. The model integrates input-output, computable general equilibrium,
econometric and economic geography methodologies. The model is dynamic, with forecasts and
simulations generated on an annual basis and behavioral responses to compensation, price, and
other economic factors.
The model consists of thousands of simultaneous equations with a structure that is relatively
straightforward. The exact number of equations used varies depending on the extent of industry,
demographic, demand, and other detail in the specific model being used. The overall structure of
the model can be summarized in five major blocks: (1) Output and Demand, (2) Labor and Capital
Demand, (3) Population and Labor Supply, (4) Compensation, Prices, and Costs, and (5) Market
Shares. The blocks and their key interactions are shown in Figures 1 and 2.
FIGURE 1: REMI MODEL LINKAGES
JULY 2018
20 THE ECONOMIC AND FISCAL IMPACTS OF 2018 PROPOSITION 112FIGURE 2: ECONOMIC GEOGRAPHY LINKAGES
The Output and Demand block consists of output, demand, consumption, investment,
government spending, exports, and imports, as well as feedback from output change due to the
change in the productivity of intermediate inputs. The Labor and Capital Demand block includes
labor intensity and productivity as well as demand for labor and capital. Labor force participation
rate and migration equations are in the Population and Labor Supply block. The Compensation,
Prices, and Costs block includes composite prices, determinants of production costs, the
consumption price deflator, housing prices, and the compensation equations. The proportion
of local, inter-regional, and export markets captured by each region is included in the Market
Shares block.
Models can be built as single region, multi-region, or multi-region national models. A region is
defined broadly as a sub-national area, and could consist of a state, province, county, or city, or
any combination of sub-national areas.
Single-region models consist of an individual region, called the home region. The rest of the
nation is also represented in the model. However, since the home region is only a small part of the
total nation, the changes in the region do not have an endogenous effect on the variables in the
rest of the nation.
JULY 2018
21 THE ECONOMIC AND FISCAL IMPACTS OF 2018 PROPOSITION 112Multi-regional models have interactions among regions, such as trade and commuting flows.
These interactions include trade flows from each region to each of the other regions. These flows
are illustrated for a three-region model in Figure 3.
FIGURE 3: TRADE AND COMMUTER FLOW LINKAGES
Multi-regional national models also include a central bank monetary response that constrains
labor markets. Models that only encompass a relatively small portion of a nation are not
endogenously constrained by changes in exchange rates or monetary responses.
Block 1. Output and Demand
This block includes output, demand, consumption, investment, government spending, import,
commodity access, and export concepts. Output for each industry in the home region is
determined by industry demand in all regions in the nation, the home region’s share of each
market, and international exports from the region.
For each industry, demand is determined by the amount of output, consumption, investment,
and capital demand on that industry. Consumption depends on real disposable income per
capita, relative prices, differential income elasticities, and population. Input productivity depends
on access to inputs because a larger choice set of inputs means it is more likely that the input
with the specific characteristics required for the job will be found. In the capital stock adjustment
process, investment occurs to fill the difference between optimal and actual capital stock for
residential, non-residential, and equipment investment. Government spending changes are
determined by changes in the population.
JULY 2018
22 THE ECONOMIC AND FISCAL IMPACTS OF 2018 PROPOSITION 112Block 2. Labor and Capital Demand
The Labor and Capital Demand block includes the determination of labor productivity, labor intensity,
and the optimal capital stocks. Industry-specific labor productivity depends on the availability of workers
with differentiated skills for the occupations used in each industry. The occupational labor supply and
commuting costs determine firms’ access to a specialized labor force.
Labor intensity is determined by the cost of labor relative to the other factor inputs, capital and fuel.
Demand for capital is driven by the optimal capital stock equation for both non-residential capital
and equipment. Optimal capital stock for each industry depends on the relative cost of labor and capital,
and the employment weighted by capital use for each industry. Employment in private industries is
determined by the value added and employment per unit of value added in each industry.
Block 3. Population and Labor Supply
The Population and Labor Supply block includes detailed demographic information about the region.
Population data is given for age, gender, and race, with birth and survival rates for each group. The size
and labor force participation rate of each group determines the labor supply. These participation rates
respond to changes in employment relative to the potential labor force and to changes in the real after-
tax compensation rate. Migration includes retirement, military, international, and economic migration.
Economic migration is determined by the relative real after-tax compensation rate, relative employment
opportunity, and consumer access to variety.
Block 4. Compensation, Prices and Costs
This block includes delivered prices, production costs, equipment cost, the consumption deflator,
consumer prices, the price of housing, and the compensation equation. Economic geography concepts
account for the productivity and price effects of access to specialized labor, goods, and services.
These prices measure the price of the industry output, taking into account the access to production
locations. This access is important due to the specialization of production that takes place within each
industry, and because transportation and transaction costs of distance are significant. Composite prices
for each industry are then calculated based on the production costs of supplying regions, the effective
distance to these regions, and the index of access to the variety of outputs in the industry relative to the
access by other uses of the product.
The cost of production for each industry is determined by the cost of labor, capital, fuel, and
intermediate inputs. Labor costs reflect a productivity adjustment to account for access to specialized
labor, as well as underlying compensation rates. Capital costs include costs of non-residential structures
and equipment, while fuel costs incorporate electricity, natural gas, and residual fuels.
The consumption deflator converts industry prices to prices for consumption commodities. For potential
migrants, the consumer price is additionally calculated to include housing prices. Housing prices change
from their initial level depending on changes in income and population density.
Compensation changes are due to changes in labor demand and supply conditions and changes in the
national compensation rate. Changes in employment opportunities relative to the labor force
and occupational demand change determine compensation rates by industry.
JULY 2018
23 THE ECONOMIC AND FISCAL IMPACTS OF 2018 PROPOSITION 112Block 5. Market Shares
The market shares equations measure the proportion of local and export markets that are captured by
each industry. These depend on relative production costs, the estimated price elasticity of demand, and
the effective distance between the home region and each of the other regions. The change in share
of a specific area in any region depends on changes in its delivered price and the quantity it produces
compared with the same factors for competitors in that market. The share of local and external markets
then drives the exports from and imports to the home economy.
REFERENCES
Baker Hughes . (2018, July ). Retrieved from http://phx.corporate-ir.net/phoenix.
zhtml?c=79687&p=irol-reportsother
Business Research Division, Leeds School of Business. (2014). Colorado Oil and Gas Industry
Updated Economic Assessment of Colorado Oil and Gas Ballot Initiatives in 2014.
Business Research Division, Leeds School of Business. (2016). Colorado Oil and Gas Industry
Economic Assessment of 2,500-Foot Oil and Gas Setback Proposal.
CME Group. (n.d.). Crude Oil Futures Quotes. Retrieved from https://www.cmegroup.com/trading/
energy/crude-oil/light-sweet-crude_quotes_globex.html
Colorado Department of Public Health and Environment. (2017 ). Assessment of Potential Public
Health Effects from Oil and Gas Operations in Colorado. Colorado Department of Public Health
and the Environment.
Colorado Oil and Gas Conservation Commission. (2018 ). Colorado Ballot Initiative #97 2500’
Setback Requirement for Oil and Gas Development GIS-Based Impact Assessment.
Silbaugh, L. (January 12, 2018). Memorandum; Effective Severance Tax Rates on Oil and Gas.
Retrieved from https://leg.colorado.gov/sites/default/files/interested_persons_memo_on_
severance_taxes.pdf
U.S. Energy Information Administration. (Last Updated July 19, 2018). Colorado State Profile and
Energy Estimates.
JULY 2018
24 THE ECONOMIC AND FISCAL IMPACTS OF 2018 PROPOSITION 112You can also read