India Digital Payments Report - Worldline
←
→
Page content transcription
If your browser does not render page correctly, please read the page content below

India Digital
Payments
Report

2020

We witnessed digital payments taking center stage across the globe in 2020. In India, new
and old payment channels have catered to market needs ensuring long-term growth not only
in terms of on-boarding new merchants and customers in the payments ecosystem but also
increasing the number of digital transactions. New payment systems like FASTag and Bharat
BillPay matured in the previous year while payment gateways continued to be the reliable
partners to facilitate end to end payments for consumers and merchants alike.

In 2020, we also witnessed key developments from the regulatory standpoint such as the
creation and operationalization of the Payments Infrastructure Development Fund, a pilot
scheme for small value payments in offline mode, Streamlining QR Code infrastructure,
setting up of a Self-Regulatory Organisation for Payment System Operators among others;
these will lead to sustainable positive changes.

For Worldline, 2020 was a landmark year as we successfully completed the acquisition of
Ingenico and emerged as the largest merchant acquirer and payment processor in Europe
and number 4 globally. We are now able to offer our banking and merchant partners a
comprehensive and enhanced range of innovative solutions in online payments, physical
merchant acquiring and transaction processing services among others.

As we conclude Q1 2021 and continue to grow with strong momentum, it is useful for us to
take a look at how digital payment instruments fared in the previous year.

This annual report gives an in-depth look at digital transactions in India in 2020 as well as
insights on transactions that were processed on our network. In addition, we give our
perspective on how consumers’ payment experience will transform in the near future and our
thoughts on the New Umbrella Entity for Retail Payments initiative.

Happy Reading!
Deepak Chandnani
Managing Director, Worldline South Asia & Middle East
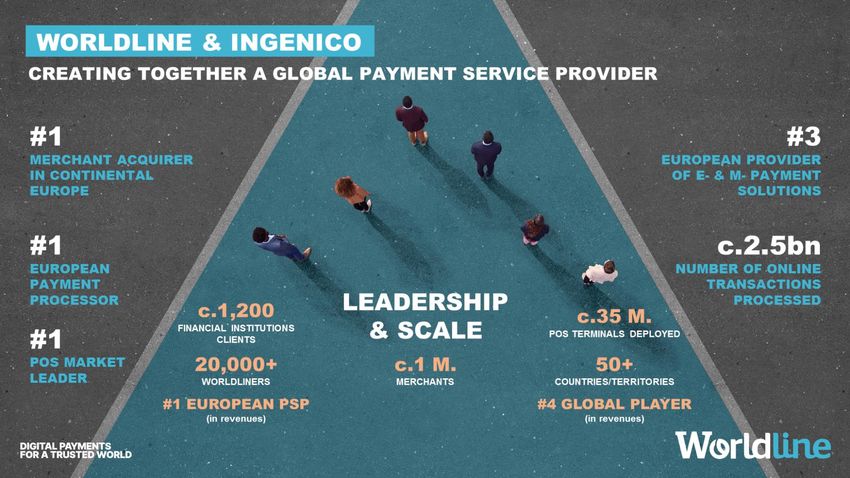
TABLE OF
CONTENTS
                             7
                                  Prepaid Payment

1
                                  Instruments:
    How Consumers’
                                  Page 9-10
    Payment Experience
    will Transform in Near

                             8
    Future: Page 1                Mobile Based

2
                                  Payments &
    Why Having a New
    Umbrella Entity for
                                  Internet Based
    Retail Payments is a          Payments:
    Good Idea: Page 2             Page 11

3                            9
                                  Unified Payments
     Digital Payments
                                  Interface:
     Landscape:
                                  Page 12
     Page 3

4                            10
     Merchant                     National
     Acquiring:                   Electronic Toll
     Page 4                       Collection:
                                  Page 13

5                            11
     Worldline                    Bharat BillPay:
     Insights:                    Page 14
     Page 5-6

6                            12
     Card Issuance                Aadhaar Enabled
     Page 7-8                     Payment Service:
                                  Page 15
HOW CONSUMERS’ PAYMENT EXPERIENCE
   WILL TRANSFORM IN NEAR FUTURE
Consumer spending pattern evolved significantly during the previous year across all demographics. The real
manifestation of cashless, paperless and seamless digital transactions is now led by mobile and internet based
payments, thus fueling the growth for digital commerce. Nevertheless, digital payments across physical
touchpoints have seen remarkable progress thanks to innovation and backing from the ecosystem. Retail
merchants are registering high demand to facilitate contactless payments as consumers now prefer the
convenience of making payments on-the-go via cards or mobile. The fact that RBI has raised contactless limit to
INR 5000 from INR 2000 is a testament that ecosystem is ready to widen its scope to empower plethora of new
merchant groups that can offer high-ticket size products to customers. Simultaneously, UPI and QR based
payments are on the rise while innovations around wearables, tokenisation, SoftPOS among others are gearing
up to address varied needs of customers as well as merchants.

As we continue to combat pandemic and live a new-normal life, we are certain that newer payment trends will
emerge to further enhance the growing payments landscape in years to come. Some of the key form factors that
will add value to the payment infrastructure in online space and transform the way we make payments today are
highlighted below.

Recurring payments: Keeping in view the changing payment needs, RBI had issued a framework for
processing of e-mandates on recurring online transactions for cards, wallets and UPI. Be it entertainment,
education, consumer durables or investments, consumers now prefer to automate their payments and bills by
enabling auto debits. Recurring payment delivers convenient and transparent experience to consumers for
paying their utility bills, subscriptions, mutual fund investments, insurance premium payment and host of other
services Recently, in order to prevent any inconvenience to the customers, Reserve Bank of India extended the
timeline for stakeholders to migrate processing of recurring online transactions with Additional Factor of
Authentication (AFA) till September 30, 2021. As majority of Indians are falling under the ambit of formal banking
system, they are able to leverage financial services and hence; enabling recurring payments across
demographics is becoming the need of the hour.

International e-commerce: While merchants are willing to take their products and services beyond national
boundaries and are eager to explore new markets to boost sales and revenue, consumers prefer to choose from
wide range of international products and make payment in local currencies. There is a huge scope to transform
customer experience in cross border payments and technology solution providers are optimising processes in
this arena to offer greater benefits to users.

Payment orchestration: With the rising payment methods at customers’ disposal, it has become essential for
merchants to provide multiple payment options while ensuring seamless UX. Payment orchestration plays a
crucial role to equip customers with new age payment methods and at the same time, helps merchants to
facilitate multiple payment methods under single platform. It helps both the parties by providing API integration
and enabling seamless checkout experience. In addition, value adds like aggregating and processing data to
provide real time analytics and reconciliation services addresses key pain points faced by merchants today.

At the end, consumers will benefit from innovation solutions that will be simple, seamless and secure and this
will drive a change in behaviours to using less cash and more digital.

Ramesh Narasimhan
Head – Digital Commerce, Worldline India

WHY HAVING A NEW UMBRELLA ENTITY
FOR RETAIL PAYMENTS IS A GOOD IDEA
In August 2020, the Reserve Bank of India (RBI) announced the framework for companies to apply to set
up a new umbrella entity (NUE) with the objective to “to set-up pan-India umbrella entity / entities
focussing on retail payment systems”. In the notification, the RBI outlined the scope of activities of the
NUE; it seeks to create a new network (like Visa, NPCI, MasterCard etc.) or something akin to that which
will run a payment network end-to-end which will include but not limited to ATMs, POS terminals, Aadhaar
payments, remittance services, new payment technologies.

The pre-cursor to this notification was a RBI policy statement in Jun 2018 which stated “with the maturing
of the retail payments market, it is important that the concentration risk in retail payment systems is
minimized from a financial stability perspective. The Reserve Bank plans to encourage more players to
participate in and promote pan-India payment platforms so as to give a fillip to innovation and competition
in the sector.” This was followed by a public consultation paper in January 2019 titled “Authorisation of
New Retail Payment Systems”.

The deadline to apply was extended from February 26 to March 31 and as of now 6 consortiums have
applied. They include most of the banks, several fintechs and companies such as Tata, Amazon, Google,
Jio among others.

The January 2019 paper specifically mentions NPCI having a high concentration of retail payment
electronic transactions (it was about 65% in volume in 2020) and apart from several advantages, one of
the disadvantages mentioned was ‘Systemic and operational risk’ where a “possibility of single point of
failure and also makes the entity too big to fail. Absence of redundancy and fall back arrangements may
impact continued availability.” Commentators have said that a NUE is being set up as competition to NPCI
but that is not the case; it is being set up with the express purpose of reducing concentration risk which is
necessary for a country like India where digital payments are increasing at a fast clip. The function of any
regulator globally is to reduce concentration risk in key sectors and that is precisely what the RBI is doing.

A NUE is also likely to spur payment innovations across the board that will benefit buyers, sellers, users,
institutions alike. A look at the companies participating shows that there are those with deep pockets and
those will a long-term horizon. Since this will be allowed to be a for-profit entity – NPCI is a not-for-profit –
companies will be incentivized to spend considerable sums of money on new innovations.

https://www.rbi.org.in/Scripts/NotificationUser.aspx?Id=11954&Mode=0
https://rbi.org.in/Scripts/BS_PressReleaseDisplay.aspx?prid=44126
https://rbi.org.in/scripts/PublicationReportDetails.aspx?UrlPage=&ID=918

 Sunil Rongala
 Vice President – Strategy, Innovation & Analytics
2020: A year in review

We have analysed transactions available in public databases as
well as transactions processed by us in 2020 (January –
December) and derived some unique insights.
DIGITAL PAYMENTS
                                                         VOLUME

LANDSCAPE                                                Credit Cards
                                                         Debit Cards
                                                                                               |||||||| 10%
                                                                                              ||||||||||||||||||||||| 23%
                                                         PPI                                  |||||||||||||||||||||||||| 26%
                                                         UPI P2M                              |||||||||||||||||||||||||||||||||||||||| 41%
In 2020, combined digital
payments volume and value                                VALUE
through Cards, PPI and UPI P2M*                          Credit Cards                         ||||||||||||||||||||||||||| 28%
was 18.86 billion and INR 21.89
                                                         Debit Cards                          ||||||||||||||||||||||||||||||||||||||||| 40%
trillion respectively.
                                                         PPI                                  ||||||||| 9%

Out of these four payment products,                      UPI P2M                              ||||||||||||||||||||||| 23%
UPI remained the most preferred
                                                 1000                Credit Cards volume                                  Debit Cards volume
payment mode among consumers
                                                  900                PPI volume                                           UPI P2M Volume
with a P2M market share volume of                 800
41% market share while its share of               700
the value of transactions was 23%.                600
                                                  500
As far as PPIs are concerned, the                 400
combined volume of prepaid cards                  300
                                                  200
and wallets covered 26% share in
                                                  100
volume and 9% in value.
                                                    0
                                                                                               May-…
                                                                   Feb-20

                                                                                                                                     Aug-20

                                                                                                                                              Sep-20

                                                                                                                                                                         Dec-20
                                                          Jan-20

                                                                                                            Jun-20

                                                                                                                        Jul-20
                                                                                     Apr-20

                                                                                                                                                                Nov-20
                                                                            Mar-20

                                                                                                                                                       Oct-20
What is evident though is that cards
still dominate payments. Credit and
Debit card transactions accounted               1200               Credit Cards Value                                Debit Cards Value
for a good chunk of the pie with 10%
                                                1000               PPI Value                                         UPI P2M Value
and 23% share in volume
respectively and in value terms, they            800
accounted for 28% for credit cards
                                                 600
and 40% for debit cards.
                                                 400

                                                 200

                                                   0

                                                       Source: RBI, NPCI
               UPI P2M transactions for Jan, Feb and March 2020 has been
            considered as 44.92 per cent of total UPI volume and 15.29 per
3               cent of total UPI value – replicating April 2020 percentages.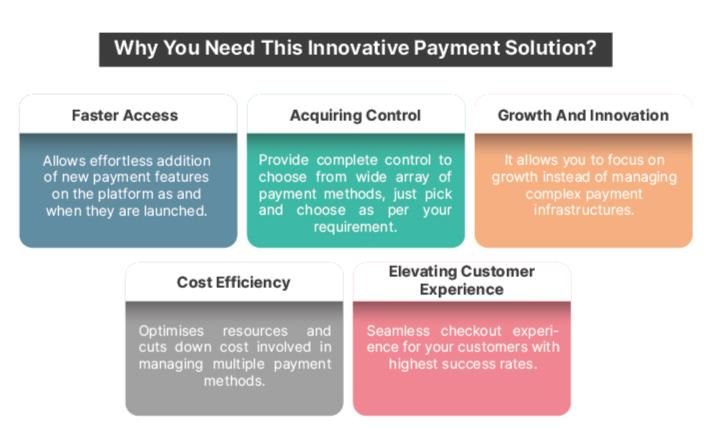
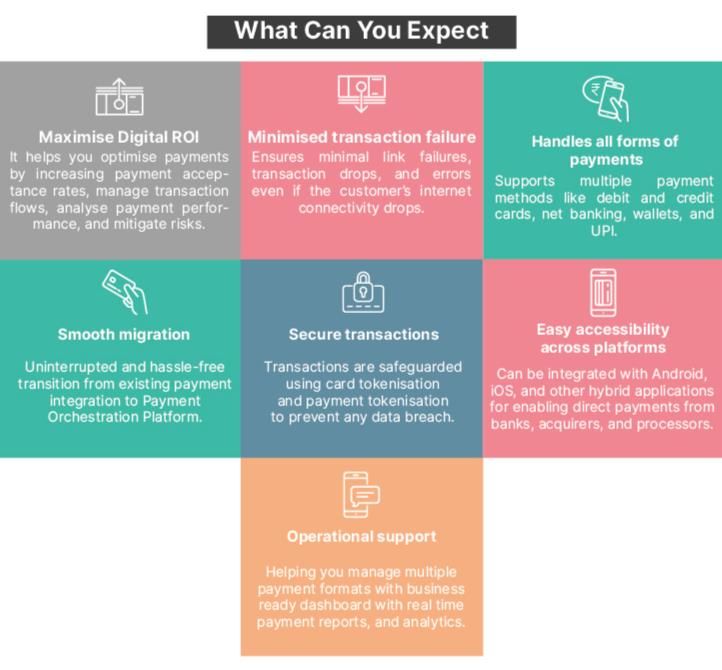
MERCHANT
ACQUIRING                                      6
                                                            POS Terminals (million)

                                             5.8
                                             5.6
Number of POS terminals deployed
                                             5.4
witnessed an all-time high figure of
                                             5.2
5.74 million in December 2020.
                                               5
Terminals deployed by merchant
acquiring banks increased from 4.98          4.8

million in December 2019 to 5.74 million     4.6

in December 2020, a 15% YoY increase.        4.4

Private sector banks represented
about 71 per cent of the POS terminal
market, up by 2% since Q3 2020 (Oct-                   1% 4% 0%
                                                                                 Public Sector Banks
Nov 2020) while public sector banks
accounted for 24%. Payments banks                                      24%       Private Sector
accounted for 4%market share and                                                 Banks
foreign banks remained constant at                                               Foreign Banks
1%.
                                                                                 Payment Banks

RBL Bank, HDFC Bank, State Bank of                    71%
                                                                                 Small Finance Banks
India, ICICI Bank and Axis bank are the
top 5 merchant acquiring banks to
deploy POS terminals in 2020.
                                                                                RATNAKAR BANK
In the merchant acquiring space                                                 LTD
innovations like SoftPOS is set to                                              HDFC BANK LTD
empower millions of small and micro                        22%
merchants. It has emerged as a low                                      31%     STATE BANK OF
                                                                                INDIA
acceptance solution that transforms a
                                                      9%                        ICICI BANK LTD
merchant mobile into a POS terminal
and enables them to accept multiple                    10%             15%
                                                                                AXIS BANK LTD
payment modes.                                                   13%

                                                                                OTHERS

 4                                      Source: RBI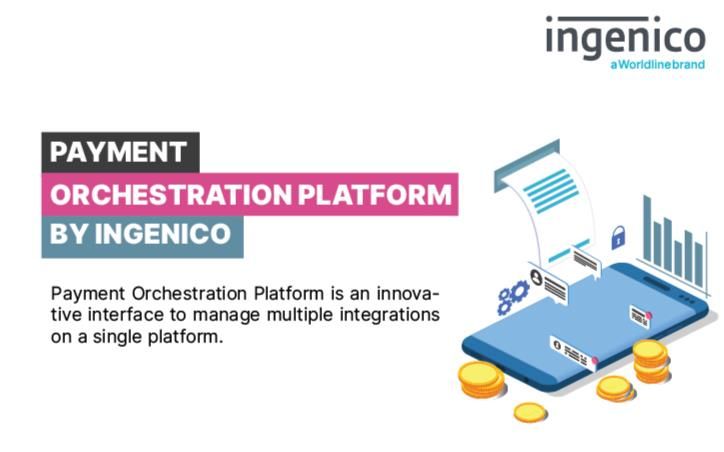
WORLDLINE
 INSIGHTS

Transactions processed at physical touch     Top 10 states with the highest
points such as grocery stores, fuel          transactions at physical touch points in
stations, clothing & apparel, pharmacies,    2020 for Worldline India:
restaurants and specialty retail together
accounted for 80% in volume and 60% in       Maharashtra, Karnataka, Tamil Nadu,
value.                                       Kerala, Andhra Pradesh, Delhi, Uttar
                                             Pradesh, Gujarat, West Bengal and
In the online space, financial services,     Telangana
government institutions and education
sector accounted for about 20% in
volume and 75% in value. Gaming,             Top 10 cities with the highest number
ecommerce (shopping for goods and            of transactions at physical touch points
services) and utility services contributed   in 2020 for Worldline India:
to about 80% in volume and over 20% in
value.                                       Bengaluru, Chennai, Mumbai, Hyderabad,
                                             Pune, Delhi, Coimbatore, Kolkata,
                                             Ernakulam and Ahmedabad

  5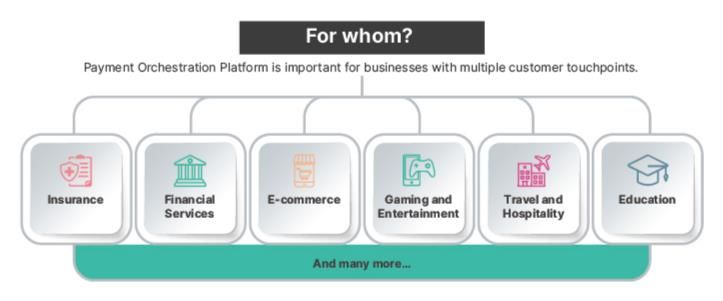
WORLDLINE
INSIGHTS

                                     States and cities with the highest
                                     number of transactions at physical
                                     touch points in 2020 for Worldline
                                     India

                         New
                         Delhi

                                             Kolkata
    Ahmedabad

        Mumbai
            Pune                                         TOP 10 CITIES
                         Hyderabad
                                                         1. BENGALURU
                                                         2. CHENNAI
                                       TOP 10 STATES     3. MUMBAI
                                                         4. HYDERABAD
                                      1. MAHARASHTRA
                                                         5. PUNE
                                      2. KARNATAKA
                                                         6. DELHI
            Bengaluru                 3. TAMILNADU
                                                         7. COIMBATORE
                                      4. KERALA
                        Chennai                          8. KOLKATA
                                      5. ANDHRA
                                                         9. ERNAKULAM
                                      PRADESH
                                                         10. AHMEDABAD
                   Coimbatore         6. DELHI
                                      7. UTTAR PRADESH
                 Ernakulam
                                      8. GUJARAT
                                      9. WEST BENGAL
                                      10. TELANGANA

6
CARD
ISSUANCE
No. of outstanding Cards
900 61
880 60
The total number of cards in circulation 59
860
stood at 946.81 million as of December 58
2020. 840
57
820
56
Outstanding credit cards increased by 9%
800
from 55.33 million in December 2019 to 55
No. of outstanding Debit Cards (million)
60.39 million in December 2020 while 780 54
No. of outstanding Credit Cards (million)
outstanding debit cards increased by 10% 760 53
from 805.32 million to 886.41 million during
the same period.
Out of the total cards in circulation, Transaction analysis of Credit Cards
debit cards accounted for 94% while
credit cards represented a 6% market Credit cards volume and value in 2020
share. stood at 1.79 billion and INR 6.13 trillion
respectively.
Interestingly, 15 banks account for 95% of
credit cards issued while 40 banks account The number of credit card transactions at
for 99% of debit cards issued. POS accounted for 901.95 million while
ecommerce was 891.52 million. In terms of
value, consumers transacted INR 2.86 trillion
at POS and INR 3.27 trillion at ecommerce
Credit Cards via credit cards in 2020.
Debit Cards
6%
94%
7 Source: RBICARD
Debit Cards Volume at POS (million)
300
Debit Cards Volume at E-commerce and Others
250 (million)
200
ISSUANCE 150
100
50
0
140
Credit Cards Volume at POS (million)
120
Credit Cards Volume at E-commerce and
100 Others (million)
80
Debit Cards Value at POS (INR billion)
60 700
40 Debit Cards Value at E-commerce and
600 Others (INR billion)
20
500
0
400
300
400 200
350
100
300
0
250
Apr-20
May-20
Oct-20
Dec-20
Jan-20
Mar-20
Aug-20
Jun-20
Jul-20
Nov-20
Feb-20
Sep-20
200
150 Credit Cards Value at POS (INR
billion)
100
Credit Cards Value at E-
Even though credit cards volume at POS and
50 commerce and Others (INR ecommerce are nearly equal, value of
billion)
0 ecommerce transactions is 15% higher as
compared with value of transactions at POS.
Similarly, debit card transactions value on e-
Transaction analysis of Debit cards commerce was 47% higher than its
transactions value at POS. This reflects a
In 2020, debit card transactions volume larger movement seen in the previous year
and value stood at 4.31 billion and INR from physical to the virtual.
8.91 trillion respectively.
As of December 2020, Average Ticket Size of
Out of the total debit card volume, credit cards was INR 3653 and Average Ticket
transactions at POS were 2.14 billion and Size of debit cards was INR 2568.
ecommerce were 2.18 billion. In terms of
value, INR 3.61 trillion was processed at
POS terminals while INR 5.30 trillion was
processed at e-commerce via debit cards.
8 Source: RBIPREPAID PAYMENT
INSTRUMENTS
As of December 2020, there were 2.08 Prepaid Cards Volume at POS (million)
140
billion prepaid payment instruments in
120 Prepaid Cards Volume through Online
the country. Of this 2.08 billion, 166.41 and Others (million)
million comprised of prepaid cards and 100
1.91 billion were mobile wallets. During 80
2020, there was a 67% increase in the
60
number of prepaid cards while number of
40
wallets increased by 16%.
20
Analysis of Prepaid Cards transactions 0
Apr-20
May-20
Oct-20
Dec-20
Jan-20
Mar-20
Aug-20
Feb-20
Jun-20
Jul-20
Nov-20
Sep-20
In 2020, total prepaid cards transactions
volume and value was 1.01 billion and
INR 356.85 billion respectively. Its
transactions at POS accounted for 64.45 40 Prepaid Cards Value at POS (INR billion)
million while transactions through 35 Prepaid Cards Value through Online and
ecommerce were 944.37 million. 30 Others (INR billion)
25
In terms of value, prepaid cards at POS
processed transactions were worth INR 20
103.54 billion while INR 253.31 billion was 15
processed through ecommerce. Total 10
spends through PPI instruments increased 5
by 65% during the year 2020.
0
Jun-20
Dec-20
Mar-20
Apr-20
May-20
Sep-20
Oct-20
Jan-20
Aug-20
Feb-20
Jul-20
Nov-20
9 Source: RBIPREPAID PAYMENT
INSTRUMENTS
Transaction analysis of Mobile Wallets
m-Wallet Volume (million)
450
In 2020, transactions through mobile
400
wallets were 3.95 billion and its value
350
was accounted for INR 1.53 trillion. 300
Mobile wallets witnessed negative growth 250
of 8% in volume and 16% in value. It is 200
possible that UPI growth has eaten into 150
this. 100
50
0
Apr-20
May-20
Dec-20
Jan-20
Mar-20
Aug-20
Jun-20
Oct-20
Jul-20
Nov-20
Feb-20
Sep-20
m-Wallet Value (INR billion)
180
160
140
120
100
80
60
40
20
0
Mar-20
Dec-20
Apr-20
May-20
Jan-20
Jun-20
Oct-20
Aug-20
Nov-20
Feb-20
Jul-20
Sep-20
10 Source: RBIMOBILE BASED PAYMENTS &
INTERNET BASED PAYMENTS
In 2020, consumers made 21.44 billion
mobile based payments whereas Net 3000
Banking / Internet browser based
transactions were over 3.12 billion. In 2500
terms of value, INR 75.41 trillion was 2000
transacted through mobile while INR
378.59 trillion was transacted through 1500
the internet.
1000 Mobile Payments Volume (million)
Mobile payments Internet Payments Volume (million)
In 2020, Mobile based transactions 500
recorded a volume of 21.44 billion and 0
INR 75.41 trillion in value.
Mobile payments volume increased by 75%
while its value increased by 73%. Out of
the total mobile based payments volume, 45000
1.93 billion were intra-bank transactions and 40000
19.51 billion were inter-bank transactions. In
35000
terms of value, mobile payments registered
30000
intra-bank transactions of INR 15.26 trillion
while inter-bank value was INR 60.15 25000
trillion. 20000
Mobile Payments Value (INR billion)
Internet Payments 15000
Internet Payments Value (INR billion)
In 2020, Internet based transactions 10000
recorded volume of 3.12 billion and INR 5000
378.59 trillion in value. 0
Internet based payments volume and value
Apr-20
Dec-20
Mar-20
May-20
Aug-20
Jan-20
Jun-20
Oct-20
Nov-20
Feb-20
Jul-20
Sep-20
registered an uptick of 14% and 28%
respectively. Out of total internet based
payments volume, 680.95 million were intra-
bank transactions and 2.44 billion were inter-
bank transactions. In terms of value, internet
payments accounted for INR 185.35 trillion
intra-bank transactions and INR 193.23
trillion inter-bank transactions.
11 Source: RBIUNIFIED PAYMENTS
INTERFACE
UPI Volume (million)
2500
2000
1500
By December 2020, 57% of UPI 1000
transactions were P2P (Person-to-
500
Person) while 43% were P2M (Person-
to-Merchant). 0
50
45
40 UPI Value (INR billion)
35 4500
30 UPI P2M Volume % 4000
25
UPI P2M Value % 3500
20
3000
15
10 2500
5 2000
0 1500
1000
500
0
Overall, UPI continued to grow as one
of the most preferred mode of
payments in 2020 by recording 18.88 Immediate Payment Service (IMPS)
billion transactions in volume and INR IMPS recorded transactions volume of 2.97
33.87 trillion in value. billion and value of INR 26.83 trillion in 2020.
64 banks joined the UPI ecosystem in 61 banks joined the IMPS ecosystem in 2020
2020 bringing the total number of banks bringing the total number of banks providing
providing UPI services to 207 as of IMPS services to 620 as of December 2020.
December 2020. NPCI’s BHIM App was IMPS continued to grow in 2020 even after RBI
live for customers of 165 banks by the decided to make National Electronic Funds
end of 2020. Transfer (NEFT) system available on all days of
the year, including holidays. Further, on
December 14, 2020, RBI decided to make
RTGS available round the clock on all days of
the year. IMPS completed 10 years of its
existence in November 2020.
UPI P2M transactions for Jan, Feb and March 2020 has been considered as 44.92 per cent
of total UPI volume and 15.29 per cent of total UPI value – replicating April 2020
12 Source: NPCI percentages.NATIONAL ELECTRONIC
TOLL COLLECTION
In 2020, NETC processed about 1.11 Currently the program is live on 720+
billion transactions worth INR 169.06 toll plazas across the country. NPCI is
billion. Its transactions volume jumped enhancing NETC enabled use cases
201% while value increased by 143% as like contactless and interoperable
compared with previous year. parking solution in major cities like
Bengaluru, Delhi, Chennai, Hyderabad
As of December 2020, 28 banks were live and Mumbai.
on the NETC program and about 22.95
million FASTags have been issued since FASTag has been made mandatory for
its inception. four-wheelers from January 1, 2021.
Moreover, FASTag has been made
mandatory for new third party
NETC Volume (million)
insurance with effect from April 2021
160
and the renewal of fitness certificate
140
will be done only after the fitment of
120
100
FASTag for transport vehicles.
80
60
40
20
0
May-20
Apr-20
Dec-20
Mar-20
Aug-20
Oct-20
Jan-20
Jun-20
Nov-20
Feb-20
Jul-20
Sep-20
NETC Value (INR billion)
25
20
15
10
5
0
Apr-20
May-20
Oct-20
Jan-20
Mar-20
Dec-20
Aug-20
Feb-20
Jun-20
Jul-20
Sep-20
Nov-20
13 Source: NPCIBHARAT
BILLPAY
The transactions volume passing By the end of 2020, 19,316 billers were
through Bharat Bill Payment Central live with Bharat BillPay comprising of
Unit (BBPCU) in 2020 stood at 230.94 major recurring payment categories like
million while its value was INR 353.82 Loan repayments, Insurance, Education,
billion. It registered an increase of 84% Housing societies, FASTag recharge, TV
in volume and 89% in value as cable subscription, Hospitals among
compared with the previous year. others.
Bharat BillPay Volume (million)
30
25
20
15
10
5
0
Apr-20
May-20
Dec-20
Jan-20
Mar-20
Aug-20
Jun-20
Oct-20
Jul-20
Nov-20
Feb-20
Sep-20
Bharat BillPay Value (INR billion)
45
40
35
30
25
20
15
10
5
0
Apr-20
May-20
Oct-20
Dec-20
Jan-20
Mar-20
Aug-20
Feb-20
Jun-20
Jul-20
Sep-20
Nov-20
14 Source: NPCIAADHAAR ENABLED
PAYMENT SERVICE
AePS transactions (ONUS, OFFUS, AEPS has facilitated the government’s
DEMO AUTH & eKYC) in 2020 recorded Direct Benefit Transfers to beneficiaries
a substantial volume of over 3.52 billion during the year and several banks have
transactions and processed provided banking services at customers’
transactions worth INR 1.96 trillion. It doorstep through Banking
registered an increase of 49% in volume Correspondents.
and 85% in value over 2019.
AePS Volume (million)
450
400
350
300
250
200
150
100
50
0
Apr-20
Dec-20
May-20
Oct-20
Jan-20
Mar-20
Jun-20
Aug-20
Feb-20
Jul-20
Sep-20
Nov-20
AePS Value (INR billion)
250
200
150
100
50
0
Apr-20
May-20
Oct-20
Dec-20
Jan-20
Mar-20
Jul-20
Aug-20
Feb-20
Jun-20
Sep-20
Nov-20
15 Source: NPCISoftPOS
A mobile first, mobile only acceptance solution that transforms a
merchant’s smartphone into a POS terminal.
Worldline presents an asset-less acceptance
solution with a 360 degree coverage of
payment modes for in-person and remote
payments acceptance. It is a low cost solution
with a specific focus on merchants in Tier II
and below cities.
TAP ON PHONE
An industry first capability of allowing
contactless payments acceptance on an
NFC enabled Android mobile device.
Fully compliant with existing regulatory
restrictions of accepting contactless
payments without AFA up to INR 2,000
Currently certified with individual
schemes under the scheme specific pilot
program guidelines.
Upgrade to a PCI CPoC certified
solution is in the roadmap.
FEATURES
DIY on-boarding experience: Integrated with real time KYC validation and
seamless digital on-boarding
Khata: Record customer level credit ledgers and send reminders for
collections with built in payment links for a seamless collection experience.
Cash Register: It can record cash transactions making it convenient for the
merchant to keep a record of all collections.
Online Dukaan: Create a virtual store front and catalogue your inventory for
customers to make online purchases.
Acceptance Coverage: Accept payments using contactless cards, Bharat QR,
UPI and payment links sent over SMS/E-mail.ABOUT WORLDLINE
Worldline [Euronext: WLN] is the European leader in the payments and transactional services
industry and #4 player worldwide. With its global reach and its commitment to innovation,
Worldline is the technology partner of choice for merchants, banks and third-party acquirers as
well as public transport operators, government agencies and industrial companies in all sectors.
Powered by over 20,000 employees in more than 50 countries, Worldline provides its clients with
sustainable, trusted and secure solutions across the payment value chain, fostering their
business growth wherever they are.
Worldline India (WI) is wholly owned by Worldline SA, is a transactions facilitator in all
spectrums of the digital payments ecosystem and provides the highest available level of
products, services and solutions that are fully compliant with PCI and RBI guidelines. The main
areas of business in the digital payments ecosystem it is involved in are merchant acquiring,
card issuance, FASTag issuance and acquiring, loyalty solutions, private label card management
service, bill payments platforms, recurring payments platforms and cloud platforms, payment
gateway and payment aggregator services, risk mitigation, Value-added services among others.
Worldline India is constantly investing in the latest technologies to increase efficiencies, drive
innovation and deliver customer delight. It is the payment partner of choice for merchants,
banks, government agencies and industrial companies, delivering best-in-class digital
transaction services.
In 2020, Worldline generated a proforma revenue of 4.8 billion euros. worldline.com
@WorldlineIndia Worldline IndiaThis report has been prepared by Sunil Rongala Vice President Strategy, Innovation & Analytics Jackulin Sheela Manager Strategy & Corporate Affairs Manish Kohli Manager Marketing & Communications
You can also read