India's gold market: evolution and innovation - ValueWalk
←
→
Page content transcription
If your browser does not render page correctly, please read the page content below
India’s gold market:
evolution and innovation
About the World Gold Council
The World Gold Council is the market development
organisation for the gold industry. Our purpose is to
stimulate and sustain demand for gold, provide industry
leadership, and be the global authority on the gold market.

We develop gold-backed solutions, services and products,
based on authoritative market insight and we work with a
range of partners to put our ideas into action. As a result,
we create structural shifts in demand for gold across key
market sectors. We provide insights into the international
gold markets, helping people to understand the wealth
preservation qualities of gold and its role in meeting the
social and environmental needs of society.

Based in the UK, with operations in India, the Far East
and the US, the World Gold Council is an association
whose members comprise the world’s leading gold
mining companies.

For more information
Please contact:

World Gold Council
B-6/3, 6th Floor, Laxmi Towers
C-25 Bandra Kurla Complex
Bandra (East), Mumbai 400051, India
E: info@gold.org
T: +91 22 6157 9100
F: +91 22 6157 9199

Alistair Hewitt
Director, Market Intelligence
E: alistair.hewitt@gold.org
T: +44 20 7826 4741

Krishan Gopaul
Market Intelligence
E: krishan.gopaul@gold.org
T: +44 20 7826 4704

Louise Street
Market Intelligence
E: louise.street@gold.org
T: +44 20 7826 4765

Mukesh Kumar
Market Intelligence Group
E: mukesh.kumar@gold.org
T: +91 22 6157 9131

India’s gold market: evolution and innovation
Contents
Introduction02                                           7:		 Bullion trade 		                                  55
                                                          		Wholesale imports and importers                      55
Overview04                                               		Official import trends 		                            57
		Income growth drives gold demand                  04     		 Focus Box: Gold pricing in India                  58
		Consumer demand is evolving                       05   		Smuggling 		                                         60
		The gold industry is changing                     06   		Outlook 		                                           60
		India has a long history of gold-focused policies 07
                                                          8:		 Gold refining and recycling		                     61
1:		 The drivers of Indian gold demand         08        		India’s gold refining landscape 		                   61
		Understanding what drives Indian gold demand 08        		Recycling trends 		                                  64
		India’s demographics                         10        		Outlook 		                                           67
		Income levels and savings                    13
		Import restrictions and taxes                14        9:		 Gold mining 		                                    68
		Inflation16                                            		Gold mining history 		                               68
		Agricultural production and monsoons         16        		India gold mineral reserves and resources            70
		Outlook17                                              		Future of gold mining in India 		                    71
                                                          		Economic impact of gold mining 		                    72
2:		 Jewellery demand                  18
      Types of jewellery                21               10: Gold policies 		                                   73
    	Understanding regional, income and                  		A brief history of gold policies 		                  73
      demographic differences           22               		Recent developments 		                               75
      		 Focus Box: The changing role of                  			  Focus Box: India’s latest effort to crack down
         non-resident Indians	          24                     on black money will have a big impact on
		Outlook27                                                    gold demand                                     78

3:		 Jewellery market structure    28                    Appendix 1: Methodology                               79
		Retail market structure          28                    		 Field research                                     79
			 Focus Box: The rise of Tanishq 31                    		Econometric analysis                                79
		Manufacturing market structure   32                    		Consumer insights                                   79
		Hallmarking34                                          		Market research                                     79
		Outlook35                                              		Gold demand data                                    79

4:		 International jewellery trade     37                Appendix 2: Indian gold demand:
		Jewellery exports and imports        37                an econometric analysis		                              80
		Developing India’s jewellery exports 40                   What drives Indian gold demand?
		Outlook42                                              		 An econometric approach		                           80
                                                          		Modelling the long- and short-term
5:		 Gold investment market		              43                dynamics of the Indian gold market                  81
		Bar and coin demand		                    43
		Understanding investor motives		         46             Appendix 3: India’s above ground stocks 86
		Gold investment retailing		              46               Methodology		86
			 Focus Box: India’s commodity exchanges 49             		India’s gold holdings		               86
		Outlook50

6:		 Gold in the financial system		                 51
		Gold monetisation 		                              51
		Gold loans 		                                     52
		Outlook 		                                        54

India’s gold market: evolution and innovation                                                                    01
Introduction

India is a wonderful country. It is diverse and dynamic.       On top of that, India’s gold market has been subject to
With over 500 million people under the age of 25 it is one     huge policy changes over recent years. Sometimes this
of the youngest countries in the world. Yet, at the same       targets the gold industry, such as the market-distorting
time, India has a long and rich cultural heritage, with many   80:20 rule for gold imports in 2013 and 2014. But
gods, deities and beliefs intertwined with the Indian way      sometimes it is an economy-wide initiative, such as the
of life.                                                       forthcoming Goods and Services Tax or 2016’s radical
                                                               high value currency exchange (or ‘demonetisation’)
Gold is part of this way of life. Hundreds of millions of      programme. While recent new policies initiatives have
people across India – from large, modern cities through to     been numerous and varied, they share the same objective:
small rural villages – buy gold for themselves or loved ones   to move India’s informal cash economy towards greater
throughout the year. Akshaya Tritiya, Diwali, harvests,        transparency and into the digital age.
weddings; gold is central to every one of these. Perhaps
its little wonder India has a huge affinity for the global     A challenge facing India’s gold industry is that part of it
currency, given its long history as a trading nation.          operates in the grey market. This minority has benefited
                                                               from anonymity and a lack of transparency on price, purity,
But India is changing. Millions migrate from villages to       taxes and supply sources. As India’s economy presses
cities every year. Agriculture’s relative importance has       ahead with its transition to transparency, its gold industry
declined. Per capita income has increased and millions         must shed this image and integrate into the mainstream
have been lifted out of poverty. Mobile phones have            financial system, for gold to serve as a legitimate asset
spread rapidly across the country; with over 220 million       class for millions and play a dynamic economic role.
users, India is the world’s second largest smartphone
market. Millennials think about the world differently to       It is clear that India’s gold industry is important to its
their forefathers. These changes have implications for         policymakers. But effective policy needs good data and
gold demand.                                                   insight as its foundation. This report aims to provide that,
                                                               by explaining how India’s gold market works across the
                                                               entire supply chain – from imports and recycling through
                                                               to consumer demand – and how it is likely to evolve in
                                                               the coming years. It also provides an overview of existing
                                                               gold-related policies and how they have evolved over
                                                               recent years.

India’s gold market: evolution and innovation                                                                             02
Key insights                                                     • India’s gold industry is becoming more organised:
                                                                    While it is still highly fragmented, the industry is
• Economic growth drives gold demand: India was one                becoming more organised. Retailers with large regional
   of the world’s fastest growing economy in 2016. This is          and national chains are gaining market share. These
   key to the health of the gold market. Our econometric            firms have sophisticated inventory management, well-
   analysis of the drivers of Indian gold demand reveals            crafted advertising campaigns and will be important in
   income growth is the most significant factor: as India           ensuring gold meets the needs of modern consumers.
   becomes richer, gold demand increases.
                                                                 At the World Gold Council, we want to support the
• Urbanisation will change the shape of consumer                development of India’s gold industry by working with
   demand: Rural and urban India can be thought of as            India’s policymakers to help ensure gold becomes
   two distinct markets. Rural India prefers to invest in gold   mainstream, and that its positive role in household
   jewellery, while urban India has a greater preference for     finance is better appreciated. Currently, policy
   bars and coins. Rural-to-urban migration will change the      discussions tend to focus overwhelmingly on import
   shape of consumer demand.                                     controls, thereby under-leveraging the strengths of a gold
                                                                 culture that is widely prevalent. Policies to enable gold
• India has a young population with a strong affinity
                                                                 to operate freely in a transparent manner, as part of the
   with gold: India has over 45% under the age of 25.
                                                                 organised financial system, are important to realise the
   And young people think about the world differently
                                                                 broader social and economic objectives. We hope this
   from previous generation. But our large-scale consumer
                                                                 report provides the data and insight from which effective
   research indicates that they do have a strong affinity
                                                                 policies can be developed.
   with gold: when we asked the question what you would
   buy if you were given Rs50,000, a third of respondents
   aged between 18–33 said they would invest in gold.

                                                                 Somasundaram PR
                                                                 Managing Director, India
                                                                 World Gold Council

India’s gold market: evolution and innovation                                                                             03
Overview

In 2015 India was the world’s fast growing economy; in recent
years millions have been lifted out of poverty and India’s
middle class has swelled. This is important because our
econometric analysis indicates income growth drives gold
demand. But India’s relationship with gold goes beyond income
growth: gold is intertwined with India’s way of life. And as we
look ahead, India’s gold market will evolve.

Income growth drives gold demand                                                  This is important because India’s economic growth has
                                                                                  underpinned its gold market. Our econometric analysis of
India’s middle class, consisting of some 200mn to 250mn                           data from 1990 to 2015 revealed that income levels are
people, is now one of the world’s largest. The India-based                        the most significant long-term determinant of consumer
National Council of Applied Economic Research expects                             gold demand: holding all else equal, a 1% rise in income
this number will exceed 500mn by 2025, while the                                  boosts gold demand by 1%. Of course, other factors play
US-based Brookings Institution reckons India’s middle                             a role too. Rising prices, taxes and other barriers can put
class consumption will be ahead of the US and China                               consumers off, while a good monsoon can boost demand.
by 2030 (Chart 1).                                                                But income is the dominant macro-economic factor
                                                                                  supporting India’s gold market.

Chart 1: By 2030 India will dominate global middle class consumption
Share (%)
25
                                                                                  By 2030 India will have the largest middle class in
                                                                                the world – this rising wealth will boost gold demand
20

15

10

 5

 0
                           2009                                                2020                                         2030
      United States        Japan        Germany         China        India
Note: Y-axis represents percentage share of global middle class consumption.
Source: The Brookings Institution

India’s gold market: evolution and innovation                                                                                              04
Consumer demand is evolving                                        affinity with gold, this is amplified among the rural
                                                                   population; levels of jewellery ownership for example, are
Econometric analysis, while helpful, can only tell you so          significantly higher (Chart 2).
much. India’s relationship with gold is much richer, deeper
and more complex than mere macroeconomic variables.                And the type of jewellery rural consumers buy is subtly
                                                                   different to that bought by their urban counterparts. Rural
For large swathes of the population, gold is intertwined           Indians have a strong preference for plain gold jewellery,
with their way of life. It is deeply rooted in Indian culture:     while gold set with precious/semi-precious stones is
gold purchases are driven by tradition, festivals and              more popular in urban areas. In 2015, plain gold jewellery
other important family and societal occasions. Our 2016            accounted for 88% of purchases in rural India. In urban
consumer research conducted by TNS identified the top              India the figure was 57%, with gem-set pieces accounting
three gold purchase occasions in India to be weddings              for 35% of gold jewellery bought. The investment
(24%), birthdays (15%) and religious festivals (12%).              markets are also different: 22k jewellery is largely used
Agriculture also plays a significant role in gold demand.          for investment in rural India, while in urban India bars and
Although it only contributes 17% to Indian GDP, it is              coins are the preferred gold investment vehicle.
integral to the rural economy, which accounts for over
two-thirds of the population. Finally, there is religion. Gold     There are demographic differences, too. While rural
is seen as a symbol of wealth and prosperity in the Hindu          India’s affinity with gold is strong across all ages, it is
religion. Given all of this, it should come as no surprise that    slightly weaker in urban India for younger generations.
72% of survey respondents said that they owned fine gold           If given Rs50,000 to spend, 33% of those aged between
jewellery, 55% had bought gold in the past 12 months,              18 and 33 would buy fine gold jewellery, compared with
and 51% said they would buy gold jewellery in the next             42% of those aged 34 and over. The fact that a third of
twelve months.                                                     young urban Indians are inclined to buy gold jewellery is
                                                                   undoubtedly good; it represents a far stronger market than
In a country as large and diverse as India, there are              many other countries. But for some young urban dwellers
inevitably variations. The most notable difference to              gold is competing with designer and luxury fashion, and
emerge in the consumer research is that between rural              the ubiquitous smartphone.
and urban India. While the whole of India has a strong

Chart 2: Gold ownership is higher in rural India and rises with income levels
%
100
                                                                                                             93
 90

 80
                           74                                                                                80
                                                                  76
 70

 60
                                                                  60
 50
                           49                                                         International comparison
 40                                                                                      of ownership levels
                                                                                             India – 72%
 30
                                                                                            China – 70%
 20                                                                                            US – 59%
 10

  0
                      Rs40-99,999                           Rs100-399,999                               Rs400,000+
                                                                                                                     Annual income
        Rural ownership           Urban ownership

Source: TNS; World Gold Council

India’s gold market: evolution and innovation                                                                                   05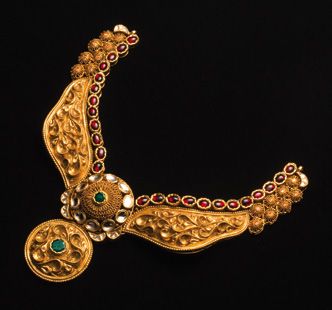
So what does the future hold for India’s consumer                               for example. But if the industry tackles these challenges,
demand? There are risks. For example, millennials in                            innovatively thinks of how best to communicate with the
urban India are increasingly tempted by goods other                             consumers and develops seamless purchase journeys,
than gold, particularly luxury fashion and smartphones.                         some of this latent demand could certainly be realised.
But this risk is firmly at the margin: young Indians still buy
gold. And retailers are alert to their needs, developing
                                                                                The gold industry is changing
online strategies to engage with them, as illustrated
by Titan Industries’ acquisition of a majority stake in                         As India changes, so too does its gold industry. In 2000,
CaratLane, which will allow the company to enhance its                          around 90% of India’s gold retailers were “unorganised.”
e-commerce capabilities.                                                        The industry was dominated by small, standalone
                                                                                retailers, often family jewellers, with limited marketing
Given India’s growth trajectory, per capita income will
                                                                                and advertising. Today, unorganised retailers still dominate
continue to rise, millions more will be lifted out of poverty
                                                                                the market, but organised retailers have taken greater
and its middle class will continue to grow. This will
                                                                                market share. In 2015, national chains – including Tanishq
underpin growth in consumer demand.
                                                                                and Malabar Gold and Diamonds – accounted for around
An exciting area of potential growth is in the bar and coin                     7% of the market, while regional chains accounted for
market. Our consumer research indicates that there is                           around 23%. These organised retailers have introduced
large, unmet investment demand. In the absence of any                           sophisticated advertising and sales campaigns, effective
barriers, Indian consumers would invest more in bars and                        inventory management systems and domestic and
coins, jewellery, and other gold-backed financial products,                     international brands, and have raised standards within the
as illustrated by gold’s share of mind outstripping actual                      industry. Momentum is with them and they will continue
gold investments in 2015 (Chart 3).1                                            to gain market share. By 2020, the organised share of the
                                                                                market will have risen to 35%–40%.
This is not to say that all of the latent demand can be
converted into sales. There are barriers to purchase
around price perception and online retailing platforms,

Chart 3: There is strong latent demand for gold investments

                                                                                                                 26      +5%
Rural
                                                                                                                            31

                                                                                                23                       +8%
Urban
                                                                                                                            31

                                                                                                       25                +6%
 Total
                                                                                                                            31

         0                    5                 10                  15                  20                  25            30                   35
                                                                                                                                               %
             Share of investment   Share of mind        Latent demand

Source: TNS; World Gold Council

1 For more information on latent demand and share of mind, please see the Appendix.

India’s gold market: evolution and innovation                                                                                                06
This change is reflected in the manufacturing sector                India has a long history of gold-focused
too. At present 5%–10% of India’s gold manufacturing                policies
sector could be deemed as being “organised” large-
scale facilities; 10 years ago these would have barely              Government policies extend far beyond India’s refining
existed. Nearly 65% of jewellery manufactured in India              sector. India has a long-standing affinity with gold, but
is handmade and the vast majority of the sector is                  gold-policy measures have often been muddled. They
still characterised by small workshops, each typically              usually distort the market without achieving the policies’
employing two to four goldsmiths. But the direction                 aims. For example, the 80:20 rule, which required
of travel is clearly towards the sector becoming more               importers of gold to re-export 20% of imports as gold
organised. International buyers, for example, have strict           jewellery, was unwieldy and confusing. The market
procurement policies that rule out many of the smaller              clammed up. The local price rocketed to a premium
workshops. And the orders from overseas and domestic                of more than US$100 over the global spot price and
organised retailers are often large; manufacturers need to          smuggling boomed. Rather than controlling the flow
be a certain size to be able to process these orders.               of gold into India, the policy drove gold into the black
                                                                    market (Chart 4).
The most significant change has been in India’s refining
capacity. India’s long-established refining sector has seen         But some recent developments suggest the policy
a sharp rise in new capacity in recent years. The organised         approach is getting better: the Indian Gold Coin and
refining landscape has grown sharply from a mere three              proposed hallmarking regulations will develop a trusted
to four refineries in 2013 to 30 refineries in 2015, including      standard of gold that can be traded more easily. This
one which is LBMA-accredited – MMTC-PAMP. India’s                   matters because 86% of consumers say that hallmarking
total refining capacity is now above 1,450 tonnes (t),              is extremely or very important.
significantly more than India’s average annual gold imports
over the past five years.                                           These policies also support the Government’s gold
                                                                    monetisation scheme. This scheme is designed to draw
The expansion of the organised refining sector has been             some of India’s 23,000–24,000t stock of gold into the
supported by a favourable government stance, including              financial system. This may provide a boost to the jewellery
a bullion/doré import duty differential. But much of the            sector by making gold loans easier to access from banks.
additional capacity remains under-utilised, largely because
of the difficulty in sourcing doré and the limited availability
of recycled material. More recently, the government’s
favourable stance has weakened a little, with a new tax
regime squeezing refiners’ margins.

Chart 4: Smuggling increased in response to taxes and trade barriers
Tonnes
250

200
                                                                                  The 1% manufacturing excise
               Smuggling rose in 2013 in response to increasing                  duty encouraged an increase in
                      import duties and the 80:20 rule                                 smuggling in 2016
150

100

 50

  0
                 2012                           2013              2014                    2015                    2016(F)
Source: Metals Focus; World Gold Council

India’s gold market: evolution and innovation                                                                                    07
1: The drivers of Indian gold demand
Two significant factors influence Indian gold demand over
the long-run: rising incomes have a positive effect and higher
gold prices have a negative effect. Income is the most powerful
factor, and income levels are expected to rise. The IMF has
forecast per capita GDP to grow by 35% for 2015–2020,2 and
the National Council of Applied Economic Research expects
India’s middle class to double, exceeding 500mn by 2025.
There are some interesting short-run dynamics too: gold
demand is spurred on by inflation, rises with a good monsoon,
and is dampened by higher import taxes and other restrictive
measures. By 2020 we expect Indian gold demand to average
850t to 950t per annum.
Understanding what drives Indian Long-run drivers of gold demand
Our analysis, using annual data from 1990 to 2015,4
gold demand
reveals two significant factors affecting gold consumer
Gold demand is driven by a combination of factors demand – jewellery, and bar and coin combined – over the
that interact with each other. These factors are often long-term. All else being equal, gold demand is driven by:
described qualitatively, but taking a quantitative approach
• Income: gold demand rises with income levels.
can complement common wisdom and deliver additional
For a 1% increase in income per capita gold demand
insights. As such, we undertook an econometric analysis
rises by 1%
to understand gold’s demand behaviour.
• Gold price level: 5 higher prices deter gold purchases.
Of course, an econometric analysis helps identify some For a 1% increase in prices, gold demand falls by 0.5%.
of the most salient drivers of demand, but not all. In a
country as diverse as India, other factors not captured This is intuitive. One would expect gold demand to rise
by simple econometric analysis play an important role in with income and fall with price. But it also highlights
shaping gold demand. the respective strength of these two forces. Demand
responds more to income than it does to price. This helps
In this chapter we discuss the findings of our econometric explain why gold demand increased from around 700t in
analysis of the long- and short-run determinants of 2000 to around 1,000t in 2010, despite a dramatic increase
gold demand.3 We also delve into aspects of Indian in the gold price over the period. The impact of the 137%
demographics and economic development that may increase in the rupee gold price was outweighed by the
help us understand not only gold demand today, but 78% increase in per capita income.6
also its prospects for the future.
2 IMF World Economic Outlook. April 2016. Forecast in constant prices.
3 For more detail, please see Appendix.
4 Prior to the 1990s, government regulation made gold imports illegal. This changed in 1992, resulting in a structural change in the gold market dynamics.
We concentrate on the period starting in the 1990s for three reasons: 1) to have consistent models across the various demand categories; 2) to avoid
difficulties modelling the structural shift; and 3) because econometric models using series for which the pre-1990s data is available and seemingly reliable
(e.g jewellery) delivered results consistent with those using only post-1990 data.
5 Gold price level refers to the absolute gold price, rather than changes in that price.
6 IMF WEO.
India’s gold market: evolution and innovation 08Factors affecting Indian gold demand
Long-term factors
1.5
Rising incomes have a positive effect on Indian gold demand and
higher gold prices have a negative effect
Gold demand and household income Gold demand and gold price
billion
Forecast for Indian population
by 2030 +1 %
-0.5%
The Indian middle class
is expected to rise to
For a 1% increase in income, 1% increase in prices,
For a
gold demand rises by 1% gold demand falls by 0.5%
547 million by 2025
The rise of the young, Indian, middle-class worker
is expected to lead to increased gold demand
Indian culture supports gold As the population becomes more Higher household incomes
demand across religions urbanised, earning power increases boost gold demand
Short-term factors
Inflation Gold price Excess
changes rainfall
For a 1% increase in inflation, demand For a 1% increase in the gold price, A 1% increase in monsoon rainfall
increases by 2.6% demand will decrease by 0.9% above the long-run average, boosts
2
gold demand by 0.5%
1
GOLD DEMAND CHANGE (%)
-1
Investors around the world turn to In the first half of 2013 Rupee gold A good monsoon can increase crop
gold to protect against inflation. ‘13 price fell 20%, while consumer yields, sweep money into the rural
India is no different. demand leapt 37% year-on-year. economy and boost gold demand.
India’s gold market: evolution and innovation 09Short-run drivers of gold demand This econometric analysis uncovers just some of the
There are some very interesting factors that affect fundamental factors that drive Indian gold demand over
gold demand in the short term, too. Holding everything the long- and short-term. But these should not be viewed
else constant these are: as prescriptive; the relationships should be used as a
• Inflation: For a 1% increase in inflation, gold demand framework for people to understand the broad trends.
increases by 2.6%. Investors around the world turn to Greater insight is required to form a more rounded picture.
gold to protect against inflation. India is no different For example, too much rain during a monsoon can be bad
for crops; heavy rains in 2013 damaged crops and reduced
• Gold price changes: For a 1% fall in the gold price, yields, rather than boosting incomes.
demand will increase by 0.9%. As well as having an
effect over the long run, the gold price also affects The rest of this chapter provides more detail on the
short term dynamics. When the gold price falls sharply, drivers of gold demand uncovered by the econometric
consumers respond quickly. This is best illustrated by analysis, as well as some of the other macroeconomic
the events of 2013. Between 31 December 2012 and and demographic factors which may affect India’s gold
28 June 2013 the rupee gold price fell 20%. Over the demand in the coming years.
same period consumer demand leapt 37% year-on-year.
Two other factors affect gold demand, although
statistically they are not as significant as the factors
India’s population
described so far: is expected
• Excess rainfall: A 1% increase in excess rainfall, as to reach
measured by the amount of rainfall compared to the 1.5bn by 2030.
long-run average rainfall, boosts gold demand by 0.5%.
The monsoon is important for India’s agricultural sector.
A good monsoon can increase crop yields, sweep
money into the rural economy and boost gold demand
• Tax regime: Holding everything else constant, the India’s demographics
higher rate of import duties since 2012 have depressed
demand by 1.9%. India is a diverse country, home to more than 700 7
languages and dialects, and a plethora of faiths and beliefs.
This analysis is heavily skewed by the factors affecting While 80%8 of the population follow Hinduism, India is
jewellery demand; it accounted for around 80% of Indian the birth place of Buddhism, Jainism and Sikhism too.
gold demand between 1995 and 2014, after all. The factors This diversity is not captured in the econometric analysis,
affecting bars and coins are similar, but subtly different. although market research indicates that levels of gold
We touch upon them in more detail in Chapter 5. ownership and consumption patterns do not tend to differ
by religion. This suggests that the cultural aspect of gold,
which underpins Indian demand, cuts across religious
differences. For large swathes of India’s population, gold is
intertwined with their way of life.
7 Hindustan Times, July 2013.
8 Census 2011.
India’s gold market: evolution and innovation 10It has a large population which continues to grow India’s economy is expected to benefit from a
India’s population has grown rapidly. In 1900, its demographic dividend
population was 238mn. By 2011 this had increased India’s population is relatively young. More than 45% are
more than four-fold to over 1.2bn.9 It is the second most below the age of 25 (Chart 6). In China and the United
populous country in the world and the largest democracy. States the figure is closer to one third.10 According to the
To illustrate its size, Uttar Pradesh is the most populous United Nations, the number of people within the working
state with more than 199mn residents (Chart 5); this is age population (15–64) will increase as the people within
more than Russia. If we add Uttar Pradesh to the second the 0 –14 age range transition to the working population.
most populous state, Maharashtra, it totals 312mn, similar The UN estimates that by 2050 India’s working population
in size to the US. will total 1.1bn.
The rate of population growth, however, is slowing.
Between 1991 and 2001 the population grew by 21.5%;
this dropped to 17.6% between 2001 and 2011. But it is
growing nonetheless and the United Nations Population
Fund expects India’s population to reach 1.5bn by 2030.
Chart 5: Top ten states by population Chart 6: India's population distribution reveals an
abundance of youth
Millions Millions
250 300
These two states
are equal to the US More than 45%
250 of people are under
200
the age of 25; this
demographic dividend
200 will boost India's
150 economy
150
100
100
50
50
0 0
0-14 15-24 25-54 55-64 65+
h
ra
r
l
h
h
u
n
a
at
ga
ha
ak
es
es
es
ad
ha
ht
ar
Age group
en
Bi
at
d
ad
ad
N
st
uj
as
ra
rn
tB
ja
G
il
Pr
Pr
ar
rP
m
Ra
Ka
ah
es
ra
a
Ta
Male Female
tta
hy
M
W
dh
U
ad
An
M
Source: Ministry of Home Affairs Census 2011; World Gold Council Source: CIA World Factbook 2015; World Gold Council
9 Census 2011.
10 CIA World Factbook, 2015.
India’s gold market: evolution and innovation 11It is likely that India’s youthful population will spur on its people employed directly in farming totals 263mn.
economy. There is a wealth of research suggesting that The World Bank, however, estimates that some
economic growth increases as the number of productive 600mn people rely on farming crops or rearing livestock
people in the workforce increases – economists refer for their income.14
to this as the demographic dividend.11 This is not just an
academic theory. Many economists put the East Asian But this is changing. Although the majority of Indians still
growth miracle down to the large swell in working-age live in rural areas, an increasing number choose to live in
population between the 1970s and the 1990s.12 cities (Chart 7). With economic growth centred in larger
conurbations, many people – mostly young – have migrated
India is becoming increasingly urban to cities in order to earn better incomes. Urbanisation has
India’s population is skewed towards rural areas, with also led to an increase in the number of large cities. Cities
67%13 of Indians residing there. The Central Statistics with a population greater than one million people increased
Office agricultural census estimates that the number of from 35 to 53 between 2001 and 2011.
Chart 7: Urbanisation has accelerated over the last few decades
Millions
1,400
1,200
Cities with a population greater than 1 million
1,000
increased from 35 to 53 between 2001 and 2011
800
600
400
200
0
1960 1965 1970 1975 1980 1985 1990 1995 2000 2005 2010 2015
Rural population Urban population
Source: World Bank; World Gold Council
11 The Handbook for the Indian Economy, Chetan Ghate, Oxford University, 2012.
12 East Asia was one of the world’s fast growing regions during the 1980s and 1990s, in terms of GDP and GDP per capita.
This is often referred to as the East Asian miracle.
13 World Bank.
14 www.worldbank.org
India’s gold market: evolution and innovation 12This matters because cities generate wealth. No country Against this backdrop, in 1991 the government started
in the industrial age achieved significant growth without to introduce policy measures that led to the liberalisation
urbanisation. Workers in urban areas are more productive of the Indian economy. Red tape was cut away, import
and earn more than rural workers. Cities offer large, tariffs reduced and markets deregulated. This laid the
diversified labour pools and, by having a concentration foundations for future economic growth, with GDP growth
of educated workers, are more likely to generate new averaging 7.3% from 2001 to 2010, up from an average of
ideas and technologies.15 Urbanisation in India is likely to 5.6% in the 1990s.
continue to support economic growth.
Yet there is a subtle nuance to India’s urbanisation. It is
not just a migration from the countryside to the cities.
India’s middle class
Rural India has changed too. There has been a growth in
semi-urban towns, as well as a rapid development in rural
15–20%
India itself. Population growth in smaller towns and
semi-urban centres has outstripped that in metros,
supported by better infrastructure, stronger road and rail of population
connectivity, and improved communications.
Income levels and savings
individuals earning
In 2015 India was the fastest growing country in the
world; at 7.3% its GDP growth was ever-so-slightly ahead
of China’s and comfortably ahead of Western markets.
Rs240k–720k pa
The IMF described it as “the bright spot in the global
landscape.” 16 As the econometric analysis identifies, this total middle class
economic growth underpins India’s gold demand.
Liberalisation in the 1990s laid the foundation for
200–250mn
economic growth
India’s economic history can be divided into two distinct
Household incomes have increased
phases: pre- and post-liberalisation. The former covers
The reforms of the 1990s led to better job prospects and
1947–1991 when the government followed policies which
higher incomes for millions of Indian households. GDP
were bureaucratic, laden with red tape and inward looking.
per capita rose and millions of people were lifted out of
Corruption was rife. India’s annual GDP growth averaged
poverty. According to the World Bank, the percentage of
3%–3.5%.17
the population living on less than US$2 per day fell from
Poor economic policies were compounded by droughts around 46% in the early 1990s to around 21% in 2011.19
and famines. The government had to borrow to finance
The combination of a large population and rising incomes
its deficit to the extent that its debt to GDP ratio hit 75%18
means India has one of the world’s largest middle
in 1990. The following year India suffered a balance of
classes. Up to date information on the size of India’s
payment crisis.
middle class is hard to find. In 2010, the National Council
of Applied Economic Research (NCAER) estimated that
India’s middle class would reach 267mn by 2015–16. The
market research group TNS defines India’s middle class
as individuals earning Rs240,000–Rs720,000 a year. It
estimates that this captures 15%–20% of the population,
putting India’s middle class between 188mn and 250mn in
2015. Based on these estimates, it is probably safe to say
India’s middle class is between 200mn and 250mn.
15 David Bloom et al, Urbanisation and the wealth of nations, 2008.
16 http://www.imf.org/external/pubs/ft/survey/so/2015/car031115a.htm
17 Ministry of Finance.
18 IMF World Economic Outlook.
19 World Bank.
India’s gold market: evolution and innovation 13Given India’s demographics and economic trajectory, this gold related policies, please see Chapter 10.) Why did
large middle class is set to grow. NCAER forecasts that these restrictions come about? To understand we need to
it could reach 547mn by 2025. The Brookings Institution consider India’s trade balance and current account deficit.
thinks that by 2030, India’s middle class could be the
world’s largest, ahead of both the US and China.20 India’s current account deficit increased from the
1990s onwards
Savings rates are high Prior to economic liberalisation in 1991, the country
As income levels have increased, so too has the amount suffered from inward-looking policies. India had very
saved. From 1980 through to 2014 the savings rate little trade with the world during the early 1990s, instead
increased from 18% to 32%, peaking at 37% in 2007. focusing on protecting its domestic industry. In sharp
The IMF expects it to stay around 30% up until 2020.21 contrast, post-liberalisation has seen the share of exports
Thereafter it will likely be bolstered by the swelling ranks double in overall GDP terms, whilst imports increased
of the working-age population. even further. The trade balance in the early 1990s
was less than Rs100bn, but it has since increased to
Rs8,423bn in 2014–15, peaking at over Rs10,000bn in
Import restrictions and taxes
2012–13 (Chart 8).
In 2013 the Congress government began to ratchet up
gold import restrictions, starting with import duties before
moving on to a complex set of rules governing gold
imports and exports. (For more information on India’s
Chart 8: India’s trade deficit increased following trade liberalistion in the 1990s
Rupees bn
2,000
0
-2,000
-4,000 Economic liberalisation in
the early 1990s boosted
-6,000 economic growth and trade
-8,000
-10,000
-12,000
1988-89 1994-95 2000-01 2006-07 2012-13
Total trade balance Oil Non-oil
Source: Director General of Commercial Insights and Statistics; World Gold Council
20 Bookings Institution,The Emerging Middle Class in Developing Countries, 2011.
21 IMF World Economic Outlook, April 2016.
India’s gold market: evolution and innovation 14One of the biggest components of India’s imports is crude Misplaced government policies tried to reduce the
oil. Given the need to import more than 90%22 of its crude CAD by restricting gold imports
oil consumption, oil contributes nearly one third of The government was forced to take action. A raft of import
India’s import bill. The second largest part of the import bill restrictions were imposed, including on gold. Duties on
is gold. Imports of gold increased to Rs2,107bn in 2014–15 gold imports were steadily increased, rising from
from a low of Rs24bn in 1996–97.23 Between these two 2% to 10% between January 2012 and August 2013.
dates gold accounted for, on average, 8% of total Soon after, the government implemented the unwieldy
imports (Chart 9). and market-distorting 80:20 rule, whereby those importing
gold were required to export 20% as jewellery.26
Despite the high dependence on imports the current
account deficit (CAD) was typically under control. This These gold-specific import restrictions had a few effects.
changed during the late 2000s: the economic slowdown in First, as highlighted in the econometric analysis, gold
Europe, spiralling oil prices and rising gold imports caused demand eased a little. This was largely because the import
the CAD to balloon. It increased to Rs4,796bn in 2012–13 duties and 80:20 rule pushed up the premia in the local
from less than Rs116bn in 2000–01.24 The current account market, created uncertainty and, at the margin, deterred
deficit rose to 4.7%25 of GDP in 2012–13 (Chart 10). some potential gold buyers.
Chart 9: Gold imports in India Chart 10: India's current account deficit
Rupees bn % Rupees bn % of GDP
3,000 20 1,000 2
Gold imports have accounted for
2,500 0 0
an average 8% of total imports
15
2,000 -1,000 -2
1,500 10 -2,000 -4
The current account deficit peaked at
1,000 -3,000 4.7% of GDP in 2012 –13 -6
5
500 -4,000 -8
0 0 -5,000 -10
1996-97 2002-03 2008-09 2014-15
5
3
1
3
7
9
1
5
-0
-1
-0
-0
-0
-0
-1
-1
04
12
00
02
06
08
10
14
Gold imports % of total imports (rhs)
20
20
20
20
20
20
20
20
Source: Department of Commerce; World Gold Council Current account deficit, Rupees bn
Current account deficit as % of GDP (rhs)
Source: RBI; Economic Survey 2015-16; World Gold Council
22 Ministry of Commerce, Ministry of Finance, 2015.
23 Department of Commerce, Ministry of Commerce and Industry.
24 Reserve Bank of India.
25 Ibid.
26 The 80:20 rule came into effect on 22 July 2013 and was in force until 28 November 2014.
India’s gold market: evolution and innovation 15More importantly, the restrictions drove parts of the gold Agricultural production and monsoons
supply-chain underground. Smuggling increased sharply.
Between Q3 2013 and Q4 2014 around 335t of gold was Agriculture is a key component of the national economy,
smuggled into the country. So while official imports into especially the rural economy. As mentioned previously,
the country fell, unofficial imports increased. It is true that the World Bank estimates some 600mn people rely on
the current account deficit narrowed (Chart 10) during this farming crops or rearing livestock for their income. The
time, but with huge inflows of gold being smuggled into econometric insight that the monsoon has an impact
the country, the efficacy of the import restrictions must be on gold demand in the short-run comes as no surprise.
called into question. (Please see Chapter 7 for more detail But these factors are probably not as significant to gold
on gold smuggling.) demand as they once were.
The importance of agriculture has waned a little
As India has urbanised, agriculture’s share of GDP has
Between Q3 2013 and Q4 2014 steadily declined from 45% in the 1970s to 17% in 2015.
c335t In recent years, services, especially IT, have come to the
fore (Chart 12).
of gold was smuggled
into India. 600mn people rely
on farming for
Inflation their income and
Inflation has been a problem for India, regularly spiking there is a deep
to 10% and above since 1980 (Chart 11). Industrial
expansion and high food prices have led to inflationary
rooted tradition of
pressures, which have caused economic uncertainty. investing in gold
Given its attributes as an inflation hedge, Indians have
turned to gold in order to protect their wealth, and that
for this sector.
of future generations.
Chart 11: Indian CPI% change per annum Chart 12: Agricultural sector declining contribution
to GDP (value added, % of GDP)
YoY% change % of GDP
16 50
Industrial expansion and volatile 45
14
food price underpin high inflation
40
12
35
10
30
8 25
20
6
15 In 2015 agriculture accounted for
4 just 17% of GDP, but supports some
10 600mn livelihoods
2
5
0 0
1980 1985 1990 1995 2000 2005 2010 2015 1970 1974 1978 1982 1986 1990 1994 1998 2002 2006 2010 2014
Source: IMF; World Gold Council Source: World Bank; World Gold Council
India’s gold market: evolution and innovation 16Nor is rural India completely reliant on agriculture. In recent Outlook
years, rural areas have developed better infrastructure
and transport links, which have allowed manufacturing The outlook for gold demand is good. Our analysis
to become a more important part of the rural economy.27 indicates that per capita income is one of the most
According to a 2012 Credit Suisse report, between 1999 significant factors underpinning gold demand and will
and 2009, 70% of all new manufacturing jobs and 55% of increase over the coming years: the IMF expects growth
India’s manufacturing GDP came from rural India.28 of 35% from 2015 to 2020. More generally, India’s
middle class will grow. The NCAER expects it to reach
There are support mechanisms in place to protect 547mn by 2025.
farmers from weak monsoons
But agriculture is still important and the monsoon plays a India’s economic growth will be supported by strong,
key role in the economy. Even though India is no longer structural factors. The first is demographic. India’s
an agrarian economy, the lack of proper irrigation in many economy will receive a boost as its youthful population
areas means large parts of agriculture are still dependent enters the work force. The slow, but steady trend of
on monsoon rains. In the absence of modern farming urbanisation will continue to support economic growth by
techniques a deficient monsoon can have adverse offering higher incomes than rural areas and fostering
effects on the Indian rural economy and, consequently, an environment in which workers can create new ideas
its gold demand. and technologies.
Politicians are aware of the impact a deficient monsoon There will inevitably be short-term fluctuations.
can have on large numbers of farmers and there are Consumers will respond quickly to changes in the gold
mechanisms in place to protect rural incomes in such an price and the vagaries of the monsoon will continue to
event. The government-owned Food Corporation of India play a role: a good drenching will boost demand, while a
aims to protect farmers from sharp drops in food prices, disappointing drizzle might cause the rural economy
via the Minimum Support Price (MSP). This long-standing to sputter.
scheme provides a price-floor for a number of key crops.
And of course there are risks. Any tightening in
In early 2016, Narendra Modi’s government introduced a
gold-related policies, such as the measures that have
re-vamped crop insurance scheme, which aims to reduce
recently been implemented to regulate and formalise
premium charges and increase payouts to farmers in the
the gold industry, are disruptive and will stifle demand
event of natural disasters such as drought.
in the short to medium term (please see Chapter 10 for
a discussion of gold policy).
But given that income is the most significant factor
affecting Indian gold demand, and the outlook for income
growth is good, we expect India’s gold demand to remain
robust at between 850–950t by 2020.
27 Indian Council for Research on International Economic relations, Is manufacturing moving away from India’s cities, 2012.
28 Credit Suisse, India Market Strategy, The great Indian equalisation, 19 April 2012.
India’s gold market: evolution and innovation 172: Jewellery demand
India is one of the world’s largest gold jewellery consumers,
outstripping the combined jewellery demand of the Middle
East, Europe and the US. Demand typically peaks in October
and November, when the marriage season, harvest and
Diwali overlap. India’s diversity is reflected in its jewellery
consumption, with rural India accounting for around 60% of
jewellery demand. The outlook for jewellery demand is good.
Consumer research indicates latent demand and a healthy
interest from the younger generation of Indian consumers.
Jewellery demand Beyond its sheer size, India’s jewellery market is
incredibly diverse: heavy, chunky 22k chains are
India is the second largest jewellery market in common in Kerala while lighter, bejewelled pieces are
the world popular in Rajasthan. As well as the diversity in taste,
In 2015, India bought 663t of gold jewellery, second to appetite for purchasing gold jewellery also varies, with
China, but comfortably ahead of the US, Europe and southern regions accounting for around 40% of all of
the Middle East combined. Over recent years, it has India’s demand.
consistently been one of the world’s largest gold jewellery
consuming countries (Chart 13).
Chart 13: India is one of the largest jewellery consuming nations in the world
Tonnes
1,000
900 In recent consumer research 79% agreed
with the statement that gold will never
800 lose its value over the long term
700
600
500
400
300
200
100
0
2010 2011 2012 2013 2014 2015
India Middle East, US and Europe China
Source: Metals Focus; GFMS, Thomson Reuters; World Gold Council
India’s gold market: evolution and innovation 18For all this diversity, one thing is clear: 22k gold jewellery Seasonality: the importance of marriages, religious
is prominent in the nation’s jewellery box. In our 2016 festivals, and agriculture
consumer insight study 72% of respondents said they Gold is deeply rooted in Indian culture. Gold purchases
owned fine gold jewellery. Silver came a close second at are driven by tradition, festivals and other important family
70%, with diamond and platinum jewellery a lowly 24% and societal occasions. In a 2014 ICE360º survey, the
and 14% respectively. Among people who had bought two most important motives for buying gold were gifting
gold jewellery in the past 12 months there was a strong (46%) and a child’s future wedding (27%). It is likely that
preference for plain gold jewellery, which made up 74% of many of those identifying gifting as a motive would gift
all gold jewellery bought. gold at weddings other than that of their children. This
assumption is supported by the TNS consumer research
This, however, is a snapshot in time, and does not capture in 2016, which identified weddings (24%), birthdays
the changing dynamics of India’s jewellery market. With (15%) and religious festivals (12%) as being the top
rising disposable incomes over recent years, consumers three purchase occasions in India. It should come as no
have become more adventurous. Although platinum and surprise, therefore, that between 40% and 50%29 of gold
diamond jewellery have low penetration rates, pieces set purchases in India – either jewellery or bars and coins – are
with diamonds or other precious stone are more popular for marriages, and that gold jewellery demand tends to
than they were in the past, especially in urban India. The peak in the run up to marriage seasons (Table 1).
increasing popularity of high-end gold jewellery – such
as designer or gem-set jewellery – is also testament to
changing tastes.
But why does India have such a large and vibrant jewellery
market? There are several reasons. Most important are
the long-standing cultural traditions, which intertwine
gold with the Indian way of life. This includes weddings,
religious events – such as Diwali – and agriculture and
harvest seasons.
Crucially, over and above other metals, gold jewellery
is viewed as an investment as well as an adornment.
Of those surveyed in our proprietary 2016 TNS consumer
survey, 79% agreed with the statement that gold will
never lose its value over the long term and 76% agreed
with the statement gold makes me feel secure for the
long term. When we looked at India’s investment market,
38% of respondents invested in gold via 22k jewellery,
illustrating the dual role of 22k jewellery in India.
Contemporary bridal choker in 24k gold made with a combination
of traditional nakashi (repoussage) work, filigree and bezel set
kundan work.
29 Metals Focus.
India’s gold market: evolution and innovation 19Agriculture and the monsoon also play an important role cloths with gold coins flowing from her hands. Many
in gold demand.30 Although agriculture only contributes Hindus consider gold an auspicious metal, which they
17% to India’s economy, it is highly significant for the like to buy or give to loved ones during religious festivals.
rural economy, which accounts for over two thirds of The most important of these is Diwali, which marks the
the population.31 For a large percentage of crops, the beginning of the Hindu New Year, and usually takes place
harvesting season lasts from September to November. in October or November.
Once rural Indian communities have harvested and sold
their crops, a portion of the proceeds are invested in gold, Akshaya Trithiya is another important event. This is one of
typically jewellery: in rural India 46% of respondents to the the most auspicious days in the Hindu calendar – usually
TNS survey said they had invested in 22k gold jewellery late April/early May in the Gregorian calendar – and
and just 11% had invested in bars and coins. The picture is gold purchases on this day are considered propitious.
different in urban India, with bar and coins being the more Many retailers use Akshaya Trithiya to promote gold via
popular method of gold investment (please see Chapter 5 increased advertising and promotional discounts on
for more detail). labour charges.
Finally, there is religion. Gold is seen as a symbol of wealth As shown in the heatmap below, the combination of the
and prosperity in the Hindu religion. Lakshmi, the goddess wedding season, harvests 32 and festivals 33 means that
symbolising fertility, productiveness and prosperity, is said gold jewellery buying tends to be concentrated in
to have been bathed by elephants that carried pure water April–June and September– January (Table 1).
in golden vessels. Visually she is golden: she has a golden
complexion and she is dressed in gold-embroidered red
Table 1: Jewellery demand peaks between September and November
Jan Feb Mar Apr May Jun Jul Aug Sep Oct Nov Dec
Gold buying:
Festivals
Marriages
Harvests Rabi crops Kharif crops
Indian jewellery segmentation
30 For more information on the role of agriculture and the monsoon, please see Chapter 1.
31 World Bank.
32 Ugadi/Gudi Padwa (late April/early May) marks end of Rabi crop harvesting and start of sowing of kharif crops.
Onam (late August/early September) is Kharif crop harvest festival celebrated in Kerala.
33 Makara Sankranthi (January), Akshaya Tritiya, Dassera (October) and Diwali/Dhanteras are gold buying festivals in India.
India’s gold market: evolution and innovation 20Types of jewellery Buying gold jewellery for an Indian bride is based on the
concept of streedhan – loosely translated as property
Jewellery consumption falls into three distinct types: that a woman obtains at the time of marriage, given
bridal, daily wear and fashion. Each market boasts its own to the bride as security, which is hers to keep. An
characteristics, as well as different products, sizes and additional, albeit much smaller, element of wedding-
designs. When measured by number of sales, bangles and related gold jewellery demand comes from jewellery
chains are the most popular items, but when measured in gifted to the immediate family of the bride and groom, as
gold content, necklaces are most important (Table 2). well as jewellery that wedding guests may buy to wear
themselves to the wedding.
The importance of bridal gold jewellery
If we analyse the gold jewellery market by purpose, Given bridal jewellery’s dominant market share, gold
the importance of weddings and bridal wear is clear jewellery demand tends to be concentrated in the months
(Table 3). Around 40%–50% of gold jewellery and bars and weeks approaching the marriage season and during
and coins bought in India is for weddings. Although the season itself. However, the behaviour of wedding
there are no official figures for the number of weddings, purchasers has changed over recent years. With gold
it is likely to be between 8mn and 10mn per annum.34 prices having risen over much of the past 15 years, it
Whatever the exact number, we should expect it to has become increasingly common for families to make
increase. India has an extremely young population, many regular purchases of gold bars and coins, which are then
of whom have yet to be married. According to the CIA converted into bridal jewellery as the wedding nears. This
Factbook, 28% of the population is under the age of 14, ‘exchange’ activity is not captured as jewellery demand
while 18% are between 14 and 24. That translates to more because it does not represent new gold demand, rather a
than 500mn people under the age of 25. With the average transformation of gold from one form to another.
marrying age for females at 22, the number of weddings
per annum should grow.35
Table 2: Retail sales by jewellery type
Category % of retail sales Range of weights (gm) Most common weight sold (gm)
Necklaces 15%-20% 25gms-250gms 30gms-60gms
Bangles 30%-40% 8gms-25gms 10gms-15gms
Chains 36 30%-40% 10gms-50gms 10gms-20gms
Earrings 5%-15% 2gms-30gms 3gms-8gms
Finger rings 5%-15% 2gms-15gms 3gms-7gms
Source: Metals Focus; World Gold Council
Table 3: Segmentation of jewellery
Bridal Daily wear Fashion jewellery
Market share by weight 50%-55% 35%-40% 5%-10%
Caratage 22k, 23k, 18k 22k, 18k 18k, 14k
Size 30gms-250gms 5gms-30gms 5gms-20gms
Small sets: 30gms-60gms Chains: 10gms-20gms Chains: 8gms-15gms
Large sets: > 60gms Necklace: 20gms-30gms Pendants: 1gm-3gms
Earrings: > 15gms Earrings: 5gms-8gms Earrings: 3gms-5gms
Bangles: > 30gms Bangles: 10gms-25gms
Waist bands: > 40gms Pendants: 5gms-10gms
Bindi chains: > 40gms
Source: Metals Focus; World Gold Council
34 In our report An introduction to the Indian gold market published in 2001 we estimated there to be eight million weddings per
annum. More recently, some commentators have estimated it to be around 10 million per annum.
35 Ministry of Health and Family Welfare.
36 Chains, usually considered daily wear and worn by men and women, are lightweight. In contrast, necklaces are heavier pieces,
which can be studded or intricately carved, worn by women during marriages and festivals.
India’s gold market: evolution and innovation 21You can also read