Indian Association of Investment Professionals Indian Institute of Foreign Trade, New Delhi - CFA Institute Research Challenge
←
→
Page content transcription
If your browser does not render page correctly, please read the page content below
CFA Institute Research Challenge
                  Hosted by
Indian Association of Investment Professionals
  Indian Institute of Foreign Trade, New Delhi
1

         This report is published for educational
       purposes only by students competing in the
       CFA Global Investment Research Challenge                                             Havells India Limited
                                                                 Date 09.11.2016                                           Electrical goods

                                                                 NSE: HAVELLS | BSE: 517354                                                   India
   Recommendation                             SELL

   Price Target:      INR 321.4
   Price 08.11.2016: INR 392.45
   Downside:             18.1%                                                                                                     Highlights
                                                                We issue a SELL rating on Havells India Limited (HIL) with a one year
                                                                target price of INR 321.4, arrived at by using the Discounted Free Cash
                                                                Flow to the Firm Method and relative valuations based on trading
Key Ratios                                           2016A      comparables. Havells India Limited is one of the largest electrical equipment
Int Cover                                            15.25x     manufacturers in India and classifies itself as a fast moving electrical goods
                                                                company. It operates in four major business segments viz. switchgear,
P/E                                                  47.80x     cables, LED lightings and fixtures and Electrical Consumer Durables.
P/BV                                                  5.90x     Inadequate presence in the tier 2, tier 3 and rural areas is a big factor that
P/Cash EPS                                           45.80x     could see the company’s growth trajectory marginally stalled as the company
                                                                shows an uneven 70:30 distribution network across urban and rural regions.
M Cap/Sales                                           2.85x
                                                                The company is now working towards an FMCG like distribution network to
EV/EBITDA                                            28.42x     strengthen its presence in the source markets of the future growth.
ROCE                                                 10.60%     A considerable war chest for acquisition means that the company
ROE                                                  24.10%     currently stares at c. INR 23.5 per share. This cash, lying idle and earning no
                                                                or base returns would translate into a lower return on equity (RoE), hurting
Debt/Equity                                           0.00x     the overall profitability of the company.
EBITDA Margin                                        10.51%     Lightings and cables business hit a roadblock as the stark plunge in the
Net Profit Margin                                    15.80%     LED lighting prices, reducing CFL market in India and highly volatile copper
                                                                and aluminium prices have somewhat stalled the business growth that the
                                                                company was expecting to reach. Economic options in the cables segment to
                        Market Data                             cater to the increasing demand from the rural area also poses a threat of
                                                                market cannibalization.
  Market Capitalization                    INR 244.89 bn
                                                                (in INR bn except
  Shares Outstanding                         624.57 mm                                        2015A        2016A         2017E        2018E         2019E
                                                                per share data)
  Free Float                                     38.04%         Revenues                       85.69         77.14        83.81        91.62       100.98
  52 Week High/Low                    INR 459.40/235.30
                                                                EBITDA                          7.21          8.12        11.31        12.60         14.14
  Avg. Monthly Volume                       3,05,342.33         Net Income                      3.85         12.21         8.27          9.38        10.55
  Beta                                               0.81       Net Profit Margin (%)         4.50%       15.80%         9.87%       10.24%       10.44%
                                                                EPS                             6.22          8.21        13.34        15.13         17.01
700
                                                                DPS                                3              3            3            3             3
600
500                                                             Valuation: We opine that Havells India Limited is already trading at a very
400
                                                                high P/E multiple of 31.48x and P/BV multiple of 9.57x and is expected to
300
                                                                undergo correction. This is because despite the fact that the company is
200
                                                                going in the right direction with a stronger distribution network and a
100
  0
                                                                defensive core business, the market seems to have already factored that in
   Oct-11      Oct-12    Oct-13   Oct-14    Oct-15     Oct-16   making the correction a strong possibility.
            NIFTY            SENSEX            HAVELLS

   Source: Bloomberg, Company Fillings

                                                                                                       Important disclosures appear at the back of this report
2

                                                                                                                    Business Description
    Chart 1.1 : Revenue Breakdown by Segment (%)
                                                                   About Havells India Limited
                                                                   •   HIL is one of the largest electrical equipment manufacturer in India. Incorporated in
                                                                       1983, the company today has crossed a billion-dollar revenue mark on consolidated
                                                                       basis and classifies itself as a fast moving electrical goods company.
                                                                   •   The company operates businesses in four major segments – Switchgears, Cables,
                                                                       Lighting and Electrical Consumer Durable.
                                HT                                 •   HIL is currently rated AAA by CARE and AA+ by ICRA with a stable outlook.

                                                                   Product Segments
                                                                   Switchgears: Under this segment HIL operates in two major segments which are
                                                                   domestic MCB and modular switches and has witnessed a CAGR of 12% in last five
                                                                   years and in total this segment forms the second biggest part of company’s revenue
Source: Company Fillings                                           contributing 23.7% in FY’16 with a Y-o-Y growth of 0.55% and has the highest
                                                                   contribution margin at 39.2%. The company has a market share of around 28% in
       Chart 1.2 : Segment Contribution Margin (%)                 domestic MCB market and around 15% in modular switches market. The company also
                                                                   operates under the brands Standard and Crabtree and is expanding its portfolio with the
                                Sylvania stake sale                latest launch of Reo and Reo Bliss.
                                                                   Cables: Under this segment HIL operates in both domestic and industrial cable
                                                                   segments and this segment has witnessed a CAGR of 12% in last five years and forms
                                                                   the biggest part of the company’s revenue, contributing almost 40.6% in FY’16 with an
                                                                   overall contribution margin of 14.2%. The company has market share of almost 16% in
                                                                   domestic and 10% in industrial segment. This segment witnessed a growth of 0.8% as it
                                                                   was largely influenced by the commodities prices of copper as the benefits have to be
                                                                   passed-on to the customers.
                                                                   Lighting: Under this segment the company operates in two product categories lamps
                                                                   and fixtures and has witnessed a CAGR of 12% in last five years and contributes 14.7%
                                                                   to the company’s revenue with a contribution margin of 24.1%. Amongst the two
                                                                   categories, fixture category (including LED) forms 70% of the segment revenue. The
                                                                   company has a market share of around 14%. The major focus of the company is on the
Source: Company Fillings                                           LED segment which witnessed 100% Y-o-Y growth and which forms 51% of the
                                                                   segmental revenue. The acquisition of Promptec will boost LED and solar segment over
                                                                   the coming years.
     Chart 1.3 : HIL EPS and Dividend Payout Ratio
                                                                   Electrical consumer durables: The segment comprises of fans, water heater and
                                                                   domestics appliances and has witnessed a CAGR of 19.5% in last five years. This
                                                                   segment forms 21% of the revenue in FY’16 with a Y-o-Y growth of 11% and with a
                                                                   contribution margin of 25.2%. Fans forms 70% of the revenue in this segment and the
                                                                   company has a market share of 15% and is the only company to produce all four types
                                                                   of fans: ceiling, table, pedestal and wall fans. The company has launched various new
                                                                   kitchen appliances and air coolers and has ventured into niche category of air purifiers.
                                                                   The company also plans to launch solar water heaters in the coming years.
                                                                                                                    Business Description
                                                                   Company strategies
Source: Company Fillings                                           Focus on domestic markets
                                                                   During the year the company divested 80% stakes in its WOS Havells Malta Ltd. and
                                                                   80% stake in Havells Exim Limited for a net consideration of INR 10.87bn to continue
                  Growth drivers for HIL
                                                                   focus on Indian operations. This divestment will improve company’s financial position
                                                                   and profitability. To expand in the domestic markets and garner market shares company
   Government spending on            Real estate market up-tick,
     infrastructure sector           brand based consumerism
                                                                   entered into a purchase agreement with Promptec Renewable Energy Solutions Pvt.
                                                                   Ltd. to acquire a 51% stake for a net consideration of INR 291.2mm. This acquisition will
                                                                   help the company to expand in LEDs and solar lightening solution.
                                      LED pushing initiatives
    High capital expenditure
                                        like subsidies by          Focus on tier 2 and tier 3 cities
   being incurred by industry
                                           Government
                                                                   The company will be penetrating more in the Tier-2 and Tier-3 markets to tap-in the
                                     Increasing electrification    growth of these cities with its wider distribution reach and planning to expand to 1100
   Favorable demographics                of rural areas by
                                           Government
                                                                   cities from currently 700 cities having population of more than 50,000. The company
                                                                   also plans to expand in the western and the southern markets which currently
Source: Student Research                                           contributes only 15% and 25% respectively to the revenues.

                                                                                                             Important disclosures appear at the back of this report
3

                                                                                                          Business Description
 Chart 1.4 : Marketing & Advertisement Spend of HIL
                                                        Established manufacturing base: HIL currently has 12 manufacturing units and
                                                        produces c. 92% of the products in-house which is the highest in the industry. In FY’16,
                                                        it operationalized its plant in Neemrana, Rajasthan for manufacturing of modern electric
                                                        water heater. It is in the process of setting up two more manufacturing units at Guwahati,
                                                        Assam for switchgears and Bangalore, Karnataka for cables which may be operational
                                                        by FY’18 with a total investment of INR 1.4bn. HIL has a policy of one plant one product
                                                        to focus on efficiency. The current utilization level at each plant is c. 70-80%.
                                                        Projection as a lifestyle brand: HIL enjoys a strong brand recall and operates in the
                           HT                           premium end of the market where it is targeting next generation with automation, state-
                                                        of-the-art switchgears and remote controlled electrical devices and is able to maintain
                                                        high contribution margins. These smart devices dovetail with the Govt. initiatives of
                                                        smart cities. It has consistently been spending 3-4% of revenues as advertising and
Source: Company Fillings                                marketing expense and has increased its hiring as a strategic move to align itself as a
                                                        FMEG brand and is continuously expanding and differentiating their product portfolio.
          Chart 1.5 : Shareholder Structure (%)         Augmenting distribution network for expansion: HIL has the widest network of
                                                        distributors and dealers amongst all electrical goods manufacturers. It has c. 85000
                                                        dealers + distributors, c. 100000 retailers and has exclusive chain of showrooms called
                                                        Havells Galaxy which contributes c. 12% to the revenue. Currently the company has 375
                                                        exclusive showrooms and plans to expand it to 600 showrooms by FY’18.
                                                        Shareholder structure: As on 31st March, 2016, HIL is 61.63% owned by promoters
                                                        and 38.37% owned by public. In the public holding part, 29.74% is owned by institutions
                                                        and 8.62% is owned by non-institutions. In the institutional holding part, 4.19% is held by
                                                        Domestic Institutional Investors and 25.55% is Foreign Institutional Investors.
                                                        The largest shareholder and promoter QRG Enterprises Ltd. (30.40% of shares) entered
                                                        a revised Trademark License Agreement with HIL’s pursuant to which the rights of the
                                                        brand were transferred to the company for no consideration w.e.f. April 01, 2016.
 Source: Company Fillings                               Corporate Management:
                                                        Mr. Anil Rai Gupta became the new CMD of HIL on 13th November, 2014 after the
            Chart 1.6 : Net Income (INR bn)             demise of the founder and former CMD Mr. Qimat Rai Gupta. He has served the
                                                        company as Executive director and Joint Managing Director since 2006. HIL reported a
                                                        marginal increase in PAT over 2014-16 following the 80% divestment in Havells Malta
                                                        Ltd. and Havells Exim Ltd. In FY’15, HIL expanded its Board of Directors from nine to
                                                        twelve. Mr. Puneet Bhatia and Mr. Monhandas Pai were added as non-independent and
                                                        non-executive BOD, Mr. Aveent Kumar Gupta was added as whole time director, Ms.
                                                        Pratima Ram, a female director was added as an independent director.
                                                                                                        Corporate Governance
                                                        Corporate governance
                                                        Board: The composition and election of the Board of Directors is in accordance with the
                                                        requirements of the Companies Act 2013 and the Clause 49 of Listing Agreement.
                                                        However, an area of concern is the Independence of the Independent Directors since
                                                        majority have been holding the office since a period of 5 years or more.
Source: Company Fillings
                                                        Corporate Committee: The committees have been constituted based on the
                                                        Companies Act, 2013 and Clause 49 of Listing Agreement. Meetings were duly held.

         Remuneration of Key Management                 Director Remuneration and Shareholding: The Directors hold 8.47% shares, of which
                                                        8.26% is held in the capacity of Promoters. The remuneration to directors were within
                                                        the prescribed limits of the Companies Act 2013.
     INR (mm)              2016    2015       2014
                                                        Statutory Auditors: One of the Joint Auditors appointed and proposed for re-
    MD / WTD /                                          appointment is S.R. Batliboi & Co LLP, an EY member firm, which has issued an
                          225.08   239.00     157.33    unqualified Auditors Report on the Standalone Financial Statements; concluding a high
     Manager
                                                        level of Internal Control and adoption of good Corporate Governance practices.
     Directors             6.24     5.16          1.2   Corporate Social Responsibility
                                                        The company believes that corporates have a special and continuing responsibility
  Key Managerial                                        towards social development. It has taken CSR activities through QRG Foundation, a
                           4.86     3.98           -
    Personnel                                           trust instituted by the group. The company has constituted a CSR committee with four
                                                        board members and has been spending 2% of the average profit for last three years for
                                                        CSR activities (INR 114.8mm in FY’16). Some of the major initiatives involves Mid-Day
Source: Company filings
                                                        Meal to 57,000 children in 672 schools, sanitation facilities in 102 schools by setting up
                                                        of 816 toilets, donation of tables & benches to Govt. schools in Haridwar.

                                                                                                   Important disclosures appear at the back of this report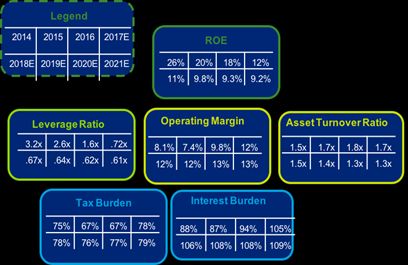
4

                                                                        Industry Overview and Competitive Positioning
         Chart 2.1 : GDP Growth of India (%)                   The Indian economy is expected to show more than 7% GDP growth
                                                               rate despite looming uncertainties
                                                        7.6
                                        7.2
                                                               2016 saw a number of key macroeconomic activities shaping the world economy like
                             6.6                               Brexit vote and US economy revival. The continuous volatility of the financial market
                                                         6.2
                                       5.9                     along with declining commodity prices has resulted in weak growth of the world
         5.6
                             5.3                               economy and an overall sentiment of caution amongst investors. India showed robust
                                                               growth rate of 7.6% in 2015-16, while the average global economy growth was 3.1%,
          4.3
                                                               making India the fastest growing economy in the world.
     2012-13        2013-14
                              HT   2014-15        2015-16      The outlook for Inflation in India seems positive and in the near future, it is expected to
                                                               be around the RBI’s target range of 4% +/- 2%. Both, the CPI and WPI data depicts
                GDP Growth           Per Capita GDP Growth     that the RBI has been successful in keeping the inflation in check and in the target
 Source: Economy Survey 2015-16
                                                               range of 4% - 6% over the period. The recent government policies like the revamped
                                                               PDS with JAM will improve the purchasing power in rural India, and stimulate demand
                                                               in the economy. Also, the rollout of GST bill might have a huge stimulus in the
       Chart 2.2 : WPI and CPI rates in India (%)              economy because of the increased margins for the suppliers as well as lower costs for
                                                               the consumers. IMF forecast the GDP growth to be 7.7% in 2017. The expected
                                                               increase in oil prices and geo-political tension between India and Pakistan together
                                                               with policy changes in US post elections might pose significant risks in the future.
                                                               Switchgear segment
                                                               The industry forms 15.9% revenue of Transmission and Distribution equipment
                                                               industry and is expected to grow at a CAGR of 19.2% till 2020
                                                               The switch-gear market is expected to grow in coming years with a push for pan India
                                                               electrification and to generate 175GW from renewable resources by 2022. The
                                                               increase in the real estate activity in Tier 2 and Tier 3 cities and a greater focus on
Source: Economy Survey 2015-16                                 safety will also push the growth in domestic switch-gear market currently at INR 20,000
                                                               mm. The segment has got significant thrust with opening up of sector to 100% FDI and
      Chart 2.3 : Segment Growth of Electric                   a significant improvement in technology. The switch segment which is broadly
          Equipment Industry (INR bn)                          classified into non-modular which accounts for INR 15bn and modular switches which
                                                               currently stands at INR 20bn is set to gain as customers look for attractive and energy
                                                               efficient switches. The top 4 players in switches account for almost 70% of the
                                                               organized market and that forms almost 75% of the total switches market.
                                                               Lighting and EESL segment
                                                               Rising personal disposable income, growing government initiatives encouraging
                                                               use of LED lights and increasing focus on smart city projects to spur growth
                                                               These factors are set to push the lighting market in India from INR 120bn in 2016 to
                                                               INR 370bn by 2020, driven mainly by the LED lighting business. Government initiatives
                                                               for energy conservation by partnering with EESL and providing LED light bulbs under
                                                               the RGGVY initiative has already provided a strong foundation for the LED business.
                                                               Electric Lamp and Component Manufacturer’s Association of India (ELCOMA) expects
                                                               the LED lighting business to grow by a CAGR of 40% over 2016–2020, which will
                                                               further drive up the lighting business which is expected to clock a CAGR of 18% over
                                                               the same period. Thus, this sector provides a gainful avenue for investment.
Source: ELCOMA                                                 Cables segment
                                                               The industry is poised to grow at a CAGR of 7-8% till year 2019 with a thrust
                                                               from infrastructure, telecommunication and power sectors.
      Chart 2.4 : Lighting Industry Expected
               Growth (INR bn, %)                              Currently domestic cable segment stands at INR 80bn and industrial cable segment
                                                               stands for INR 120bn. The major demand is likely to come from power, infrastructure
                                                               and telecom sector. With 4G spectrum allocation and a push for housing through the
                                                               setup of Rural Housing Board, demand for cable is likely to increase in the near future.
                                                               The sector is being granted 100% FDI under automatic route. The major risk for this
                                                               segment comes from imported cables from China and Commodity price fluctuations,
                                                               mainly in aluminium and copper.
                                                               Electrical consumer durables segment
                                                               Increasing investments, driven by growing demand and policy support will drive
                                                               this sector to a 10.5% CAGR over FY16-FY20
                                                               Due to the aforementioned growth drivers, further supported by increasing
                                                               electrification of rural areas, rising working age population and further penetration into
                                                               the untapped rural market, the overall market size of ECD sector in India would reach
 Source: ELCOMA
                                                               INR 1375bn.

                                                                                                         Important disclosures appear at the back of this report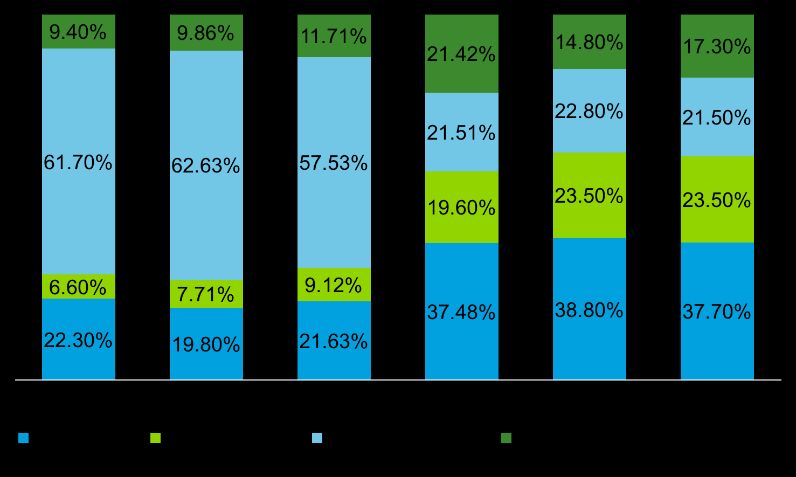
5
                                                                                   Industry Overview and Competitive Positioning
       Chart 2.5 : Competitor Operating Margins
       Comparison (INR bn, %)                                           The rural markets, which contribute 33% of the revenue, are set to grow at 25% CAGR
                                                                        over the next 5 years. Modified Special Incentive Package Schemes (M-SIPS), National
                                                                        Electronic Policy (2012) and relaxed FDI norms for electronic hardware manufacturing
                                                                        and multi brand retail will further fuel growth. The production is expected to increase to
                                                                        INR 6.9tn by 2020 and the electronics market size is expected to increase to INR 26.7tn
                                                                        from INR 6.3tn during the same period. As a result, ECD sector provides a lucrative
                                                                        prospect for investment.
                                                                        Competitive Positioning
                                                                        Production capacity – Higher capex, building newer plants and one plant one
                                                                        product policy
                                                                        The company has been investing in new manufacturing facilities and produces almost
                                                                        92% products in-house. The company has consistently invested ~2-2.8% of revenue as
                                                                        capex over years. The domestic manufacturing will benefit the company in depreciating
  Source: Bloomberg
                                                                        INR environment as it has the lowest levels of imports among Indian consumer
                                                                        electrical companies. The current utilization capacity being 70-80% across various
                                                                        plants, so the company will be in a competitive position to expand the production as
             Chart 2.6 : Marketing and Advertisement                    demand picks up. This strong manufacturing base has led doubling the market share of
            Spend of Havells v/s peers (% of revenue)                   HIL in almost every product segment in last 10 years. The company has maintained a
                                                                        lean working capital cycle of 15 days owing to high debtors discounting and channel
                                                                        financing which are off-balance sheet items. Excluding debtor discounting and channel
                                                                        financing, debtor days will be in-line with the industry.
                                                                        Cost leadership – Premium products and pricing
                                                                        The company is dominant in premium segment and is able to charge a premium for its
                                                                        products. The company is a dominant player in premium fans segment and a smaller
                                                                        presence in mass market segment, company’s product line stats from INR 1,800
                                                                        whereas other competitor’s product line starts from INR 1,100. In wires and cables, the
                                                                        company is able to sell at a premium as compared to Finolex and Polycab. In
                                                                        switchgears, the company is a market leader and has one of the highest contribution
                                                                        margins in the industry. In ECD, company had launched multiple new appliances and
 Source: Companies Fillings                                             this steady widening of portfolio will be contributing to the growth in this segment in the
                                                                        coming years.
              Chart 2.7 : Market Structure of Segments                  Strength of brand – Marketing expenditure, multi-product dealership, product
                                                                        portfolio
                                                                        The company has a strong top of the mind recall because of the marketing campaigns
                                                                        run by the company. The marketing expenditure has been one of the highest in the
                                                                        industry and is around ~3% of the revenue consistently. Dealerships of the company is
                                                                        a multi-product dealership unlike other competitors which are only single product
                                                                        dealership. With the opening up of HIL’s Galaxy stores which are one stop stores for
                                                                        HIL’s products adds to the brand visibility. HIL is the only company to be present across
                                                                        the entire consumer electrical space covering from switchgears to cables to kitchen
                                                                        appliances. This wide presence and the continuous expansion gives the company more
Source: Various                                                         visibility through shelf space on multi-brand retail stores
                                                                        Improved Distribution network and Services- Strong connect with the electricians,
            Table 2.1 : Competitor Portfolio Analysis
                                                                        Dealer incentive structure, Customer services
  Segment        Havells   Finolex Polycab   CG   Bajaj Philips   ABB
                                                                        The company has a strong focus to build a dealer network and the largest number of
                                                                        dealers and distributors amongst competitors. The company had made tremendous
 Cables and
                   *         *       *                                  efforts to connect with retailers and electricians with almost 200,000 registered
   Wires
                                                                        electricians as they play a significant part in influencing the decision making of the
  Domestic
 Switchgear        *                                              *     customers. The company has joined with banks to finance the working capital of the
                                                                        dealers, which appears as a contingent liability on the Balance Sheet and currently
  Industrial                                                            stands at INR 3.7bn. HIL’s is the only company to introduce customer services even for
 Switchgear        *                                              *
                                                                        the smallest SKU (Stock Keeping Unit). The cost of such a service is almost 1.5% of
   Motors          *                         *                    *     annual revenue but helps in building a strong brand and gain customer trust.
                                                                        Robust Return Ratios – High ROE, increasing cash inflows, cash lying on Balance
 Capacitors        *         *                                    *     Sheet, High margins
 Electrical
 Switches          *         *                                    *     The company has constantly maintained one of the best RoE and RoC in the industry.
Lightening &                                                            Free cash inflow has been increasing for the firm and is expected to increase further on
  Fixtures         *                         *     *      *             earnings growth and low working capital. It has maintained best EBITDA margins in the
    Fans           *                         *     *                    industry. After the stake sale in Sylvania has, the company recorded an increased cash
   Home
                                                                        inflow and is eying a domestic acquisition to strength position in the domestic markets.
 Appliances        *                         *     *      *
Source: Companies Fillings

                                                                                                                   Important disclosures appear at the back of this report
6
                                                                                    Industry Overview and Competitive Positioning
        Chart 2.8 : Porters Five Forces Analysis                        Innovation – In-house R&D capabilities, 185+ IPRs & 18+ patents
                           Competitive Rivalry
                                                                        The company has been investing heavily in-house research and development and
                                  5                                     continuous product development has been differentiating HIL’s from its competitors and
                                  4                                     contributing towards its brand equity and premium pricing. The company has positioned
                                  3                                     itself more of a lifestyle brand with the launch of home automation, remote controlled
                                                                        electrical appliances. The company has launched energy efficient fans, fans with LED
  Threat of new                   2                      Threat of
    entrants                                            Substitutes     lights, Euro-II range of MCB, MCCB, Lumeno LEDs and even entry-level modular
                                  1
                                                                        switches for Tier-II and Tier-III cities. This constant innovation and increasing the churn
                                  0                                     of products provides HIL’s with a competitive advantage and its higher multiple.

                                                                                                                            Investment Summary
       Bargaining power                          Bargaining power       We issue a SELL recommendation on Havells India Limited (HIL) with a target price of
         of suppliers                              of customers
                                                                        INR 321.4 using the Discounted Free Cash Flow to Firm and the relative valuation
Source: Student Research
                                                                        method. This offers a 18.1% downside from its closing price of INR 392.45 on November
                                                                        8, 2016. HIL would stand to gain from its highly diversified core business through a solid
Chart 3.1 : Copper and Aluminium Price Trends (INR)                     distribution network, which is set to improve as it continues to develop the same. The
500                                                                     seizure of payment of royalty from the current financial year will see the company gain
                                                                        on its EBITDA margins as well. But the stock market seems to have already factored this
400                                                                     in and hence the stock could see considerable correction in the coming year.
300                                                                      HIL’s business is on the back foot mainly because (1) LED has seen and is expected to
                                                                        continue seeing reduction in prices; (2) the cables business is being cannibalised by
200                                                                     companies providing budget options like Polycab and Finolex; (3) The switchgear
                                                                        segment sees HIL as an established player only in the premium segment and its infancy
100
                                                                        in the other segments could hurt the bottomline; (4) the ECD business is still a very small
  0                                                                     contributor to the revenues and sees established players as a huge threat; (5) the
  Dec-11       Dec-12        Dec-13       Dec-14       Dec-15           pension liabilities for the subsidiaries in Brazil and Thailand could hurt profitability.
                                                                        Amongst other reasons, the government levied subsidies on LED lighting would see the
                          Copper           Aluminium
                                                                        prices fall furthers, thereby impacting the revenue despite growing volumes in the
Source: MCX SX                                                          business. Also, HIL’s decision of not competing for any EESL tender floated by the
                                                                        Government of India in the coming financial year would see it lose out on its LED
        Chart 3.2 : HIL Cash Balance (INR bn)
                                                                34.98   business as well. The volatility in the commodity prices, especially copper prices, will put
                                                                        the margins under pressure as well.
           Sylvania Stake Sale                     26.86                Strong urban distribution network, but rural network is work in progress
                                      20.19                             The rural – urban distribution network is a 30:70 ratio for HIL which is somewhat
                                                                        alarming, considering that the growth in a more or less flat for the coming couple of
                          14.70                                         years is expected to come from the rural and the tier-2 and tier-3 cities. The company
8.82                                                                    has recently started working on a goal towards becoming a fast moving electrical goods
             7.77
                                                                        (FMEG) company, trying to replicate the distribution network that the FMCG companies
                                                                        boast of. But it is expected to be initially a cost intensive change as the benefits to lure
                                                                        the distributors to be a part of this project could take a hit on the margins being earned
2014        2015          2016        2017E        2018E      2019E     from the sales. Also, the acceptability of the premium products of HIL versus the
                                                                        economic options like Finolex, Polycab, Crompton Greaves etc. is still a grey area.
Source: Company Fillings, Student Research
                                                                        Huge unutilized cash reserves on the balance sheet
                                                                        The sale of stake in Sylvania has added to the already built up huge cash reserves of
           Chart 3.3 : HIL Manufacturing Facilities                     HIL. For These reserves, the company has clearly stated the intent of utilizing them to
                                                                        acquire a company in the Indian market to help them reinforce their position in the Indian
                                                                        markets. But the cash reserves of INR 23.54 per share sitting idle on the balance sheet
                                                                        would further hurt the RoE that the company in the coming year. Also, in which business
                                                                        would this acquisition be and what premium would the company be ready to pay at a
                                                                        time which sees all the companies in this business trade at very high multiples, prevents
                                                                        from getting any clear idea as well. The delay in realization of synergy with this possible
                                                                        acquisition, as is the case with Promptec, could lead to further dampening of the returns.
                                                                        The agreed sale of stake in the Brazilian and Thai business of Sylvania once it reached
                                                                        profitability will add to this cash, with the possible utilization remaining nebulous.
                                                                        Cables and LED business show stunted growth
                                                                        The cable business is highly dependent on the copper commodity prices which have
                                                                        been quite volatile in the past and is expected to remain the same in the future. This has
                                                                        led to erratic and under pressure margins in the cables business, which contributes
                                                                        almost a third of HIL’s revenue, yet it registered a mere 14% contribution margin, least
                                                                        amongst all the businesses of HIL. The LED business too has seen volume growth but
Source: Company Fillings                                                the stark plunge in the prices has led to a single digit growth since 2012.

                                                                                                                    Important disclosures appear at the back of this report
7
Investment Summary
The migration from CFL to LED has also seen HIL needing to change the existing CFL
Table 4.1 : WACC Computation manufacturing facilities to LED manufacturing facilities. The decision to not participate in
the EESL tenders floated by the government this year on the back of inability to cater
Equity 99.30% the demand of the same could see them miss out on crucial business.
Debt 0.70% Valuation Methods
Levered Beta 0.81 We derived our target price by using 60:40 ratio of the Discounted Free Cash Flow to
Firm method and the relative valuation method.
Risk Free Rate 6.82%
Drivers of Volatility in Earnings
Market Return Rate 13.68%
The major drivers of volatility have been (1) divestment of stakes in Sylvania except
Cost of Equity 12.4% Brazil and Thailand; (2) the commodity price volatility and (3) plunging prices of LED
lighting. These are set to continue in the future, though the divestment of the remaining
Interest Rate 11.75%
stake in Sylvania is not expected to bring in similar volatility to the earnings as in the
Tax Rate 22% past. The possible acquisition or merger would also lead to volatility in the earnings,
which will further also be impacted by the synergy realization from the same.
Cost of Debt 11.75%
Possible investment risks
WACC 12%
Key risks that the investors must be aware of include regulatory risk such as delayed
Source: Bloomberg, Student Research implementation of GST. Business risk includes slowdown in real estate and
infrastructure sector, entry of new market players in business segments and upcoming
business in tier 2 and tier 3 cities. The technological risks would encompass continuing
technological constraints in LED lighting and disruption with new technologies in coming
Chart 4.1 : Havells Revenue in INR bn and Margins future. The strategic risks being faced are cannibalization of sales by technologically
105 17%
upgraded products, increased exposure to only Indian markets and expansion plans not
15.8% being as effective. The large, unutilized cash reserves also pose a financial risk. A
13.5% 13.8% 14.0% detailed discussion on each of these is provided in the Investment Risk section
85
12.0% 12.2% 12.6% 13%
65
10.5% 9.9% 10.2% 10.4% Valuation
8.4% 8.9% 9%
6.8%
45 DCF Valuation
4.5% 5% We used Discounted Cash Flows to the Firm (DCF) method to arrive at target price of
25 INR 260.1 per common share. This method requires estimation of free cash flows to all
the capital holders in the company and discounting it to arrive at an enterprise value. It is
85.69 77.26 83.81 91.62 100.98 1%
5 then adjusted with net debt to derive the equity value to finally determine the target
2015 2016 2017E 2018E 2019E price. The forecasted period is 2017-2021 for which the estimates have been drawn post
-15 -3% which a terminal value is obtained at a constant growth rate.
Revenue EBITDA Margin Revenue assumptions
EBIT Margin Net Profit Margin The revenue is projected for its 4 operating segments:
Switchgear: HIL operates in 2 sub-segments- a. Modular Circuit Breakers (TAM is c.
Source: Company Fillings, Student Research 23%) and b. Modular Switches (TAM c. 18%). The future revenues are forecasted by
estimating the market growth of these two sub-segments, expecting HIL to retain its
market share of 29% and 20% respectively in both of these sub-segments.
Chart 4.2 : Segment Wise Revenue Breakdown in bn Cables: HIL is a leading player in this segment. The past trends show this segment to
have become a stable business for HIL and thus it is expected to grow at a stable rate.
Lighting and Fixtures: This segment comprises of LED, CFL as the core technologies.
15.70 The remaining 20% stake in Sylvania contributes to this segment. Since the company
14.19 will be selling off this stake once it turns profitable, the revenue contribution is
10.28
12.76 considered constant as the focus is to improve the expenses side. Chile and USA
11.41
35.81 businesses are already contained, so only Brazil and Thailand subsidiaries are
33.50 considered as HIL. LED segment contributes c. 2/3rd to the domestic business and HIL
40.72 31.94
30.79 is expected to retain its market share in this fast growing market. The remaining 1/3rd of
the domestic business mainly constitutes of CFL for which the market is expected to
32.93 decrease in the future.
25.17 28.76
21.90 22.08 ECD: In ECD, c. 70% of revenue comes from fans. The future revenue is projected
according to market growth and remaining 20% is other ECD appliances like geysers for
12.79 12.86 13.94 15.17 16.54 which the overall growth of ECD market is considered a proxy for future projections.
Cost Assumptions
2015A 2016A 2017E 2018E 2019E
SG&A: These expenses are projected as a constant percentage of revenue. In future,
Switchgear Cables Lighting ECD we do not see HIL having any significant increase in its SG&A expenses as HIL is
already one of the highest spenders in advertising, comparable to the top FMCG
Source: Company Fillings, Student Research companies of India.
Employment Benefits: These expenses are projected as percentage of revenue. Since
the company is moving towards FMCG model of distribution and has huge pension
liabilities, these expenses are projected to grow at modest rate.
Important disclosures appear at the back of this report8
Valuation
Havells India Limited share price and news flow Stake sale in
Sylvania
1:5 stock split announced announced
European debt crisis impacts
Indian stock markets
HT
Market tumbles on concern Acquisition of Promptec
Markets rise as Oil and Gold prices slump due to weaker rupee announced
Cash flow assumptions
Table 4.2 : Havells Relative Valuation Depreciation and Amortization: Fixed asset turnover as percentage of revenue is taken
Company Segmental Segmental Contribution as 6 year average and is expected to remain constant in forecasted period. The D&A
Segments Revenue Revenue % Margins expense is taken as a fixed percentage of beginning Gross Fixed Assets that is calculated
by deducting the total accumulated D&A from the gross block at the end of previous year.
Sw itchgears 13.94 16.63% 37.72%
Capital Expenditure: The Capex is divided into 2 parts: - (1) Maintenance Capex- which is
Cables and Wires 25.17 30.03% 23.50% the same as D&A for that particular year and (2) Growth Capex- the remaining Capex is
classified as growth capex.
Lightening 31.94 38.11% 17.30%
Working Capital: HIL is expected to maintain its improved working cycle days. Thus, it is
ECD 12.76 15.22% 21.49% estimated by maintaining constant days of inventory for inventory forecast, days of
receivable for debtors and days of payable for creditors’ amount.
WACC assumptions
Sw itchgear Weighted Average Cost of Capital (WACC) is calculated using CAPM model. The risk free
rate of 6.82% is current yield on 10 year Indian bonds. Beta of 0.81 is calculated by
Max Median Mean
regressing the historical HIL return with respect to National Stock Exchange for a 5 year
From P/E 2017E 190.69 146.49 146.49 period. The market risk premium of 5.19% is on the basis of the Indian stock market
returns for the past 10 years. Tax rate of 22% is the current effective tax rate of company
From P/E 2018E 174.41 136.50 136.50 which will be effected once GST is applicable from April 1, 2017 but since the process of
its full implementation is under constant revision, the tax rate is considered unchanged.
Cables Using CAPM model, the WACC is 12%. HIL has negligent debt because as per guidance
the company is reserving cash and avoiding any big investments as it is looking for viable
Max Median Mean acquisition targets in ECD segment.
Price multiples
From P/E 2017E 132.69 98.21 98.21 DCF method was our principal valuation approach but we have also analysed trailing price
relatives of comparable firms.
From P/E 2018E 124.42 92.83 92.83
We found the most appropriate peer to be Finolex Cables since it is also engaged in
cables, lightings and switchgears. Majority of HIL’s business is in Lightings and Cables.
Lighting
Given the high marketing spend and the premium attached to the company’s products, HIL
has consistently posted higher Price to Earnings (P/E) ratios compared to Finolex. This
Max Median Mean
high relative P/E ratio indicate that HIL's stock will have a limited upside. HIL's historical
From P/E 2017E 87.44 67.68 67.43 performance indicates a CAGR of 39% over a 3-year period from INR 145.43/share to INR
392.45/share while that of Finolex’s CAGR is 87% from INR 65.95/share to INR 430/share
From P/E 2018E 80.11 61.01 60.62 over 3 years. This though proves that the company has been performing well but the
industry has been trading at a higher P/E with a premium attached to it.
ECD Also, a relative analysis was conducted among HIL's segmental and risk profile peers.
Bajaj Electrical and Crompton Consumer Electrical for ECD and Lightings are the most
Max Median Mean similar businesses.
Another measure for comparison is EV/EBITDA, which is appropriate in analysing the
From P/E 2017E 159.58 100.88 102.21 value of a company regardless of its capital structure. By using this method, the effect of
From P/E 2018E 141.88 95.58 94.63 depreciation policies is removed. An analysis of the EV/EBITDA ratios of these companies
reveals that HIL has been trading at a premium. The company has also provided higher
Havells India dividends as compared to its peers.
Financial Analysis
Max Median Mean
Strong revenue growth supported by solid industry growth
From P/E 2017E ₹ 570.40 ₹ 413.26 ₹414.32 The consolidated revenue of company has achieved growth almost entirely by company’s
From P/E 2018E ₹ 521.13 ₹ 385.92 ₹384.57 domestic business. With remaining 20% of Sylvania business expected to sell off soon, the
revenue CAGR is expected to improve further. Except the cable segment where due to
Source: Bloomberg
Important disclosures appear at the back of this report9
Financial Analysis
volatile copper prices the revenue growth is stabilised, other segments particularly MCB,
LED and ECD are expected to show high CAGR growth of c.12% in the 2017-2021 period.
Chart 5.1 : Forecasted Capex (INR bn) Backed by strong expectations, the volume sales are bound to increase. Though LED
3.35 segment is showing recent trends of price reduction, we believe that volume sales will
2.90
compensate for it as in India the market still has untapped regions and with growing GDP
2.60 and per-capita income, people will move towards efficient lighting in their homes.
Switchgear will continue to contribute maximum to revenue due to expected future growth
2.11 2.14
in this market. ECD Segment is expected to show highest growth in the product portfolio
Increasing margins with improvements backed by core operations
Sylvania business carried an unfunded liability of EUR 45mn. With this pension liability no
more expensed from income statement, the operating expenses are expected to improve
leading to better operating margins and net profit margins. Economies of scale and
distribution strength has enabled HIL to deliver superior margins, increasing margin from
11% in 2016 to 14.5% in 2021. The company has a number of pioneering incentives
2015 2016 2017E 2018E 2019E building a loyal dealership network vis-à-vis its peers. This is further strengthen due to
Source: Company Fillings, Student Research working capital cycle improvements. EBITDA CAGR is c. 10.7% and PAT CAGR is c. 13%.
Sustained RoE which can dip due to ineffective utilisation of cash
Though company has strong ROE performance, the increased cash on the BS is not
invested as the company is looking for acquisition target in ECD segment. This will see a
Table 5.1 : Estimating beta
dip in RoE as the leverage of the company is almost nil and the cost of equity is high. HIL
can improve RoE by equity buyback or increasing dividend payout ratio. But the model has
Co-variance 0.0078%
not assumed anything. The company has risen equity as & when required but it’s difficult
Variance of Sensex 0.0097% to see if the company will able to the same with debt as well. Currently it has low leverage
which it can use to reduce the cost of capital to increase its returns. It acquired Sylvania in
Beta 0.81 2008 when the leverage was low but wasn’t able to fully understand European markets.
Covariance has been calculated on 5 year daily returns Cash Generating Capacity is high
Due to high revenue growth, margin improvements and tighter working capital
Source: Bloomberg, Student Research management, the company is able to generate sufficient cash in the future to fund its
capex requirements as indicated by strong CFO/Capex ratios. This generation is despite
Chart 5.2 : DuPont Analysis the company paying constant dividend of INR 3 per share. This cash will be utilised in debt
repayment and maintain the dividend policy.
Valuation Ratios (x) 2015A 2016A 2017E 2018E 2019E 2020E 2021E
P/E 63.1x 47.8x 29.4x 25.9x 23.1x 19.9x 16.3x
P/Cash EPS 25.3x 45.8x 35.1x 25.4x 23.2x 20.9x 18.2x
P/BV 5.4x 5.9x 5.1x 4.2x 3.5x 3.0x 2.5x
EV/EBITDA 32.0x 28.4x 20.4x 18.3x 16.3x 14.4x 12.3x
EV/Sales 2.5x 2.7x 2.8x 2.5x 2.3x 2.0x 1.8x
Dividend Yield 1% 1% 1% 1% 1% 1% 1%
Earning Ratios (%) 2015A 2016A 2017E 2018E 2019E 2020E 2021E
EBITDA Margin 8.4% 10.5% 13.5% 13.8% 14.0% 14.3% 14.5%
Op. Profit Margin 6.8% 8.9% 12.0% 12.2% 12.6% 12.9% 13.3%
Net Profit Margin 4.5% 15.8% 9.9% 10.2% 10.4% 10.9% 11.5%
CFO/Capex 456.2% 248.2% 207.3% 368.5% 362.2% 350.9% 315.3%
ROE 21.2% 47.7% 24.4% 21.7% 19.6% 18.5% 18.4%
ROCE 22.4% 21.0% 23.2% 20.3% 18.5% 17.3% 16.7%
Source: Company Fillings, Student Research
ROA 7.6% 27.2% 18.5% 17.8% 16.7% 16.2% 16.6%
B/S Ratios 2015A 2016A 2017E 2018E 2019E 2020E 2021E
Current Ratio 1.3x 1.8x 2.5x 3.0x 3.5x 4.0x 4.6x
Table 5.2 : Target Share Price Estimation (INR) D/E 0.1x 0.0x 0.0x 0.0x 0.0x 0.0x 0.0x
Debtor Days 31.6 11.1 11.1 11.1 11.1 11.1 11.1
Method Weightage Price WxP Creditor Days 86.8 48.1 48.1 48.1 48.1 48.1 48.1
Inventory Days 60.9 52.1 52.1 52.1 52.1 52.1 52.1
DCF 60% 260.1 156.06 Working Capital Days 5.6 15.1 15.1 15.1 15.1 15.1 15.1
Asset Turnover 7.0x 7.0x 6.4x 6.4x 6.4x 6.4x 6.4x
Relative Valuation 40% 413.26 165.30
Per Share Data 2015A 2016A 2017E 2018E 2019E 2020E 2021E
Adj EPS 6.2 8.2 13.3 15.1 17.0 19.7 24.0
Target Price 321.26
EPS 6.2 19.7 13.3 15.1 17.0 19.7 24.0
CEPS 15.5 8.6 11.2 15.5 16.9 18.7 21.6
Source: Student Research
BVPS 72.1 66.5 77.2 92.4 110.8 131.9 157.7
DPS 3.0 3.0 3.0 3.0 3.0 3.0 3.0
Important disclosures appear at the back of this report10
Investment Risks
Risks Mitigating Factors Business Risk
Slowdown in Real Estate and Infrastructure Sector | BR1
Business and Strategy Risk With stagnancy being experienced by Real Estate developers, the Real Estate Sector
New Market Focus on Branding and Product is facing a rough patch. This might have a negative impact on the revenue of the
Entrants and Quality as consumers are moving Company, being demand for Switches, Cables and other products of the company,
cheaper towards purchases based on influenced by the growth of Real Estate and Infrastructure Sector.
substitutes could quality and Brand.
impact revenue Entry of New Market Players in Business Segments | BR2
With China being the second largest market for LED Lighting with around 25% of
Unable to tap into Introduction of new Brands to Global manufacturing capacity, the competition in the local markets might increase
New Markets of exclusively cater to the Regular and
Tier II cities having Economy Segment in the new resulting from imports from China. Also, the margins in the concerned business might
commendable markets, so as to capitalize without squeeze due to increased competition and availability of cheaper Chinese substitutes.
future potential cannibalizing sales of Premium Upcoming Market in Tier II and Tier III Cities | BR3
Brands in existing markets.
With the Company’s product portfolio priced premium amongst competitors, and with
Cannibalization of Transforming Production the premium perception amongst consumers, the Company might not be able to
sales resulting capacities, enabling them to service the growing market in Tier II and Tier III Cities with Reo and Reo Bliss Brands.
from technological produce the technologically
innovations upgraded products; meanwhile Regulatory Risk
venturing into new markets for Delayed implementation of GST | RR1
existing products
With the Goods and Service Tax Regime set to rise in India, a concrete date for
Technological Risk implementation of the new law is not yet clear. With the advent of the new Regime,
business is set to benefit from reduction in the compliances required as well as from
Import of key Undertake expansion for
components manufacture of components; in the
competitive tax rates, resulting from merging of the applicable Indirect Tax Laws. A
shorter run, mitigate exposure to delay for the Act to set in motion might squeeze the margins for a longer duration, as
price fluctuations by currency well as delay a much needed market stimulus.
forwards and price agreement
contracts. Technological Risk
Continuing Technological Constraints in LED Lighting | TR1
Disruptive Undertake expenses for developing With rapidly changing technology in the lighting business, there is a risk of
innovation in new products and upgrade existing
product lines by products with new features, so as technological disruption in the business. Apart from that, the LED Chips required are
competitors to satisfy the demand from the outsourced from other countries owing to IP constraints, poor infrastructure and
customers investment costs. Further, around half of the LEDs assembling are outsourced due to
Financial Risk volume and technology constraints.
Strategic Risk
Considerable Cash Investing cash balances in revenue
Balances at hand generating securities till a suitable Increased Market Exposure due to concentration in Indian Markets | SR1
for future expansion project is identified. A With the disinvestment from the foreign markets, the company has increased its
expansion special dividend can be considered exposure in Indian Markets. Although the disinvestment will lead to reduced
and raising funds as and when
opportunity is identified. consolidated losses from foreign subsidiaries, the over reliance on few markets might
lead into market saturation in the future.
Forex losses on Enter into Currency futures Expansion Plans might not be as effective | SR2
Future Divestment contracts to mitigate the foreign
of Sylvania currency risk arising due to inflows With two new plants under construction, the total production capacity is bound to
from future stake sale of Sylvania increase in the near future. Unfavourable market scenario might result in under-
Business utilization of total installed capacity, thus resulting reduced profitability due to higher
Operational Risk operational and maintenance costs w.r.t lower increase in contribution margin.
Financial Risk
Downtime caused Enter into insurance contracts and
by Fortuitous Performance based compensations Considerable Idle Cash in Hand realized from sale of Subsidiary | FR1
Events and plans, Plant Maintenance Contracts As on 31st March 2016, the Company held INR 14.7bn, of which INR 10.7bn resulted
Breakdown of to mitigate the potential losses from sale of 80% stake of Havells Sylvania Malta BV, a sub-subsidiary in Malta. The
Plants
cash reserves result in approx. INR 23.5 per share, which the management proposes
Risks arising from Formulate Gantt Chart and exercise to use for expansion plans in the foreseeable future. The quantum of unutilized cash
New Plants under control over work completed, and balances might result in lower profitability for the shareholders.
commission reformulate strategy for changes in
time line. Formulate strategy to
formulate market for increased
production. Implied Share Price Sensitivity to WACC and Terminal Growth Rate
Terminal Growth Rate
BR3 260.1 5.40% 5.70% 6.00% 6.30% 6.60%
Low Medium High
BR2 FR1 BR1
11.07% 294.01 307.09 321.72 338.19 356.87
Impact
SR2 RR1 11.69% 266.35 276.71 288.17 300.90 315.12
WACC 12.30% 244.02 252.43 261.63 271.76 282.95
TR1 SR1
12.92% 225.06 231.98 239.49 247.68 256.65
Low Medium High
Probability 13.53% 209.26 215.04 221.29 228.05 235.39
Source: Student Research
Important disclosures appear at the back of this report11
Appendix
Appendix 1A
Macroeconomic Outlook of India
• Government Spending: The Government of India, in tandem with its expansionary policies and Laws and on the back of a better
fiscal position, has taken steps towards stimulating growth in the Economy. The Government of India increased its Capital Expenditure to
INR 586bn for Q1FY16, at a YoY growth of 18%, with a CAGR 13.48% approx. from the Q1FY13 Capital Expenditure of INR 401bn.
Further, the Government has moved to make a higher allocation for its spending for Infrastructure development, which shall stimulate the
growth in the economy as a whole due to access better infrastructure.
• Inflation: India’s economic outlook with respect to inflation appears to be a big positive. The RBI Governors has successfully kept the
inflation rate in check with in the target range of 4% +/- 2% using its Monetary Policies, without hampering the growth potential of the
market. In the last 24 months, The average Urban and Rural Combined CPI is around 5.03%, with Urban CPI at 4.43% and Rural CPI at
5.54%. Moving around in the bracket of 3.5% to 6% in the time period, CPI has shown sharp movements with sustained momentum,
currently witnessing a downward spiral movement. With the recent 25 basis points rate cut in the repo rate, the Monetary Policy
Committee, headed by the incumbent RBI Governor, Dr. Urjit Patel has given a firm statement for the cause of economic growth,
keeping the inflation in check.
• Industry: The Industrial Growth story of India seems robust with more than Three-fourths of the months showing a positive growth in
the Index of Industrial Production (IIP) since April’14; and with an average increase of 1.7% in the IIP since April’15, the momentum is
only expected to continue in the future with a better monsoon than the last couple of years and positive government policies
• Savings & Investment: In terms of gross savings, there was 8.6% decline in household savings in 2015-16 which was more than
compensated by 17.6% increase in corporate savings resulting in constant ratio of 33%. Investment followed a similar pattern with a 15%
decline in household investments in 2014-15 marginally compensated by 5.1% increase in corporate investment resulting in 2.5%
decline in gross investment ratio
• Balance of Payments: Owing to increased FDI and decrease in oil prices, the BoP level has improved. There was a decline of 4.1%
in trade deficit levels in 2015-16 as compared to previous year. Healthy forex reserves restore the faith and certainty that India is well
prepared in advance for any future shocks most notably the chances of oil price surge
• Exchange Rate: The average exchange ratio was 66.25 in 2015, a 6.3% rise from 2014 level. This decrease in rupee value is due to
increase meltdown of global growth resulting in capital flight and less investments in country. It was further deteriorated by the rise in
demand for US dollar. But the damage has been contained due to recent RBI policies curtailing rupee depreciation
• Consumption: India has always been a consumption driven economy with its consumption trends matching to those of high income
countries. Post 2008 crisis, where the global consumption plummeted, India had a healthy consumption pattern. As per advance
estimates, provided by Economic Survey, maximum growth and contribution is given by private consumption with growth rate of 15.7% in
2015-16 and contribution of 60% to GDP
• Labour: The Indian Economic outlook looks positive in terms of labour force with a constant rising working-age population (15-65 years,
CAGR of 0.47% since 2001) and expenditure on education, ~14% of total Government Expenditure. A declining Employment to Working
Population Ratio coupled with increasing primary, secondary and tertiary education amongst the labour force has made available an
educated labour force, ready to exploit opportunities and driving growth in the future
Gross Savings and GCF (INR bn) Historical inflation trend (%)
34.6
34.3
33.8
33.4
33 33
31.6
30.8
2011-12 2012-13 2013-14 2014-15
Gross Savings Gross Capital Formation
Source: Economic Survey of India (2015-16) Source: Economic Survey of India (2015-16)12
Appendix
Appendix 1B
Switchgear Industry
• The electrical machinery industry in India is divided into three segments, namely (1) Generation machinery, (2)
Transmission machinery and (3) Distribution machinery
• Switchgear falls under the distribution machinery category and contributes about 16% of the revenue to the c. INR 1tn
industry
• From FY15 to FY22, the switch and control gear industry is set to grow at a CAGR of c. 20% and occupy nearly INR
550bn of the electrical machinery industry, outperforming the later by a huge margin
• The Indian switchgear industry manufactures the apparatus for the entire voltage range from 240kV to 800kV
• The exports market of the electrical machinery industry amounts to INR 340bn, driven mainly by the exports of cables and
boilers & parts. This provides an opportunity for the exports of cables by HIL while also opens us the possibility of
becoming an integral export
• The demand side growth drivers include capacity addition for power generation, increasing demand for backup equipment
and industrialization needs
• Government policies like de-licensing of power, reduction in tariffs ad customs and hike in duty on foreign products has
also lead to a favourable environment of growth
• Investments through increasing FDI inflows, entry of global players through joint ventures and ease of credit access has
meant that the dearth of capital is no longer a problem for the industry
India’s electrical equipment industry (INR bn) Share of major electrical equipment (2015)
966.4
710.2 723.9
646.8
490.2 499.8 506
352.6
2007 2008 2009 2010 2011 2012 2013 2015
Source: ibef Electrical Machinery industry report, October 2016 Source: ibef Electrical Machinery industry report, October 2016
Capacity addition in India in Five year plans (INR bn) Market size of switch & control gears in India (INR bn)
541.2
290.4
151.2
2015A 2017E 2022E
Source: Ministry of Power, Government of India Source: Department of heavy industry annual report13
Appendix
Appendix 1C
Cables and Wires Industry
• The wires and cable industry in India is divided into two segments, namely (1) Domestic Cables and (2) Industrial Cables,
with domestic cables forming 40% of the overall market and industrial cables forming 60% of the market and both the
segments have grown by CAGR of 6% over FY’11-15
• Wires and Cables falls under the distribution machinery category and contributes about 35.80% of the revenue to the c.
INR 1tn industry
• The industry is poised to grow at a CAGR of 7-8% till year 2019 with a thrust from infrastructure, telecommunication and
power sectors.
• The Indian wires and cables industry is highly fragmented and largely volume driven, the share of organised player is
increasing as consumers focus more quality and safety features which currently stands at 65% of the market size
• The exports market of the electrical machinery industry amounts to INR 340bn, driven mainly by the exports of cables and
boilers & parts. Cables constitutes 17% of the same
• The demand side growth drivers include capacity addition for power generation, pan India electrification.
• Wires and Cables market is highly price sensitive and operates o thin margins, and are largely linked to prices of copper
and aluminium
• Finolex is the market leader in the wires and cables industry and has pan-India presence, other players are Havells, RR
Kabels, KEI, V-Guard etc
• Dealer margins in the industry are in the range of 2-4%. Companies offers discounts on the MRP which is generally
passed on to the dealers.
Market shares in wires and cables industry in India (2015) Market size of wires and cables industry in India (INR bn)
Source: HDFC Sec Inst Research, Student Research
Source: HDFC Sec Inst Research, Student Research
Revenue of major wires and cables producers in India (INR bn)
Source: HDFC Sec Inst Research, Student Research14
Appendix
Appendix 1D
Lighting & Fixtures Industry
• Lighting sector contributes c.20% of the total energy consumption in India. The industry aims to reduce energy
consumption to 13% by 2020. This has led to an introduction of a series of energy efficient innovative lighting products.
Unorganised players forms 33% of the total market. The industry is classified into (i) Lamps (general lighting services
(GLS), fluorescent tube lights (FTL), compact fluorescent (CFL) and others) (ii) Luminaries (iii) Accessories, component
and gears (ACC) (iv) LED. From 2010-14, lighting industry grew at CAGR of c.17% whereas LED industry grew at 61%
CAGR proving that LED will drive the future growth of the industry
• The strong growth in lighting industry for the past 5 years has been due to movement from GLS lamps to CFL, and in the
future, the movement will be from CFL to LED (expected CAGR of 36% in 2015-20) supported by residential boom due to
rise in GDP and per capita income making LED products more affordable and government initiative to ban the sale of
incandescent lamps
• ELCOMA (Electric Light and Component Manufacturers Association of India) Vision 2020 aims to increase the domestic
manufacturing capability of LED lighting products to cater to increasing demand and reduce dependence on imports.
Currently India imports 100% of LED chips. As per ELCOMA, LED lighting will constitute ~60% (INR 216 bn) of the entire
lighting industry in India (INR 376 bn) by 2020. This is backed by government initiatives to replace all street lighting and
lights in public places to LED lights. The government launched the “100 cities LED based Domestic Efficient Lighting
Program (DELP) and National Street Lighting Program on 5th January, 2015
• Under the National Street Lighting Program, 35 million conventional street lights are to be replaced with energy efficient
LED street lights. The national DELP program also envisions replacement of 770 million incandescent bulbs with energy
efficient LED bulbs. Till date, EESL has successfully implemented the street lighting program and the DELP in 18 and 5
cities respectively
• LED bulbs cost between INR 160 and 300, CFLs INR 130 and 200 and Streetlights INR 85 per watt. The falling LED prices
and easy entry of consumer electrical equipment companies into this space has led to reduction in margins, but effect is
not severe due to cost of production showing similar decline
• Havells is focusing on high margin part of this segment. Due to this reason, the company has given the guidance of not
participating in government tenders until it can see the bulk orders providing suitable margins
Source: 18th Electric Power Survey, CEA
Source: ELCOMA Analysis
Source: HDFC Instl. Research Source: HDFC Instl. ResearchYou can also read