Indian Construction Costs A Biannual Review - July 2020 - Gleeds
←
→
Page content transcription
If your browser does not render page correctly, please read the page content below
Indian Construction Costs - A Biannual Review - July 2020

                        Indian
            Construction Costs
             A Biannual Review
                                          July 2020

July 2020                                                                  1
Indian Construction Costs - A Biannual Review - July 2020

            Note from the Managing Director

            The construction industry in India had benefitted from sustained growth in 2018 and 2019.
            Growth forecasts were equally good for 2020 and beyond, however, the onset and spread of
            the Covid-19, declared as a pandemic in January 2020, has forced all industries to rebalance
            themselves to remain commercially viable in the new evolving world. It is, however, important
            to reflect on what the industry looked like and analyse the way forward in the given situation.
            Distorted material supply, the reorganising of supply chains and the migrant labour exodus who
            will eventually return to construction sites post-monsoon / festive seasons have an impact on
            costs of construction as we know it. Newer technologies such as virtual construction, virtual
            reality, IoT sensors, prefabrication, touch-free controls are expected to take major strides in
            the near future.

            To cast more light on the industry trends, I am delighted to introduce a new biannual
            publication of Gleeds India which provides real estate professionals a catalogue for mapping
            Indian construction costs. This publication walks the reader through the overview of the Indian
            economy, insights on pre-Covid-19 material and labour cost trends and Gleeds’ insights on
            the various construction sectors’ cost outlook. There is also a reflection on the current market
            trends of the sectors and where they are likely to be post the Covid-19 situation.

            Whilst the change as a consequence of the pandemic is global, the ‘constant’ change
            for Gleeds India has been the zeal to upskill our knowledge base and assist in upscaling
            the industry. The full impact of Covid-19 on projects, design and cost are yet to be fully
            established. However, Gleeds India will be closely monitoring its effect on all aspects of the
            construction cost, time and process in the months to come which would allow our clients to
            make informed decisions.

            I sincerely hope that this publication will be insightful and adds value to your outlook of the
            industry in the present times.

            Ben Huskisson, MRICS.
            Managing Director

July 2020                                                                                                                        2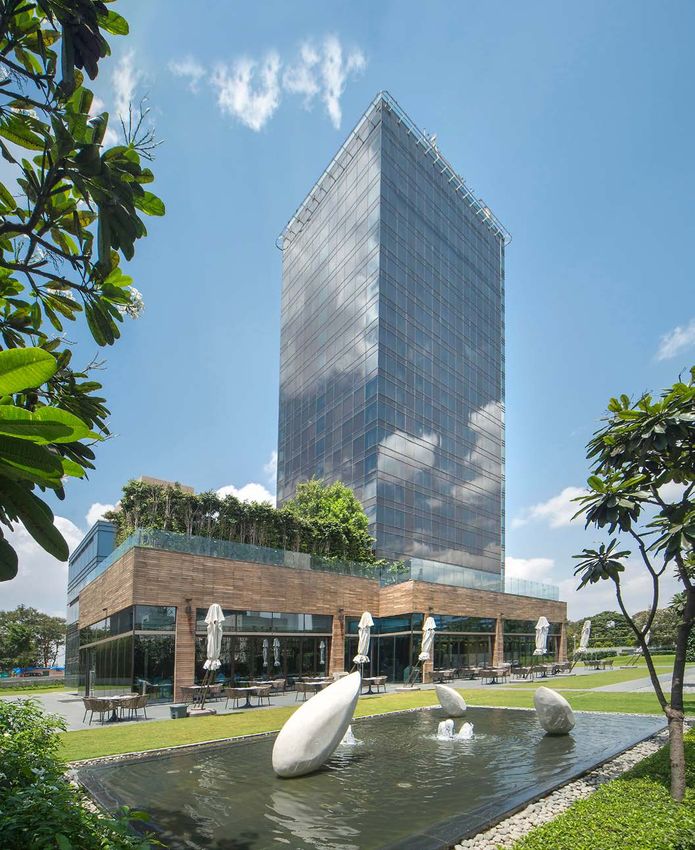
Indian Construction Costs - A Biannual Review - July 2020

            Contents

            04   Economic Outlook
                                       20   H1 2020 Construction
                                            Costs: Sector wise

            08   Key Price Trends
                                       24   City Cost Indices

            11   Material Prices
                                       26   Industry Transformation

            13   Labour Rate Trends
                                       28   Look Ahead

            16   Construction Sector
                 Outlook               30   References

July 2020                                                                                          3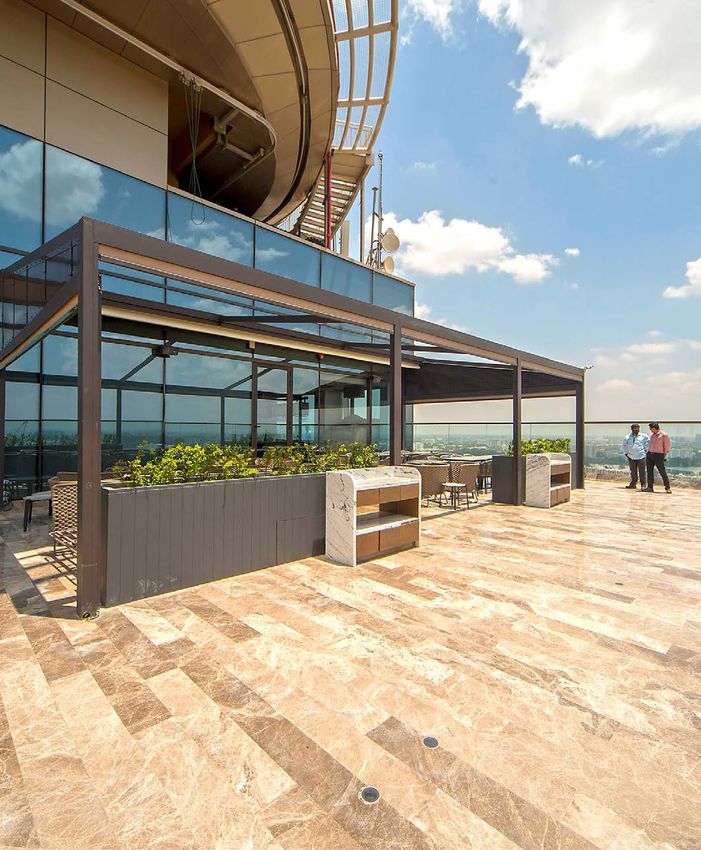
Indian Construction Costs - A Biannual Review - July 2020
Economic Outlook
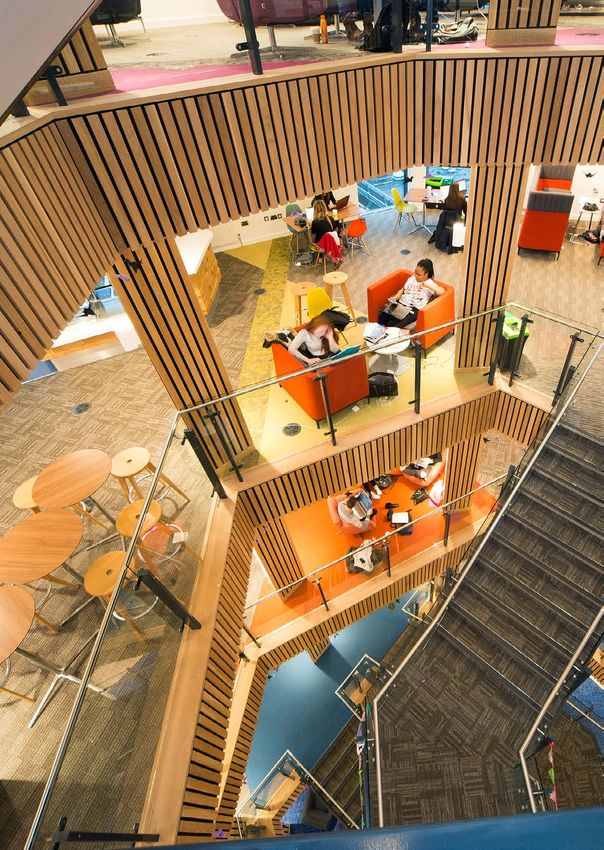
The Den Hotel, Bangalore
July 2020 4
Indian Construction Costs - A Biannual Review - July 2020

Summary of the Indian
Economic Outlook

The Indian economy no different to the global economy         of labour has influenced the anticipation of return of
has been in a turmoil as a consequence of the Covid-19        normalcy to only be in Q1 2021.
outbreak, declared by the WHO on the 30th of January
2020 as a global emergency. Like other countries, India’s     The IMF in mid-April predicted that the growth rate is likely
economy also depends on the control of the pandemic           to bounce back to 7.4% in 2021, if the virus is contained.
spread.                                                       This is quite positive as India is one of the few economies
                                                              that show expansion despite the pandemic avalanche.
As a result of the pandemic, uncertainty clouds forecasts,
however, the global economy is projected to contract          The employment rate estimates by Centre for Monitoring
sharply by –3 percent in 2020, much worse than                Indian Economy (CMIE) show that unemployment shot
during the 2008–09 financial crisis as reported by the        up to 24% for the week ending on the 17th of May 2020
International Monetary Fund.                                  which then rapidly fell to an average 11.1% in the last
                                                              week of June 2020, following the ease of lockdown
In India, there are various constraints faced by businesses   regulations.
today. The lockdown and the complete close of business
for a month, for some cities even more, the drop in           India’s economy is on its path to recovery, with small and
demand, disruption in the supply chain, a credit crunch,      medium scale businesses, construction sites, travel and
non-availability of access to raw materials and movement      restaurants all slowly recommencing.

                                                                                           Taj Vivanta - Yeshwantpur, Bangalore

July 2020                                                                                                                         5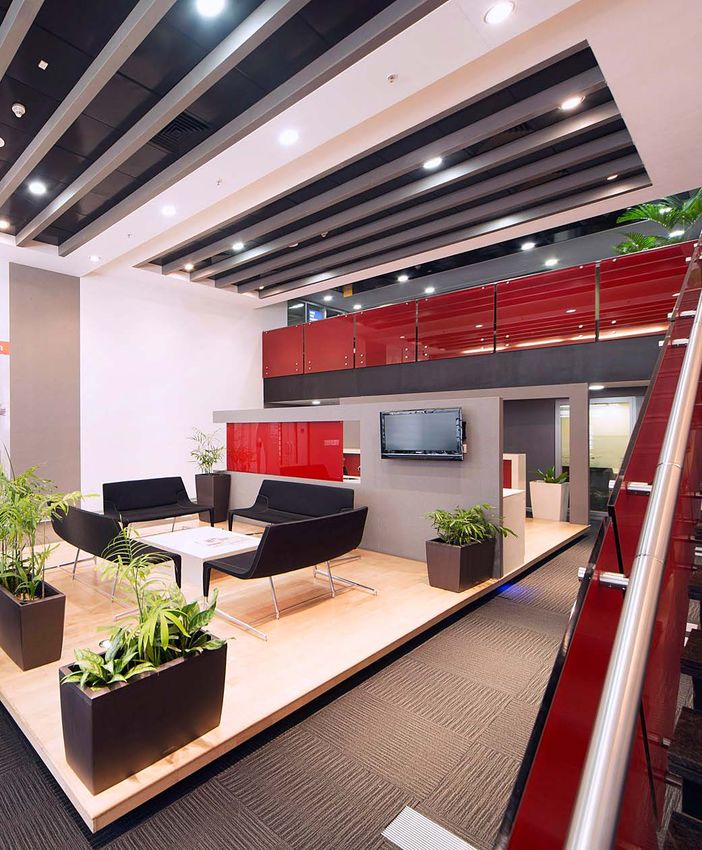
Indian Construction Costs - A Biannual Review - July 2020
H1 2020 Economic Overview
GDP Projections Y2020
4.20%
4%
The lockdown implemented from the end of March into logistics, facility management, finance, insurance, and
May 2020, weighed the Indian economy down. The 1.90% manufacturing sector given the increase in demand
Government has tried to ease out on small businesses following the COVID-19.
1.00%
0.80%
with the aim to lighten the weight on the economy,
however the adverse effect of the lockdown is yet Informal labour, however, are0.20% seen to commence work
-0.40%
unknown. IMF immediately
World Bank ADB post
Fitch the lift
SBI in regulations,
Moody's UBS being mostly daily
wage workers.
Gross Domestic Product (GDP) Unemployment Rate
30% 24.95 25.79
23.52 23.48
25%
GDP in the year 2019 was 4.2% and in the given 20% 22.89
22.48 12.38
circumstances dropping as per the predictions of 9.41
11.13
15% 9.7 8.65 8.75
global economists demonstrated in the graph below. 9.02
7.6 7.22 7.76
10%
10.56
5% 8.44
GDP Projections Y2020 6.93 6.06 7.34
0%
4.20% Dec-19 Jan-20 Feb-20 Mar-20 Apr-20 May-20 Jun-20
4%
Rural Unemplyment Rate Urban Unemployment Rate India
Source: CMIE
1.90% Reported as on 28th June 2020.
1.00%
0.80%
0.20%
-0.40% Inflation
IMF World Bank ADB Fitch SBI Moody's UBS
The inflation rates in India have once again fluctuated
with the Covid-19 crisis. It averaged 5.98 percent from
2012 until 2019, reaching an all-time high of 12.17
Unemployment Rate percent in November of 2013 and a record low of 1.54
Unemployment
30% 24.95 25.79
percent in June of 2017. The growth was estimated to
23.52 23.48
25% be steady from 2020 as noted below, until the outbreak,
the projected rate of inflation for the year 2020 is
20% 22.89
The rate of unemployment had increased to 23.48%
9.41 22.48 estimated
12.38to be 3.34%:
15% as reported by
in May 2020 9.7the 8.65
Centre for Monitoring
8.75 11.13
9.02 Inflation rate year on year
Indian Economy. This 7.22 over7.76
7.6 reduced June once there
10% 12%
was an ease in the lockdown regulations, falling to 10.56
8.44 10%
17.2% in the
5% first week of June and then 11.1%
6.93 6.06 7.34 end
of June 2020. 8%
0%
Dec-19 Jan-20 Feb-20 Mar-20 Apr-20 May-20
6% Jun-20
The job market does look grim this year. The
4%
corporates areRural
notUnemplyment Rate
sure what the Urbanand
future holds Unemployment
are Rate India
2%
rationalising their sector. There is a reported optimism
that job seekers may find relief towards the end of 0%
2011 2012 2013 2014 2015 2016 2017 2018 2019 2020 2021
this year, with medium and small size enterprises
Source: Statista
hiring. There also may be better opportunities in the
Note: As per the source, year 2020 and 2021 are estimates.
July 2020 6
Inflation in % WPI and CPI
12
10
4%

                                                       2%
                                                                                                Indian Construction Costs - A Biannual Review - July 2020
                                                       0%
                                                              2011       2012     2013     2014      2015     2016     2017      2018      2019    2020        2021

WPI and CPI

Both wholesale price index (WPI) and
                                                                                        Inflation in % WPI and CPI
the consumer price index (CPI) are
                                                       12
the change in the price of various
goods or services in the economy,                      10

where the wholesale price index                        8
measures the percentage change in                      6
the price in wholesale index, while
                                                       4
consumer price index measures the
                                                       2
percentage change in the price in
retail market and hence it is more                     0
useful for consumers rather than                       -2
businessman.
                                                       -4
                                                            2013-2014    2014-2015       2015-2016    2016-2017      2017-2018    2018-2019       2019-2020
                                                                                                                                                  Provsional
The graph demonstrates the inflation                                                     WPI (in %)              CPI (in %)
for wholesale price index and
consumer price index as noted by the
                                                                                                            Source: India Budget Economic Survey Report,
Indian Government. Also noted, the                                                                            The Government of India, Ministry of Finance
2019-2020 is provisional.

 $ USD to INR                                                                               Average USD to INR
                                                       80

                                                                                                                                                  74.12
                                                       75
                                                                                                                                   70.39
The graph is a trends graphs USD                                                                                       68.4
                                                       70                                   67.17
to INR, averaged. The Rupee in April                                            64.12
                                                                                                         65.1
2020 showed an all-time low of about                   65
                                                                  61
                                          USD to INR

77 a Dollar, and was predicted to                      60
reach a high of 80 end of June 2020,
                                                       55
however, it closed at 75.53 a dollar on
the 30th of June 2020, to average to                   50
about 74.12 a Dollar for the first half
                                                       45
of the year.
                                                       40
                                                                 Y2014          Y2015       Y2016       Y2017         Y2018        Y2019          Y2020

                                                                                                Source: XE Currency Charts as on the 29th of June 2020.

                                                                                                                                        Marks & Spencer

July 2020                                                                                                                                                      7
Indian Construction Costs - A Biannual Review - July 2020

            Key Price Trends

                                                            Nokia

July 2020                                                            8
Indian Construction Costs - A Biannual Review - July 2020

Key Price Trends

The price trends for the most used material in the industry are set to change as a result of the effect of the Covid-19
pandemic. Prior to March 2020 of commonly used construction material price trends are demonstrated below:

Steel Prices in Major Cities:
                                                  AVERAGE STEEL PRICE IN INR / YEAR
                          4,00,000

                          3,50,000

                                                                                                  56,850
                          3,00,000
                                                                                                                            51,595
                                        49,475                                                                     49,025
                          2,50,000                                                   45,200       57,525
                                                   41,000                                                                   52,200
                                        49,475                      39,500                                         49,375
                          2,00,000                                                   45,750       56,650
                                                   40,975                                                                   50,445
                                        50,875                      39,425                                         49,553
                          1,50,000                                                   45,375
                                                   43,275           38,400                        56,950
                                        49,475                                                                     49,700   52,700
                                                                                     45,250
                          1,00,000                 41,200           39,500
                                                                                                  55,825           50,230   53,799
                                        50,000                                       44,875
                                                   40,375           40,700
                           50,000
                                        49,425     42,025           38,400           45,375       56,650           49,753   53,312
                                -
                                         2014        2015            2016             2017         2018             2019     2020

                         Sources: Sail. Note: All year prices are averaged and in INR, and Sail have last updated rates in June 2020.
                                                                                                               All prices include GST.

As reported by the Economic Times, cement and steel sector output declined by 86% and 83% respectively in April 2020.

Diesel Prices In Major Cities:

                                                     AVERAGE PRICE IN INR / YEAR
                       450.00
                       400.00
                                                                                                  73.18            72.32     72.05
                       350.00
                                     60.53                                         61.86
                       300.00                                     57.84                           68.04            68.58     68.21
                                     60.22       53.12
                       250.00                                     55.35            57.38
                                                 51.55                                            69.87            68.50     68.38
                       200.00        62.74                                         59.51
                                                                  57.24
                                                 53.64                                            70.38            70.13     69.32
                       150.00        59.24                        54.55            59.23
                                                 50.01
                       100.00        55.56                                                        66.57            66.44     68.66
                                                 47.79            53.24            57.12
                        50.00
                                     63.71       54.56            59.02            59.92          70.64            69.63     69.10
                         0.00
                                     2014        2015             2016              2017          2018             2019      2020

                                                 Mumbai (Rs./Ltr)         Delhi (Rs./Ltr)      Chennai (Rs./Ltr)
                                                 Pune (Rs./Ltr)           Banglore (Rs./Ltr)   Hyderabad (Rs./Ltr)

   Source: My petrol price. Average price per year considered. For the year 2020 average price up until the 29th of June considered.

July 2020                                                                                                                                                    9
Indian Construction Costs - A Biannual Review - July 2020

Price Trend Indices for Cement:

                                                                                           Average Rate Excl Tax
The graph shows a price trend for              260
                                                                                                                                                255
cement prices in Mumbai. In 2019,              255
even with the rise in demand, cement           250                                                       247
prices hiked and is said to have               245
                                               240
achieved it highest production level,
                                               235                                 231
with capacity utilisation of 78%.              230                                                                       225
                                                               224
                                               225
                                               220
                                               215
                                               210
                                               205
                                                              2015                 2016                 2017             2018                   2019

                                                                                 Source: Gleeds Internal Data (Mumbai). Prices are in INR and exclude GST.
                                                                                              Note: Price does not account for the impact of the Covid-19.

Aluminium and Copper:
                                                7000        6663.87
                                                                                                                    6549.00
                                                                                                        6209.25                   6054.13
The consumption of Aluminium                    6000                     5413.75
                                                                                                                                                  5250.25
and Copper is muted following the                                                         5010.38
                                                5000
lockdown and the drop in demand
and the full benefit of the drop in             4000
prices has been of no advantage for
the industry.                                   3000
                                                                                                        2050.00     2022.13
                                                            1823.00
                                                2000                     1630.50          1619.38                                 1797.63
                                                                                                                                                  1492.37

                                                1000
                                                                                                                                     Copper (USD)/Tonne
                                                                                                                                     Aluminium (USD)/Tonne
                                                     0
                                                            Y 2014        Y 2015          Y 2016        Y 2017      Y 2018        Y 2019           Y 2020

                                                                                                                Source: London metal exchange
                                      Prices noted are in USD and are averaged for the year and for year 2020 averaged up until the 29th of June.

Crude Oil:
                                                                                      CRUDE OIL (USD/BARREL)
Crude oil impacts inflation largely
                                                100.00
because of the manufacturing of raw                                   93.67
materials depends on it. Though ideally           90.00

construction materials like cement,               80.00
paints, glass, plastics, PVC pipes and            70.00                                                                             65.13

rubber prices move in tandem with the             60.00                                                                67.75
price of crude oil, other factors like, the       50.00
                                                                                                           53.73
present drop in demand, disruption of                                         50.39          49.54
                                                  40.00
supply of other raw materials and labour          30.00                                                                                               36.11
shortage has negated the advantage of             20.00
the price drop.                                   10.00

Additionally, transportation costs is                0.00
                                                              Y 2014          Y 2015        Y 2016        Y 2017      Y 2018        Y 2019          Y 2020
impacted majorly by crude prices,
however, with change in Government                                                                                                          Crude oil (USD/Barrel)
taxation, the benefit is not realized by
the end-user.                                                                                                                   Source: Country economy data

July 2020                                                                                                                                                            10
Indian Construction Costs - A Biannual Review - July 2020
Material Prices
The Den Hotel, Bangalore
July 2020 11Indian Construction Costs - A Biannual Review - July 2020
Material Prices
Material prices in various cities:
Description UoM Mumbai Delhi Bengaluru Hyderabad Chennai Pune
Cement
Grade 43 INR/MT 6,800 6,800 5,840 6,800 6,400 6,000
Steel
Reinforcement INR/MT 42,000 43,000 40,750 43,200 42,500 40,000
Structural Steel INR/MT 48,000 48,000 48,000 46,000 47,000 46,560
Clear Glass
6mm INR /Sqft 68 68 82 66 70 68
8mm INR /Sqft 88 88 102 86 90 88
Stone
Granite INR/ Sqft 150-250 120-250 90-250 90-250 115-250 115-250
Marble INR/ Sqft 220-500 220-500 180-500 175-500 150-500 180-500
Makrana INR/ Sqft 250-1000 250-1000 250-1000 250-1000 250-1000 250-1000
Kota INR/ Sqft 40-50 30-40 40-50 40-50 40-50 30-40
Cuddappa INR/ Sqft 20-25 20-25 15-25 15-25 20-25 15-25
Wood
Salwood INR/ cuft 1,650 1,550 1,250 1,600 1,250 1,050
Plywood
INR/ sqft 67 63 70 63 61 64
12mm thick
Paints
Emulsion INR/ 20 ltr 3,200 3,000 3,200 3,300 3,400 3,360
Electrical Wires- Copper
1.5 sq mm FRLS
INR/mtr 15 14.5 14 14 14 13.5
Cu wire
2.5 sq mm FRLS
INR/mtr 23 22.5 22 21.5 21.5 21.5
Cu wire
4 sq mm FRLS
INR/mtr 33 32 31 31 30.5 30.5
Cu wire
Electrical Al cable
4Cx 2.5 Sqmm
INR/mtr 67 65.5 63.5 63 62 62
Al. Ar. Cable
4Cx 4 Sqmm
INR/mtr 72 70.5 68.5 67.5 67 67
Al. Ar. Cable
Electrical Cu Cables
4Cx 1.5 Sqmm
INR/mtr 85 83.5 81 80 79 79
Cu.. Ar. Cable
4Cx 2.5 Sqmm
INR/mtr 118 115.5 112 111 110 110
Cu. Ar. Cable
4Cx 4 Sqmm
INR/mtr 160 157 152 150 149 149
Cu. Ar. Cable
Source: As per Gleeds’ database in the month of June 2020 unless noted otherwise. All prices exclude GST.
All prices are supply prices and a guidance only. Transportation, and any other abnormals are not included.
July 2020 12Indian Construction Costs - A Biannual Review - July 2020
Labour Rate Trends
July 2020 13Indian Construction Costs - A Biannual Review - July 2020
Labour Rate Trends in Various Cities
The beginning of the lockdown at the end of March 2020, at the earliest as most are daily wage workers, it is also
saw a set of alarmed migrant labour, leave the cities to understood that the most labour, will have reservations
reach their homes in the hope of safety and security. on returning to Tier 1 cities following the failure to
When the rules we relaxed towards the end of May, most flatten the COVID-19 curve. The return of labour full
migrant labour left the cities back to the suburban small time to construction sites is only estimated post Diwali,
towns and villages. While, the labour will commence work anticipating no second wave of pandemic.
Note: Costs do not account for the impact of Covid-19. Rates for 2020 are as on Feb 2020. Rates are in INR and are daily wage rates.
1. Mumbai: 2. New Delhi:
544 569
544 571
495 534
591 479 689 534
462 692 368
591
541 648
525 648 New
Mumbai 448 Delhi
509
482 Year 2020 407 Year 2020
498 Year 2019 588 Year 2019
514 Year 2018 588 Year 2018
564 Year 2017 629 Year 2017
564 Year 2016 626 Year 2016
Unskilled Semi-Skilled Skilled Unskilled Semi-Skilled Skilled
Source: Minimum Wage-India Source: Minimum Wage-India
3. Chennai 4. Hyderabad:
350 330
327 330
327 319
313 317
450 291 478 368
421 478
421 462
403 Chennai 377 Hyderabad
375 448
Year 2020 Year 2020
338 407
364 Year 2019 345 Year 2019
380 Year 2018 376 Year 2018
380 Year 2017 390 Year 2017
406 Year 2016 390
Year 2016
Unskilled Semi-Skilled Skilled Unskilled Semi-Skilled Skilled
Source: Chennai.nic.in Source: Minimum Wage-India
July 2020 14Indian Construction Costs - A Biannual Review - July 2020
5. Bengaluru: 6. Pune:
385
385 493
358 493
414
332 385
405 310 539 325
405 539
377 488
350 Bengaluru 456
424 Pune
325
Year 2020 Year 2020
317 346
341 Year 2019 372 Year 2019
367 Year 2018 443 Year 2018
395 Year 2017 Year 2017
512
395 Year 2016 512 Year 2016
Unskilled Semi-Skilled Skilled Unskilled Semi-Skilled Skilled
Source: Minimum Wage-India Source: Maharashtra Jeevan Pradhikaran
Post Covid-19 following a survey that was conducted by Gleeds in
the 2nd week of May 2020, it is noted that the labour rates were
predicted to increase by more than 10%.
Migrant labour has been badly hurt in the present crisis. cities. Government aid including a three-month wage and
The complete lockdown on March 24th that came as supply of essentials like oil and rice, now announced till
a surprise to the entire nation, left the labour stuck in the end of November 2020, have prompted labour to stay
large cities with little or no means to fend for themselves. on in their hometowns. In the current monsoon season,
This brought about an exodus of labour on foot to their work progress is slow and the labour are perceived to
villages. Post the relaxations of lockdown measures late only return post monsoon, after the Diwali festivities when
May, most labour found their way back home and have the seasonal demand of the agricultural sector is over, the
commenced the seasonal agricultural jobs, refusing COVID-19 crisis is curtailed or contained and the need to
to return for large work on construction sites in bigger earn resurfaces.
July 2020 15Indian Construction Costs - A Biannual Review - July 2020
Construction Sector
Outlook
Vivanta by Taj, Coromandel, Chennai
July 2020 16Indian Construction Costs - A Biannual Review - July 2020
Construction Sector Outlook
The construction industry was on an upward trend in 2019.
Residential Sector
All sectors were flourishing, especially the commercial and
residential sector. India also jumped to the 63rd position in Residential sector was also on the road to improvement,
World Bank’s ‘Ease of Doing Business 2020’ report, both with the pickup of affordable and mid-range homes, while
reflecting and attracting the confidence of local and global the premium and ultra-premium was left more to end
entities. user requirements. The Indian Government had created
an alternative investment fund of INR 250 Billion for last-
mile funding of 1,600 stalled housing projects. GST rates
Commercial Sector
were slashed from 8% to 1% for affordable homes and
There was a rise in IT companies across the country with 12% to 5% for regular units in March 2019 to make under
companies basing themselves in prominent cities like Delhi, construction projects more attractive. Housing prices
Mumbai, Bangalore, Hyderabad, Chennai and Pune. The however remained stagnant in the year and the growth
demand for commercial buildings rose and the supply was rate was about 1%. However, it is understood that the IT
less, which brought about a higher rental cost, which in hub cities like Mumbai, Hyderabad, Pune and Bangalore
turn brought about a good return in investment. showcased a slightly higher growth rate in comparison to
the other cities.
This sector was reported to have received $2.9 billion
investment from private sectors in the year 2019. Office
assets were continuously growing, and investment was Impact of Covid-19: Medium Impact
providing stable returns. There has also been a 40% growth
in the sector for both leasing and pre-leasing.
Home loan collection has plummeted in March
2020, an effect of the pandemic. Residential
bookings fell by about 78% as compared to January
Impact of Covid-19: Medium Impact
2020. There have been 6.4lakh unsold units and
4.7 lakh units yet to be completed nationwide in
Delayed decisions on occupancy and hesitation the last quarter. The RBI has allowed a 3-month
to rent or buy spaces brings this sector into an moratorium on term loans till May 2020, which was
uncertain standstill with no new revenue generation. then further extended will August 2020, expecting
The productivity of ‘work from home’ or WFH has to release some pressure off the developers as
increased in the lockdown period and there is a sure well as home loaners, however their cash outflows
possibility of reduction of the seat-based leases in the long run maybe negated due to the stalled
as a consequence of more staff availing the WFH projects. The housing demand is seen to decline
option. Offices are also now relooking into office as investors might shy away in locking their capital
space redesign or refurbishment to accommodate in physical assets in an unstable environment. With
the social distancing and health and hygiene norms. the overhanging job uncertainties following lay-offs
There will be delays in the completion of office and salary cuts home buyers may withhold till more
spaces due to revised operating procedures (design promising times, posing a challenge to the housing
related such as upgrading HVAC and workspaces), sector. There also now is an interest towards
disrupted supply chain and the unavailability of township following a desire to live in a controlled
labour. Newer project propositions maybe withheld environment. Tier II and Tier III cities may see a
considering the present uncertainty. Firms are likely rise in the demand for housing long term following
to opt for centralized operations and consolidate reverse migration and the reservation to move back
their space holdings to cut costs and optimize work into a crowded Tier I city.
operations.
July 2020 17Indian Construction Costs - A Biannual Review - July 2020
Hospitality Sector
Impact of Covid-19: High Impact
The market size of hotel industry in India (including
unorganized market) is estimated at $22 Billion in 2019,
growing at 8.6% till 2025. In the past few years, the year on According to a Retailers Association of India report,
year growth rate has been about 7%. The tourism market by end of February itself, the business had dropped
in India has picked up which had a direct bearing on the by 20% to 25% and in March the business has
demand for the hotel, increasing the occupancy. There reduced to only 15% of the average yearly business.
was a reported 70% to 80% occupancy in 2019, while only ICRA estimates rental expenses form a sizeable
60% is required to being in a good return of investment. share of 12% to 16% of revenues for retailers,
Rapid urbanisation also saw the rise of tier 3 type hotels therefore, all tenants are likely to negotiate for
and many hotel managements companies have started waiver or rebate of the rentals. Retailers Association
setting up in smaller towns. The rise of the economical of India states that India is staring at a scenario
hotels has pumped in large revenues. where 30% of the retail stores would shut down,
leading to 1.8 million people losing their jobs. The
spending capacity of customers has reduced in turn
affecting the sector. Having said that, the essentials
Impact of Covid-19: High Impact and pharmaceutical industry is adjusting to over
demand and the practice of hoarding. Though malls
and other large retail have reopened, there seems
This sector which is heavily dependent on the trade,
to be a big customer reservation against visiting
travel and tourism, has come to a sudden standstill
public places despite the all health and hygiene
post the global travel bans and prolonged lockdown
precautions being in place.
in India. Employees have been laid-off and the
indefinite timeline for reopening has brought this
sector to a standstill. The sector is seen to be now Healthcare Sector
functioning at about 15% capacity, with occupancy
consisting of people who are quarantined or medical The healthcare sector has been growing steadily in the past
personnel. The drop of revenue for the industry is few years and has become one of India’s biggest sectors.
expected to range from $4.2 to $4.7 billion with the The market was estimated to increase three-fold by the
most affected regions being Bengaluru, Mumbai, Indian Brand Equity Foundation (IBEF), with a promising
Delhi & Gurugram. The first to recover post the slight scope for the contribution to the country’s GDP, which is
relaxations maybe the economy and mid-scale presently 1.15% of the total GDP.
hotels, following the reopening of the manufacturing
units in small towns and the agricultural sector.
While this sector is adversely affected in other parts Impact of Covid-19: Medium Impact
of the world, 80% of India’s revenue is generated
from domestic travel which may pick up faster when The healthcare system has also been impacted
the COVID-19 curve is flattened. during the ongoing crisis. The unprecedented
situation has challenged the sector to provide and
support the unforeseen needs. The government
Retail Sector sector has now been supported by the private
sector to cater to the COVID crisis. The sector
This sector seemed to have struggled in the past year is experiencing a deficit on the requirement of
2019. The leasing activities reduced across the major equipment, consumables and resources such
cities and the level of vacancy fell slightly from the previous as beds, ventilators and manpower and is still
learning to cope with the rise in safety and hygiene
year. The retail industry however attracted private equity
requirements to prevent the contraction of the
investments from around the world totalling to around
Virus. Along with this however, there is a significant
1billion US dollar, which seemed to be a promising market drop in the outpatient and surgery requirements,
for the international retailers. more based of the psychology of possible patients.
This trend is expected to continue for the next
6 months, in anticipation that a more permanent
solution to the COVID crisis is found.
July 2020 18Indian Construction Costs - A Biannual Review - July 2020
Pharmaceutical Sector Manufacturing Sector
India’s Pharmaceutical sector is the largest producers of This sector accounted for about 16.8% of India’s total
vaccines in the world and is a generic provider of drugs GDP as per the Ministry of Statistics and Programme
globally. It supplies over 50 per cent of global demand for Implementation (MoSPI). Both domestic and International
various vaccines, 40 per cent of generic demand in the US Investments in the Indian manufacturing unit have been on
and 25 per cent of all medicine in UK. The projection of the the rise. Government policies such as ‘Make in India’ and
industry was at about 10-12 percent in the next five years sector specific investments in various companies aim to
leading the country to be amongst the top ten in world make India a global hub. The introduction of GST evened
for medicine spending. The Government with the vision to out the tax complications and served as a big attraction for
make India the world leader in end to end production of foreign investors.
pharmaceutical products, introduced the Pharma vision
2020, with the goal to systemise the process.
Impact of Covid-19: Low impact
Impact of Covid-19: Medium Impact
It may be noted that these units though slowing
The active pharmaceutical ingredients also known down maybe the sector which will be running
as API’s are mostly sourced by India from China. through and post Covid-19 crisis. There would be
Post COVID-19, the supply of this has gone into a demand for locally made and sourced materials
an acute shortage. It would be prudent for the
allowing the sector to find a new path for growth.
country to now look to source this APIs locally to
With China being the epicentre of the pandemic,
bridge the gap between the supply and demand
of the pharmaceuticals that it is set out to produce it will be natural that the global market might look
and export. The breakthrough may allow India to for other alternatives. India was already preparing
be the global option which will boost the industry to boost its manufacturing sector, and the policies
significantly. The policy of ‘Pharma India 2020’ and taxations have already been implemented to
was aiming to make India the no 1 manufacturing ease business, opening opportunities to global
industry for end to end pharmaceuticals investors to consider India for its manufacturing
manufacturing. The rise in sales is likely to bring up base. Having a growing strength of working
the demand for pharmaceutical manufacturing units. population, this sector has a potential to surge.
Data Centres
With the present work from home options the
India in the past two years India has grown in the usage requirement for data storage has risen, replacing
of data centres, following most of the IT sectors moving server- based systems. Data centres are also
their infrastructure to cloud. Increased digitalization efforts now a welcome and necessary option for most
of the Indian government and plans for smart cities is companies considering the amount of data
another driver. Data localization mandates driven by the generated as a result of WFH options being used.
government has also led to increased regional presence This overwhelming data pressurises a company’s
by the MNCs and big tech companies like Google, in-house capabilities paving a path for the use
Apple, Amazon/AWS, Microsoft, Facebook, as well as of data centres. The pandemic, uncertainty,
e-commerce giants. It is also noticed that Mumbai has the and isolation have made storage and dispersal
highest use of data centres accounting for the nearly half of digital data pivotal in preventing the global
of India’s usage. The financial sector also was looking at economic system from collapsing. Even before the
an increased demand in data storage following the RBI outbreak, the global focus had already shifted to
mandate on use of servers located in different parts of the AI, cloud storage and IoT. Flexibility of usage and
country. payment, such as pay as you go, allows for less
initial investment from a company’s point of view
and the is more economical with very little space
Impact of Covid-19: Low impact constraints. The usage of data centres are more
likely to rise now as most companies are relooking
into their digital infrastructure and moving towards
the use of data centres.
July 2020 19Indian Construction Costs - A Biannual Review - July 2020
H1 2020 Construction
Costs: Sector Wise
Marks & Spencer
July 2020 20Indian Construction Costs - A Biannual Review - July 2020
H1 2020 Construction Costs: Sector Wise
Sector Wise Costing:
Assumptions for Bengaluru Pune Delhi
Building Type
Costs ₹ / Sqft ₹ / Sqft ₹ / Sqft
Residential
Affordable BUA: 3,00,000 sqft 1,950 to 2,300 1,900 to 2,200 2,290 to 2,715
Premium BUA: 6,00,000 sqft 2,460 to 3,305 2,460 to 3,305 3,200 to 3,600
Commercial Building
Commercial BUA: 10,00,000 sqft 2,350 to 2,800 2,700 to 3,000 2,950 to 3,400
Office Fit-out Note: Costs based on carpet area for office fit-outs only.
Basic CA: 15,000sqft 2,000 to 2,400 2,000 to 2,300 2,000 to 2,500
Standard CA: 30,000sqft 2,600 to 3,200 2,400 to 3,200 2,600 to 3,400
Premium CA: 50,000sqft 4,000 to 7,000 4,000 to 6,500 4,000 to 7,200
Retail
Malls with retail stores 2,415 to 2,800 2,375 to 2,750 2,400 to 2,950
Store fit-out costs on carpet area
Quick Service Restaurants CA: 2,500 sqft 2,750 to 3,200 2,700 to 3,150 2,900 to 3,300
Apparel stores CA:25,000 sqft 2,000 to 2,300 2,000 to 2,200 2,150 to 2,450
Discount sports store CA:25,000 sqft 1,250 to 1,800 1,200 to 1,750 1,500 to 1,900
Jewellery CA: 8,000 sqft 5,000 to 6,500 4,800 to 6,200 5,500 to 7,000
Hospitality
3 star Hotel 100 key 3,800 to 4,650 3,400 to 4,500 4,600 to 5,500
4 star Hotel 150 key 4,650 to 5,500 4,250 to 5,100 5,950 to 6,800
5 star Hotel 150 key 6,800 to 8,500 6,300 to 7,800 7,500 to 9,000
Healthcare
Hospitals 500 bed capacity 4,500 to 5,200 4,550 to 5,300 5,500 to 6,600
Education
500 Pupil,
School* 2,600 to 3,300 2,300 to 2,850 4,250 to 4,800
high school
University** Campus 5,100 to 5,800 4,700 to 5,500 5,500 to 6,350
Industrial
Pharmaceutical 3,300 to 4,200 2,970 to 3,800 3,500 to 4,300
Others
Multi-level Car park 850 to 1,200 800 to 1,050 1,050 to 1,300
Data Centres
Shell only Multi-tenant 4,200 to 6,200 4,200 to 6,000 4,400 to 6,350
Shell only Hyperscale 5,250 to 7,150 5,100 to 7,000 5,400 to 7,350
Fit-out (₹/MW) Multi-tenant 18,00,00,000 to 22,00,00,000
Fit-out (₹/MW) Hyperscale 16,00,00,000 to 20,00,00,000
* Classroom with basic indoor and outdoor facilities.
**Learning rooms with required amenities
Note: The costs noted in the above table do not reflect the impact of Covid-19 and is pre Covid-19 pricing.
Source: Gleeds India Data-base
July 2020 21Indian Construction Costs - A Biannual Review - July 2020
Sector Wise Costing:
Assumptions for Mumbai Chennai Hyderabad
Building Type
Costs ₹ / Sqft ₹ / Sqft ₹ / Sqft
Residential
Affordable BUA: 3,00,000 sqft 2,375 to 2,800 1,865 to 2,205 1,865 to 2,100
Premium BUA: 6,00,000 sqft 3,200 to 3,750 2,545 to 3,050 2,400 to 3,000
Commercial Building
Commercial BUA: 10,00,000 sqft 3,050 to 3,500 2,300 to 2,750 2,375 to 2,800
Office Note: Costs based on carpet area for office fit-outs only.
Basic CA: 15,000sqft 2,200 to 2,700 1,900 to 2,300 2,000 to 2,400
Standard CA: 30,000sqft 2,800 to 3,600 2,400 to 3,000 2,600 to 3,200
Premium CA: 50,000sqft 4,000 to 7,500 3,800 to 6,200 3,900 to 6,500
Retail
Malls 2,545 to 3,000 2,375 to 2,800 2,375 to 2,700
Store fit-out costs on carpet area
Quick Service
BUA: 2,500 sqft 3,000 to 3,400 2,700 to 3,100 2,750 to 3,200
Restaurants
Apparel stores BUA: 25,000 sqft 2,200 to 2,500 1,900 to 2,250 2,000 to 2,300
Discount sports store BUA: 25,000 sqft 1,500 to 2,000 1,200 to 1,700 1,250 to 1,800
Jewellery BUA: 8,000 sqft 5,500 to 7,000 5,000 to 6,000 5,000 to 6,500
Hospitality
3-star Hotel 100 key 4,650 to 5,900 3,700 to 4,500 3,400 to 4,660
4-star Hotel 150 key 5,950 to 7,200 4,500 to 5,400 4,350 to 5,500
5-star Hotel 150 key 7,500 to 9,500 6,400 to 7,500 6,800 to 8,100
Healthcare
Hospitals 500 bed capacity 5,500 to 6,800 4,200 to 5,000 4,400 to 5,200
Education
500 Pupil,
School* 4,650 to 5,000 2,500 to 3,250 2,550 to 3,650
high school
University** Campus 5,950 to 6,500 4,650 to 5,500 4,650 to 5,550
Industrial
Pharmaceutical 4,000 to 5,500 3,100 to 4,000 3,250 to 4,100
Others
Multi-level Car park 1,200 to 1,350 800 to 1,100 850 to 1,200
Data Centres
Shell only Multi-tenant 4,650 to 5,750 4,100 to 4,900 4,250 to 5,100
Shell only Hyperscale 7,800 to 8,300 6,150 to 7,000 6,100 to 7,200
Fit-out (₹/MW) Multi-tenant 18,00,00,000 to 22,00,00,000
Fit-out (₹/MW) Hyperscale 16,00,00,000 to 20,00,00,000
*Classroom with basic indoor and outdoor facilities.
**Learning rooms with required amenities.
Note: The costs noted in the above table do not reflect the impact of Covid-19 and is pre Covid-19 pricing.
Source: Gleeds India Data-base.
July 2020 22Indian Construction Costs - A Biannual Review - July 2020
Assumptions Made and Notes
for reading the Costs
Data provided in this report is an average range of costs. costs indicated. The following are the parameters that are
There are many cost parameters that contribute to costs to be considered:
and some judgement is to be applied while using the
Procurement
Site conditions Market conditions.
route considered
Assumptions made
Location Design
on site abnormal
Building shape Requirements of Time scale for
and size the end user completion
Quality and safety
Contract type Any site restrictions
systems required
Please note the following pertaining to the costs data All costs are deemed to exclude:
provided.
• Site abnormals and any specific site conditions.
• All costs noted are construction costs only.
• Client’s cost for land acquisition
• All costs are in Indian National Rupees unless noted
• Client’s overheads
otherwise.
• Client’s profit margin
• All costs are per square foot unless noted otherwise.
• Pre-opening costs
• All cost data is indicative of costs incurred at the time
of the making of the report. • Consultants, designers, and other project management
fees
• The impact of Covid-19 is not accounted. All costs are
pre-Covid-19 unless noted otherwise. • Land Value
• Project Insurance
All costs are deemed to include:
• Force Majeure
• All construction costs including shell and core,
• Any administration costs incurred by the Client.
architectural works, interiors and finishes, MEP and
external development works unless noted otherwise. • Any preclearing, logistic costs incurred by Client before
site hand over to contractor. GST
• Contractor’s preliminaries
• GST.
• Contractor’s overheads and profits
• Contingency
• Inflation (tender and construction inflation)
Area definitions followed in this document.
As per IS 3861-2002 RERA
Built up area Plinth area shall mean the built-up covered measured The built-up area includes the carpet area, plus the
(BUA) at the floor level of the basement or of any storey extra areas certified by the authorities, such as the area
of the outer and inner walls, dry balcony area, etc.
All costs noted below is on the built-up area unless noted otherwise. This indicates the cost incurred on all the unusable
areas, still contribute to costs.
July 2020 23Indian Construction Costs - A Biannual Review - July 2020
City Cost Indices
Marks & Spencer
July 2020 24Indian Construction Costs - A Biannual Review - July 2020
City Cost Indices
Gleeds carried out an extensive exercise to map the costs Appropriate weightage was given to each of the items and
across the various Indian cities. based on weighted average method, a base Index was
calculated.
The following methodology was adopted to derive the
indices. • December has been considered as the base month as this
is the best representation of costs before the uncertainty of
• A basket of items comprising of the most commonly
the pandemic. The base city taken for calculation of Index
used materials in construction, labour and consumables
is Bangalore.
was established. These goods have been identified and
known to demonstrate the inflation and dynamic nature • Cost movement for the different cities across similar
of the goods typically used in the construction sector. timelines has been mapped and the indices were thus
Approximate individual quantities within the items were derived.
taken to represent standard type of commercial building.
The graph below indicates the construction costs indices for the six major cities for four months
starting December 2019, with Bengaluru as the base.
Construction Cost Indices for Various Cities
115.00
113
110.00
111
109
108
108
107
105.00
107
106
105
105
105
104
104
103
103
103
100.00
102
102
102
101
100
99
98
98
95.00
90.00
Bangalore Pune Chennai Hyderabad NCR Mumbai
Dec-19 Jan-20 Mar-20 May-20
Source: Gleeds’ Internal Database.
July 2020 25Indian Construction Costs - A Biannual Review - July 2020
Industry Transformation
Godrej One, Mumbai
July 2020 26Indian Construction Costs - A Biannual Review - July 2020
Industry Transformation
• Regular disinfection
Clean workspaces • Regular cleaning and sanitisation
• More sanitisation stations
• Self-owned personal protection equipment.
• Less contact points
Safe workspaces
• Infrared cameras for temperature checks
• Sustainable designs
• De-densification of offices
• More work from homes options
Social distancing
• Introduction of work shifts
• Staggered break times
• Reassessed productivity.
• Revised programme timelines.
Project completion times will be revised based on
• Distorted supply chain.
• Use locally sourced materials.
• Prefer local manufacturers.
Supply chain rebalance
• Preferred readily available products.
• Mechanized Construction.
• Modular construction
Construction trends • Prefabrication
• 3D printing for commonly used components
• Artificial Intelligence
• Virtual realty and Augmented realty
• Drone technology
Move to technology
• BIM
• Automation
• Parametric design
• Return to sites only in November (estimated)
Labour Crisis • Additional prelims for labour camp
• Increase in daily wage
• Change in Contractual terms- Force Majeure
• Change in contractor’s prelims
• Site management
Evolution
• Project management
• Human Centric Design
• Programme
July 2020 27Indian Construction Costs - A Biannual Review - July 2020
Look Ahead
Taj, Chennai
July 2020 28Indian Construction Costs - A Biannual Review - July 2020
Look Ahead
The construction industry is a good contribution to the Material and labour are not only cost contributors but
nations’ economy and the industry has commenced also the root of the construction activities. Supply chain
works, when the lockdown regulations were relaxed late disruptions and unavailability of labour may cripple the
May 2020. Sites works have resumed in some cities, with smooth flow of construction activities and giving rise to
renewed standard operating procedures to create a safe delays and losses. However, the industry now has time to
work environment. While some cities are still shutdown, look at retrieving it’s foothold from the sudden unforeseen
clients have commenced on the designing strategies and downslide, by focussing on ‘working with the COVID-19’
are occupied with readying design and other pre-contract and rearranging itself to best suit the new requisites.
works for future projects.
A look towards technology will also be a key to the world
For the newer construction, set out to commence after of construction which may include a drive towards use
the period of 6 months, based on a survey conducted by of machinery, new equipment and the adaptation of less
Gleeds’ in the second week of May 2020, it is predicted popular forms of construction such as pre-engineered
that cost of construction might increase by 5% to 7% buildings/modular construction.
provided the country is COVID-19 free. However, with that,
is also the increase of the Contractor’s prelims which is
Moving into the future which includes co-existing with the
a consequence of the mandatory high health and safety
COVID-19, the industry is seen to be picking up the pieces
requirements for site cleanliness and labour camps. This
and reconstructing itself to move forward into a better
maybe slightly offset with the reduction in the contractor’s
tomorrow.
mark-up, which may be offered to ensure competitiveness
and with the intent to survive in the market.
Taj, Chennai
July 2020 29Indian Construction Costs - A Biannual Review - July 2020
References
• IBEF: About Indian Growth rate and statistics. [www.ibef.org]
• Statista: India inflation rate from 1984 to 2021 [www.statista.com]
• Government of India, Ministry of Finance: Economic Survey 2019-2020 [www.indiabudget.gov.in]
• GDP growth forecasts [www.adb.org] [www.imf.org] and media reports
• Indian retail industry analysis [www.ibef.org]
• Manufacturing Sector in India [www.ibef.org]
• Indian real estate industry [www.ibef.org]
• Healthcare industry in India [www.ibef.org]
• Monetary Policy Report. [www.rbi.org.in]
• Covid-19: Impact on real estate, Credai-MCHI [www.mchi.net]
• India real estate-A different world post Covid-19, Anarock [api.anarock.com]
• Media reports: Economic Times, NDTV, Business Standard, The Hindu Business Line, Moneycontrol, India today and
Zee business.
Abbreviations
MRICS: Member of the Royal Institution of Chartered Sqmm: Square millimetre
Surveyors.
Ltr: Litre
USD: United States Dollar
Mtr: Linear metre
INR: Indian National Rupee
MT: Metric tonne
GST: Goods and Services Tax
FRLS: Fire retard low smoke
MEP: Mechanical, Electrical and Plumbing
Al: Aluminium
BUA: Built-up area
Cu: Copper
CA: Carpet area
Ar: Armoured
Sqft: Square foot
MW: Mega Watt
Cuft: Cubic feet
July 2020 30Indian Construction Costs - A Biannual Review - July 2020
Our Services
A MULTIDISCIPLINARY APPROACH
Gleeds operates a partnering principle with clients and project teams, offering impartial
advice across an extensive range of services to provide solutions for every stage of the
property life-cycle.
• Project Management – control and delivery of your projects
• Cost Management – predictability and control of costs
• Health & Safety • Project Monitoring
• Advisory – delivering bespoke integrated solutions
• Gleeds Digital Services (GDS)
India Overview
Residential
117 million sq.ft
Education Hospitality
5.2 million sq.ft 6397 Keys
Sector
Mixed Use Presence Industrial
18.8 million sq.ft 4 million sq.ft
India
Bangalore (Head Office)
Commercial Leisure & Retail
Mumbai 88 million sq.ft faith Based 24 million sq.ft
9 million sq.ft
Pune
Healthcare
Delhi NCR
3060+ Beds
Chennai
Hyderabad
July 2020 31Indian Construction Costs - A Biannual Review - July 2020
Register with Gleeds- our cloud based integrated
registration database for design professionals,
contractors, suppliers and product manufacturers,
recently launched to allow us to reach out to you
quicker for our upcoming project opportunities.
Click on https://tinyurl.com/gleedsregister or scan
the QR code using your camera to complete the
registration.
For queries regarding the registration, please write
to us at register@gleeds.in
For any further queries, please contact
Gleeds India Insight and Analytics at insights@gleeds.in or:
Ben Huskisson, MRICS Vishal Shah, MRICS
Managing Director Director
Email: ben.huskisson@gleeds.in Email: vishal.shah@gleeds.in
Ashish Pimpalkhare, MRICS Sushma Wilson, MRICS
Senior Associate Director Executive Cost Manager
Email: ashish.pimpalkhare@gleeds.in Email: sushma.wilson@gleeds.in
This issue was compiled by Gleeds India I&A with contributions from Siva Senathipathy, Jagjit Avdeel, Balaprakash B,
Ravi K, PVSS Varma, Jagan Mohan k, Mallikarjun GS, Tushar Banerjee, Mayura Godse, Vimalraj B, Ramana Kumar,
Bhagyshree Parikh, Kiran Pawar, Rahul V, Rajesh Babu, Bharat H, Padmini G and Srinivas S.
© July 2020 by Gleeds Consulting (I) Pvt. Ltd.
Legal Disclaimer: This paper was prepared by Gleeds India Consulting (I) Pvt. Ltd. and is for general information only. Neither Gleeds nor
any of their partners, directors, employees or other persons acting on their behalf makes any warranty, express or implied and assumes any
liability with respect to the information or methods contained in this paper to any person or party. This document is subject to copyright and
must not be reproduced.
July 2020 32Indian Construction Costs - A Biannual Review - July 2020 July 2020 33
You can also read