Indian Food Services Industry: Engine for Economic Growth & Employment - A Roadmap for Unlocking Growth Opportunities - ficci
←
→
Page content transcription
If your browser does not render page correctly, please read the page content below
Indian Food Services Industry:
Engine for Economic Growth
& Employment
A Roadmap for Unlocking Growth
Opportunities


Dr. Sanjaya Baru
     Secretary General-FICCI

    Dear Readers,

    T
             he Indian Food and Beverage (F&B) service Industry is one of the most vibrant industries that
             has seen unprecedented growth in the recent past and continues to expand rapidly. This can be
             attributed to the changing demographics, increase in disposable incomes, urbanisation and growth
    of organised retail.

    The Food Services sector is expected to have generated direct employment for 5.5-6 million people in
    FY16, which is expected to increase to 8.5-9 million by FY21. Indirect employment has seen a growth
    at CAGR of four per cent from 2013-2016 and expected to grow six per cent till 2021. The Indian food
    industry is poised for huge growth, increasing its contribution to world food trade every year. In India, the
    food sector has emerged as a high-growth and high-profit sector due to its immense potential for value
    addition, particularly within the food processing industry.

    India’s overall retail opportunity is substantial, and coupled with a demographic dividend (young
    population, rising standards of living and upwardly mobile middle class) and rising internet penetration;
    strong growth in retail & e-Commerce is expected. The Indian government’s ambitious Make in India,
    Digital India, and Start up India project is indeed giving a great stimulus to the Food Services retail sector.

    This report titled ‘Indian Food Services Industry : Engine for Economic Growth & Employment- A roadmap for
    unlocking growth opportunities’’ provides a perspective on the role and impact of Food Services Retail
    Sector in providing high quality, safe foods for end-consumption, while being a growth catalyst in our
    economy through employment generation, providing a fillip to the agriculture industry and attracting
    capital. Several insights in this whitepaper stem from discussions with industry leaders across various
    Indian companies in the Food Services retail business.

    I am confident that the deliberations at the conference coupled with insights shared in this document,
    would help you identify opportunities for growth & improvement in your own organizations and in turn
    accelerate performance across the Food Services retail sector. As we know, when businesses succeed, the
    economy prospers and larger value-creation takes place to propel a better tomorrow. This indeed is the
    compelling objective that drives FOODZANIA 2017 and our report.

    Enjoy reading and we look forward to receiving your suggestions!

4   INDIAN FOOD SERVICES INDUSTRY: ENGINE FOR ECONOMIC GROWTH & EMPLOYMENT
    A Roadmap for Unlocking Growth Opportunities
Saloni Nangia
  President, Technopak
        Advisors

T
       he Food Services sector, comprising of hundreds of thousands of businesses that include street
       hawkers, small independent eateries that dot India’s urban and rural landscape, highway dhabas,
       as well the regional and national giants (Indian & multinational) plays an extremely vital socio-
economic role in India. It provides a very dignified way to earn a livelihood for millions of Indians who
otherwise would be hard pressed to make a living, succor to millions of migrants who have come to major
urban centers looking for better prospects and not having the comfort of a home or the luxury of time to
cook a daily meal for themselves, meet the food needs of hundreds of millions of highway, railways, and
air travelers, provide social meeting and entertainment options to millions of young (and not so young)
upwardly mobile Indians, and creates an informal but very important “supply chain” between the small
farmers and other producers of food and related products especially and the end consumers.

The huge positive socio-economic impact of this sector has been overlooked in the past, and has been
seen by the various city, state, and central government merely as another source of collecting tax
revenues. Fortunately, there are signs that this perception is changing and an increasing realization that
this sector forms a very crucial part of the Indian economy, and plays a pivotal role contributing to the
growth of the ecosystem generating wide employment opportunities and providing a boost to auxiliary
industries like real estate, commercial kitchen equipment, food processing, supply chain etc. Hopefully, the
various state and the central governments will provide the requisite policy and fiscal support to enable it
to grow steadily and thereby make an even bigger positive impact by way of creating more employment
and by way of meeting the changing consumer needs more efficiently.

Technopak is glad to partner with FICCI – Foodzania and present knowledge report on Indian Food
Services Industry. The report will provide holistic perspective of the Food Services Industry to its readers.
In this report, we have highlighted few key areas where support from Government will help the industry in
realizing its true potential. I wish everyone happy reading.

                                                                                                                5
08
                                          Indian Food Services
                                          Industry Overview

                                          28
                                          Unlocking Growth Potential

Contents
                                          35
                                          Investment Attractiveness
                                          Landscape

                                          43
                                          Recommendation

Authors:
Suman Dabas | Associcate Director
Himanshu Lunawat | Associate Consultant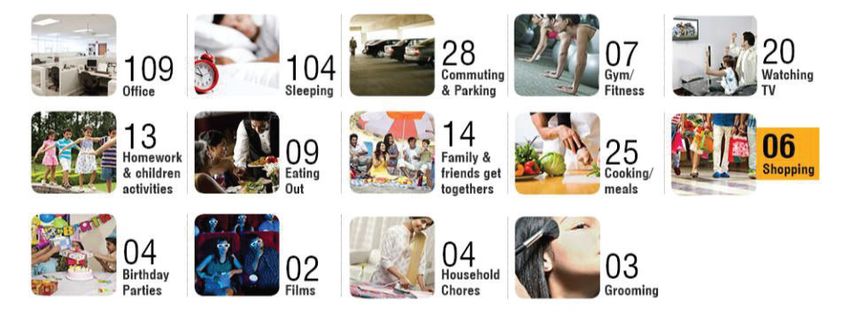
Executive Summary
Today, Indian economy has significant presence on world economic platform. Globally, India ranks 7th in
terms of nominal GDP and the 3rd in PPP terms. It is estimated that by FY 2020, India will be in top 5 global
economies and by FY 2050 it will be in top 3 global economies. India’s medium- to long-term growth will
be determined by inter-play of the structural factors of demographics, policy reforms and globalisation.
It is expected that the confluence of these three factors will help to raise potential growth. The growth
is expected to continue in future and will translate to higher spending across all consumption categories
including eating out, consumer durables, luxury products etc.

Food Services emerge as a key segment in Indian economy. Indian Food Services market in India (organized
and unorganized) is estimated at INR 3,37,500 crore in 2017 and is projected to grow at a CAGR of 10%
over the next 5 years to reach INR 5,52,000 crore by 2022. Two mega metros, Mumbai and Delhi NCR
contribute to 22% of the overall Food Services market (11% each) followed by six mini metros (Pune,
Ahmedabad, Bengaluru, Chennai, Hyderabad and Kolkata)comprising of 20% share in the Food Services
market.

High percentage of young and working population which is well travelled have double incomes and is
experimental along with being tech savvy, is eating out more than their predecessors, driving the growth of
the Food Services market. Availability of organized retail space is helping in consistent growth of Indian and
International brands across different formats.

The impact of the market as a whole on the entire ecosystem – right from real estate to agriculture, kitchen
equipment to supply chain and employment is significant. However, certain challenges such as availability
of quality manpower, high attrition rate, high real estate cost, fragmented supply chain, over-licensing etc.
act as headwind for growth of the industry.

High percentage of young and working population which is well travelled have double incomes and is
experimental along with being tech savvy, is eating out more than their predecessors, driving the growth of
the Food Services market. Availability of organized retail space is helping in consistent growth of Indian and
International brands across different formats.

The Indian Food Services market space is attracting significant interest from domestic as well as
international private equity and venture capital funds. The large number of investments can be attributed to
the fact that the Food Services market is a domestic consumption driven story with great growth potential.
In fact, private equity investments are seen flowing through the entire ecosystem, funnelling growth in
front-end companies, back-end companies, food-tech companies etc.

There have also been some key trends that are gaining traction in the Food Services space. Virtual Kitchens
and Ready to Cook players are gaining acceptance among urban consumers. Ordering-in has become
an integral part of the eating experience and several logistics players are providing last mile delivery for
restaurants.

Food Services is emerging as a key contributor for the Indian economy, including employment generation,
skill development, growth in the allied industries, entrepreneurship, and tourism and creating experiences
for the Indian consumer. It is imperative for the Indian government and regulators to recognize the
contribution and role of Food Services Industry and take measures to create positive policy framework for
industry’s growth

                                                                                                                 7
Indian Food Services Industry Overview

             Indian Food Services Industry Overview

          A
                    decade back eating out had not been a prominent feature in an Indian’s life but over the years, due
                    to changing consumption pattern, eating out has gained momentum. This changing pattern has
                    ensured constant growth for the Indian Food Services market.
           India’s Food Services market has come a long way from early 1980’s when the number of organized
           brands were countable and the market otherwise was dominated by un-organized players. The revolution
           in this sector began in 1996 with the opening up of restaurants by McDonald’s, Pizza Hut, Domino’s
           followed by Subway, Haldiram’s, Moti Mahal and Barbeque Nation etc.

           Exhibit 1: Evolution of Indian Food Services Market in India

                          Phase 1: Faster development (infrastructure and business opportunities) in metros and mini-
                          metroslike Delhi, Mumbai & Bengaluru rapidly increased the number of organized restaurants in
                          the1990s. With the help of their first mover advantage, players looked to maximize revenue.

                          No clear segmentation based on offerings was witnessed. Most of the Indian brands were running Multi
                          Cuisine Restaurants and were offering different products under the same roof. However, with the entry
                          of International brands like McDonald’s, Pizza Hut, KFC and Domino’s in 1995-96, segmentation based
                          on offerings and service started in India

                          Phase 2: Demand for food joints in Tier II cities in the 2000s was powered by increasing urbanization,
                          rising personal disposable incomes and more economic activities. A huge untapped population coupled
                          with changing consumer lifestyles gave players an incentive to expand into Tier II cities. Also, a clear
                          segmentation of formats started to emerge based on the offerings and service style such as QSR, CDR,
                          FDR etc.

                          Phase 3: The current decade is overseeing a shift to a larger organized sector. Customer retention,a
                          higher range and depth of offerings are new goals among organized players. This phase witnessed
                          a sharper segmentation within the different formats based on consumer needs and offerings by the
                          brands e.g. within QSRs there is a clear differentiation between pizza chains and burger chains, within
                          CDRs a further segmentation was observed as premium and value based CDRs based on attributes like
                          ambiance, service style and cuisines etc. This phase has also seen the birth of food technology which is
                          estimated to be growing at almost 15-20% per year.

           Source: NRAI Technopak India Food Services Report 2016, Technopak Analysis

8          INDIAN FOOD SERVICES INDUSTRY: ENGINE FOR ECONOMIC GROWTH & EMPLOYMENT
           A Roadmap for Unlocking Growth Opportunities
Market Size & Growth Potential
Market Structure
Food Services Industry is classified in two segments: organized and unorganized based on following three
key parameters: (i) accounting transparency, (ii) organized operations with quality control and sourcing
norms, and (iii) outlet penetration.
The Food Services outlets that do not conform to the above three key parameters would be categorized
under the ‘unorganized’ segments. This segment primarily comprises of dhabas, roadside small eateries,
hawkers and street stalls.
The organized segment conforms to above three parameters and is further classified in Chained and
Standalone formats. Chained formats are domestic and international formats with more than three
outlets present across the country.
The Chained formats are further classified in six sub segments based on price (avg. price per person),
service quality and speed, and product offering. The sub-segments are: Fine Dining, Casual Dining, Pub
Bar Club & Lounge (PBCL), Quick Service Restaurants (QSR), Cafes and Frozen Desserts. The definition of
these sub segments and average price points are given in table below:

Exhibit 2: Structure of Indian Food Services Market

                                                                                                                 Average Spend per
Key Segments in the Food Services Market
                                                                                                                   Person* (INR)
Unorganized Segment – It includes roadside eateries and dhabas which have been the most common
                                                                                                                      10-100
eating out option.
Organized Segment – Consists of:
a) Standalone restaurants across all formats with less than 3 outlets.                                                   -
b) Chain format which has 3 or more outlets across all formats.
Chain Segment
Café                 Coffee & chai bars as well as parlours and bakeries.
                     High focus on beverages supported by food items.                                                 50-250
                     Eg: Starbucks, Café Coffee Day etc.
Quick Service        Focused on speed of service, affordability and convenience. Strong focus on takeaway
Restaurants (QSRs) & delivery with minimal table service.                                                             75-250
                     Eg: Haldiram’s, McDonald’s
Frozen Desserts/     Comprises small kiosk formats of ice-cream brands and has now extended the dine-in
Ice-Cream (FD/IC)    concept to frozen yogurt brands.                                                                 50-150
                     Eg: Baskin-Robbins, Red Mango etc.
Affordable Casual    A restaurant serving moderately priced food in an ambience oriented towards
Dining Restaurants providing an affordable dining experience, with table service. The offerings bridge the
                                                                                                                     250-500
(ACDRs)              gap between QSRs and premium casual dining restaurants.
                     Eg: Pind Balluchi, Sagar Ratna etc.
Premium Casual       Restaurants bridging the gap between ACDRs and fine dining restaurants. Full service
Dining Restaurants restaurants with eclectic high quality interiors and high standards of service.                  500-1000
(PCDRs)              Eg: Farzi Café, Oh! Calcutta etc.
Fine Dining          A full service restaurant with premium interiors, specific cuisine specialty and high
Restaurants (FDRs) standard of service. They offer a unique ambience and an upscale service with the
                     help of highly trained staff.                                                                    >1000
                     Eg: Copper Chimney, Olive Bar etc.
Pubs, Bar Café &          This format mainly serves alcohol and related beverages and includes night clubs and
Lounges (PBCL)            sports bars.                                                                              750-1500
                          Eg: Beer Café, Xtreme Sports Bar etc.
* Spend is Exclusive of Taxes
Source: NRAI Technopak India Food Services Report 2016.

                                                                                                                                     9
Indian Food Services Industry Overview

           The size of the Indian Food Services market in India (organized and unorganized) is estimated at INR
           3,37,500 crore in 2017 and is projected to grow at a CAGR of 10% over the next 5 years to reach INR
           5,52,000 crore by 2022.
           Exhibit 3: Indian Food Services Market Size (INR ‘00 crore)
                      2,478         2,665    2,865     3,090    3,375    3,710           4,090      4,505     4,985    5,520      Total
                                                                                                                         145

                                                                                                               135       620

                                                                                                     125       510

                                                                                          115        420

                                                                                                                         1,605
                                                                             105          350

                                                                                                               1,400
                                                                 95          285

                                                                                                     1,220
                                                        88

                                                                                           1,065
                                                                 235
                                              80
                                     75                204                   935
                       70                    175                 820
                                    150                722
                       128                   660
                                    605
                       550
                       1,730

                                     1,835

                                              1,950

                                                        2,076

                                                                 2,225

                                                                             2,385

                                                                                           2,560

                                                                                                     2,740

                                                                                                               2,940

                                                                                                                          3,150
                      2013          2014     2015      2016     2017E    2018P           2019P      2020P     2021P    2022P

                               Unorganized Market     Organized Standalone           Chain Market     Restaurants in Hotels

           Source: NRAI Technopak India Food Services Report 2016, Technopak Analysis

           The unorganized segment’s share in the Food Services market reduced from 70% in 2013 to 66% in 2016
           and is projected to fall to 57% in 2022. This is the case as many unorganized businesses are moving
           towards the organized sector.
           The organized market (chain and organized standalone outlets) is estimated at INR 1,15,000 crore in
           2017 and is projected to grow, at a CAGR of 16%, to reach INR 2,37,000 crore by 2022 gaining a share of
           40% from 31% in 2017.
           Exhibit 4: Market Share & Growth

                                              Market Share               Market Share                        Market Share                 CAGR            CAGR
                                                (2013)                     (2017)                             (2022 P)                (2013 – 2017)   (2017 – 2022)
            Unorganized                               70%                             66%                          57%                     6%              7%
            Market
            Organized Market                          30%                             34%                          43%                    11%             16%
           Source: NRAI Technopak India Food Services Report 2016, Technopak Analysis

           The organized standalone market share in total Food Services market is projected to rise to 29% in
           2022 from 24% in 2017. This is the case as increasing disposable incomes have encouraged owners and
           entrepreneurs to open such organized outlets. Moreover, this segment is projected to grow at a CAGR of
           14% from 2017 to 2022. The chain market share is expected to increase from 7% in 2017 to 11% in 2022.
           This segment is projected to grow at a CAGR of 21% from 2017 to 2022.
           In case of the independent restaurants (in hotels) market share is estimated to remain constant at 3% till
           2022. However, this segment is still expected to grow at a CAGR of 9% from 2017 to 2022.

10         INDIAN FOOD SERVICES INDUSTRY: ENGINE FOR ECONOMIC GROWTH & EMPLOYMENT
           A Roadmap for Unlocking Growth Opportunities
Organized Standalone Market
The organized standalone market is the largest organized segment with a market share of 24% in 2017.
The segment is expected to grow at a CAGR of 14% from INR 82,000 crore in 2017 to INR 1,60,500 crore
by 2022.
Exhibit 5: Organized Standalone Market Size, FY 2017 (INR ‘00 crore)
550 605 660 722 820 935 1,065 1,220 1,400 1,605
28
27
90
25
24 190
83
23
22 170 215
21 75
21 150
20 69 188
20 139
18 62 165
17 19 125
58 140
16 18
14 54 115 123
18
13 17 50 105
16 47 110 1,055
95
44 91 93
85 81 910
71
62 785
675
500 585
400 435
330 365
2013 2014 2015 2016 2017E 2018P 2019P 2020P 2021P 2022P
Casual Dining QSR PBCL Café Fine Dining FD/ IC
Source: NRAI Technopak India Food Services Report 2016, Technopak Analysis
The Casual Dining Restaurants at INR 50,000 crore in 2017 formulate around ~61% of the organized
standalone market and is growing at a CAGR of 16% to reach INR 1,05,500 crore (66%) in 2022 followed by
QSRs growing at 15% to reach INR 21,500 crore in 2022.
Exhibit 6: Organized Standalone Format’s Market Share & CAGR
Market Share (%) CAGR
Format
FY 2013 FY 2017 FY 2022P FY 2013-17 FY 2017-22
Casual Dining Restaurants 60% 61% 66% 11% 16%
Quick Service Restaurants 12% 13% 13% 15% 14%
PBCL 15% 14% 12% 8% 11%
Cafés 8% 7% 6% 7% 9%
Fine Dining Restaurants 3% 2% 1.5% 4% 7%
Frozen Dessert/ Ice Cream 2% 2% 1.5% 8% 9%
Source: NRAI Technopak India Food Services Report 2016, Technopak Analysis
11Indian Food Services Industry Overview
Chain Market
The chain market is expected to grow at a CAGR of 21% to reach INR 62,000 crore by 2022 from INR
23,500 crore in 2017. QSRs have the maximum market share followed by casual dining restaurants.
Exhibit 7: Chain Market Size in INR ’00 crore
128 150 175 204 235 285 350 420 510 620
31
6
32
26 36
6
29
22 29
6
26
19 24 305
6
15 24
21 248
6
13 21
15 199
12 5
19
10 5 12 162
9 18 130
5 11
8 5 17
9 105
5 16 91
15 7 210
5 78 172
66
55 143
98 118
67 81
40 47 56
2013 2014 2015 2016 2017E 2018P 2019P 2020P 2021P 2022P
Casual Dining QSR PBCL Café Fine Dining FD/ IC
Source: NRAI Technopak India Food Services Report 2016, Technopak Analysis
In the chain market, QSRs and the CDRs constitute 79% in 2017 and the same is expected to grow to 83%
by 2022. QSRs will be driving the growth based on the operating model, where centralized commissaries
and robust supply chain will be help in attaining deeper penetration in Tier II and Tier III cities. The market
share of CDRs will remain the same at 34% in 2022. However, the segment will grow at a healthy CAGR
of 21% to reach INR 21,000 crore. The growth for CDRs will be fuelled by more CDRs in the chain segment
making inroads in Tier II and Tier III cities.
Also, as the Food Services market has evolved over time, each format caters to a distinct primary target
group and occasions. Within the eating out space, the CDR segment is best placed in the overall chain
segment based on pricing, wholesome offer and involvement of the entire family. Apart from convenience
and quick bites, the consumers are also looking at experiential format due to higher disposable income
and changing eating out habits. CDRs continue to be a popular format in Tier I and Tier II cities along with
the metros and mini metros.
12 INDIAN FOOD SERVICES INDUSTRY: ENGINE FOR ECONOMIC GROWTH & EMPLOYMENT
A Roadmap for Unlocking Growth OpportunitiesExhibit 8: Chain Market Format’s Market Share & CAGR
Market Share (%) CAGR
Format
FY 2013 FY 2017 FY 2022P FY 2013-17 FY 2017-22
Casual Dining Restaurants 31% 34% 34% 19% 21%
Quick Service Restaurants 43% 45% 49% 18% 24%
PBCL 4% 5% 6% 24% 23%
Cafés 12% 8% 5% 6% 11%
Fine Dining Restaurants 4% 2% 1% 2% 3%
Frozen Dessert/Ice Cream 6% 6% 5% 13% 19%
Source: NRAI Technopak India Food Services Report 2016, Technopak Analysis
The chain market is dominated by the international QSR brands operating in India such as Domino’s,
McDonald’s, KFC, Pizza Hut, Burger King etc. The overall share of international brands in terms of outlets
in the chain market is around 37%, contributing 45% share to the total revenue in chain market. For the
International brands, the QSR segment is the maximum revenue contributor with around 70-75% share
followed by CDR, whereas in the domestic segment, the market is dominated by CDRs with around
50-55% revenue share. Home grown players like Moti Mahal Delux and Sagar Ratna dominate the value
segment in casual dine market whereas brands like Barbeque Nation, Sigree and Mainland China are the
key players in the premium space.
Exhibit 9: Revenue Growth of Key Players (INR ‘00 crore)
Company/Brand FY 2013 FY2014 FY 2015 FY2016 FY2017 CAGR
2013-16
QSR
Jubilant Food Works/ 14.15 17.35 20.95 24.40 19.35 20%
Domino’s
Westlife**/McDonald’s 6.80 7.40 7.65 8.35 9.3 7%
Conaught Plaza 7.45 7.20 7.25 7.30 NA -1%
Restaurants/McDonald’s
KFC 12.50 12.85 12.50 12.25 NA -1%
Subway 3.55 4.35 5.60 6.80 NA 24%
CDRs
Pizza Hut* 6.00 6.50 6.90 6.25 NA 1%
Specialty 2.25 2.65 3 3.21 2.37 13%
Restaurants
Barbeque Nation 2.75 3.60 4.40 3.95 NA 13%
Café
Café Coffee Day 10.75 11.85 11.25 12.45 9.32 5%
*Pizza Hut revenue includes revenue from both formats
**Westlife revenue of 12 months in FY 2017
Source: Website of Jubilant Foodworks, Westlife, Specialty Restaurants, Coffee Day Group and Industry Sources
13Indian Food Services Industry Overview
Citywise Market Size
The top eight cities in India have been the centre of development, especially for the organized Food
Services. Due to increased economic activity, rising disposable incomes, a greater need for convenience
and an increasing women workforce, the chain Food Service brands have done well in these cities. The
two mega metros, Delhi & Mumbai, contribute a total of 22% (11% each) to the Food Services market. The
6 Mini-Metros constitute ~20% of the Food Services market, while the rest of the contribution comes
from the Tier I & II cities along with the rest of India.
Exhibit 10: Citywise Market Size, FY 2017 (INR ‘00 crore)
Mega Metros 22%
Mini Metros 20%
Next 21 cities 11%
Rest of India 47%
Source: NRAI Technopak India Food Services Report 2016, Technopak Analysis
Mega metro cities: Delhi-NCR and Mumbai.
Mini Metro Cities: Ahmedabad, Pune, Chennai, Kolkata, Bangalore, Hyderabad.
21 Cities: Jaipur, Lucknow, Surat, Nagpur, Kanpur, Indore, Patna, Chandigarh, Kochi, Coimbatore, Vadodra, Ludhiana, Nashik, Varanasi, Madurai,
Visakhapatnam, Bhopal, Amritsar, Rajkot, Trivandrum, Goa.
14 INDIAN FOOD SERVICES INDUSTRY: ENGINE FOR ECONOMIC GROWTH & EMPLOYMENT
A Roadmap for Unlocking Growth OpportunitiesGrowth Drivers of Indian Food Services Industry
With a prospering economy and a vibrant population of 1.3 billion people, India is today under the
global spotlight for consumption-oriented sectors. Changing cultural dynamics and family structures
have resulted in creation of multiple households. These new households have spurred the trend of
food consumption from alternate avenues (non-home cooked food). A larger workforce and greater
employment generation in the liberalized economy is another factor which has contributed to higher
discretionary spending on eating-out and dining-in.
Thus the interplay of these factors is anticipated to sustain the industry’s growth momentum in the
foreseeable future.
Favourable Demographics
• igh percentage of young and working age population driving the
H 33%
growth of food business Population younger than 15 years
• emographically youngest consumer market (33% of the population is
D 50%
younger than 15 and 50% younger than 24) Population younger than 24 years
Source: Census of India 2011, MoSPI,
• L argest working age (15-54 years) population (will rise by 135 Mn by Technopak Analysis
2022, India to soon have 20% of the world’s working-age population)
Increasing Urbanization
Urbanization in India is happening at fast pace, with every sixth person getting urbanised globally is an
India. India is second largest urban community in the world after China, with an urban population of about
430 mn (2015). It is estimated that by 2020, 35% of India’s population will be living in urban centres and
will contribute to 70 – 75% of India’s GDP.
Urban India will see growth in households where both husband and wife work. Higher income and lesser
time will fuel growth of eating out and ordering in and many players have recognized this and offer value
meals or combos for this target segment. Smart Cities initiative by Government to create new ‘urban
clusters’ will also expedite urbanization in India.
Exhibit 11: Increasing Urbanization
Urban Population (% of total population) Emerging Cities: 2025
37%
35%
33% 33%
31%
28%
2000 2010 2015 2016 2020P 2025P
Source: World Bank, IMF, MGI: Urban India Awakening, Technopak analysis
15Indian Food Services Industry Overview
Increasing Women Power
According to International Labour Organization (ILO) data, India ranks 11th from bottom in terms of Female
Labour Force Participation (FLFP). The proportion of women in private sector companies is 24.5% (2011)
of the total workforce compared to just 17.9% of the public sector. In central government jobs, women
accounted for 7.6% in 1991, which, almost two decades later, had touched just 10%. In recent years there
has also seen a decline in the labour force and workforce participation rates of women, whereas, service
sector may see increase in women employment from ~20% in 2011 to ~25% in 2020.
With increasing proportion of women in working population; the trend for home-cooked meals has gone
down, leading to robust demand of ‘out of home’ food from households with working couples.
Growing Middle Class
The households with annual earnings between USD 5,000 - 10,000 has grown at a CAGR of 17% over
the last five years and is further projected to grow at a rate of 12% to reach 109 million in 2020. The
households with annual earnings between USD 10,000-50,000 have also grown at a CAGR of 20% over
the last five years.
Increase in number of household with annual earning of USD 10,000 - USD 50,000 will lead to increase in
indulgence spending by the group. This will lead to increase in expenditure on eating out, luxury products,
consumer durables and across all the consumption categories. It is estimated that 23% of global middle
class will be from India.
Exhibit 12: Household Annual Earning Details
Year Total House HHs with Annual % of total HHs HHs with Annual % share of
Holds (in Mn.) earning USD 5,000 earning USD 10,000 total HHs
- 10,000 (Mn.) –50,000 (Mn.)
2009 221 34 15.20% 10 4.70%
2012 230 55 23.80% 20 8.70%
2014 236 65 26.50% 24 10.20%
2015 239 74 30.90% 32 13.20%
2018P 249 103 41.20% 73 29.30%
Source: EIU
Nuclearization
The number of increase in household exceeds increase in population growth indicating increasing
nucelarization trend in India. According to census data 2011, 74% of urban households have five or less
members as compared to 65% in 2001.
Fall in the average household size coupled with rising disposable income will lead to a greater percentage
on discretionary spending, eating out being one of them.
16 INDIAN FOOD SERVICES INDUSTRY: ENGINE FOR ECONOMIC GROWTH & EMPLOYMENT
A Roadmap for Unlocking Growth OpportunitiesExhibit 13: Indian Household Size and Growth Trend
Year Total No. of Avg. HH Avg.Urban Decadal growth Decadal growth
HHs (millions) Size HH size rate of HHs rate population
1981 119 5.5 5.4 19.23% 24.65%
1991 148 5.5 5.3 24.68% 23.79%
2001 187 5.3 5.1 26.28% 21.52%
2011 247 5.1 4.9 32.09% 17.64%
Source: India Budget
Higher Experimentation
The widely travelled, vibrant middle class, which is exposed to global trends in terms of newer format and
cuisines, with seamless interaction, facilitated by the growth of multiple communication channels such as
the internet and mobiles etc., is open to spending on dining experiences similar to those found elsewhere
in the globe. Such factors have prompted growth of new outlets serving cuisines from yet-unexplored
cuisines within the country, and these outlets have demonstrated the potential of delivering a novel
offering to the discerning Indian consumer.
Increasing Indulgence in Smaller Cities
With higher disposable incomes, evolution of aspirations of younger generation, rise in presence of
branded retail chains and growth of entertainment as a concept with emergence of malls & multiplexes;
consumers in small cities are also emerging as a strong new segment that is open to trying out branded
and organized F&B dining options. They have the money to spend and are also shedding their earlier
inhibitions about spending more on eating out experience.
Eating-out as an Experience
With multiple binding time-commitments, both on the personal and professional fronts, consumers look
forward to experiences in order to distress from their hectic routines. Apart from pure entertainment
avenues such as movies and social get-togethers, eating-out has emerged as a prominent avenue for
relaxing and spending quality time with the family or with friends.
The emergence of newer formats and their popularity as hang-out destinations is an anecdotal evidence
of these underlying trends. A schematic representation of the time spent by an urban couple annually on
various activities in a year shows that a total of 9 days are spent on eating-out itself.
17Indian Food Services Industry Overview
Exhibit 14: Number of days in a year spent by an Urban Indian Couple on various activities
Source: Technopak Research & Analysis
This has led to an increase in the overall spending on eating-out at a house hold level across various city
types. The penetration of Food Services in India has largely been in the northern, southern and western
parts of the country. Major developed cities and towns in the country with high net worth individuals lie in
these parts of the country, resulting in higher spend on eating-out.
Exhibit 15: Spending Pattern and Format Preferences among Consumers
City Type Avg HH Size Preferred Formats Avg Spend per HH Eating Out
per month (INR) Frequency per
month per HH
Metros 4.09 QSR (37%) 6,500 – 6,750 7–8
CDR (25%)
Mini Metros 4.12 QSR (48%) 4,500 – 4,750 5–6
CDR (21%)
Tier I & II 4.8 CDR (40%) 2,750 – 3,000 4-5
QSR (31%)
Source: NRAI Technopak India Food Services Report 2016, Technopak Analysis
18 INDIAN FOOD SERVICES INDUSTRY: ENGINE FOR ECONOMIC GROWTH & EMPLOYMENT
A Roadmap for Unlocking Growth OpportunitiesFood Services Ecosystem
The Indian Food Services universe (including organized and unorganized segments) has grown at a 7.7%
CAGR over last three years and is expected to grow at a rate of 10% over the next five years. The growth in
Food Services has provided impetus to allied industries. Key allied industries which support Food Services
and have benefited from its growth are:
• Agriculture and Food Processing
• Supply Chain and Logistics
• Real Estate
• Kitchen Equipment and Commissary
Agriculture and Food Processing
The food processing sector in India is estimated to be INR 7 lakh crore. ~6-8%
The output of the food processing sector like breads, buns, jams, meat Food Processing-inputs to Food
Services (%)
and poultry, processed dairy, beverages etc. form direct inputs of the Food
Services industry, while fresh produce like fruits and vegetables are direct ~0.8-1%
Food Processing-inputs to Food
agricultural inputs. Nearly 6-8% of food processing output and ~0.8% of Services (%)
agricultural output (e.g. fruits and vegetables) goes in the Food Services
Source: NRAI Technopak India Food
industry. Services Report 2016, Technopak
Analysis
The growth in the Food Services industry has also given impetus to the
food processing industry. With the organized Food Services segment showing a faster growth, demand
for products with higher safety standards will boost demand for food processing and agriculture sector.
Operators will demand more standardized quality raw materials and semi-processed products with higher
safety standards. McDonalds is a case in point, where the suppliers have continuously engaged with
farmers to standardize and improve the quality of farm produce, thereby leading to better farm practices
and technology transfers.
The last decade has seen the emergence of a large number of organized food processors having a strong
focus on the HoReCa (Hotel, Restaurant, Catering) segment. Sumeru, Venky’s, Vista, Mrs. Bector, CP
Foods, Amrit Foods, Trikaya Agriculture, Dynamix Dairy etc. are some of the players whose major business
comes from the HoReCa segment.
Supply Chain & Logistics
The Indian supply chain and logistics market is estimated to be ~ INR 24-26 lakh crore and is one of the
most fragmented industries in the world. Due to an inefficient supply chain, it is estimated that annually
about 18% of food is wasted (conservative estimate). Lack of an adequate cold chain infrastructure and a
fragmented food processing supply chain will further add to this wastage.
19Indian Food Services Industry Overview
Exhibit 16: Food Wastage across Supply Chain
~INR 180,000
crores
Source: CIPHET, Technopak Analysis
It is estimated that the share of organized Food Services in the supply chain and logistics sector is ~INR
3,575 – 3,900 crore. Chain segment growth will have a proportionally positive impact on creating an
efficient supply chain. Entry of international QSR chains in India has helped in increasing standards and
adoption of better practices by supply chain players.
Efficient supply chain and logistics form the backbone of any Food Services operator who plans to grow
and expand its business across regions. Food Services players have understood this and are investing
in creating supply chain infrastructure and also work actively with their supply chain partners to ensure
seamless integration of supply chain with company’s business. Some of the well-known players in the
logistics and supply chain industry are also cashing in on the opportunity provided by the Food Services
industry. About ~10% of the revenue of Snowman Logistics is contributed by Food Services industry and
they provide end to end solutions to clients like Compass Group and Sodexo. Radha Krishna Foodlands
is another leading player in the logistics and supply chain industry catering to chains like McDonalds and
Haagen - Dazs to name a few.
The Food Services operators are also increasingly adopting technology to make the supply chain more
agile, responsive and cost effective. New tracking software and standards are helping restaurant
operators to have a better understanding of where food comes from. Operators have to collate data
and information regarding raw material types, quantity, ordering cycles, customer information etc. As
companies grow and tasks become more complex, technologies like ERP allow them to manage data
more efficiently across these activities.
Real Estate
The demographic insights of India propose that India can be a leading real estate destination globally.
It is projected that the real estate sector will increase five-fold and reach ~INR 43.5- 44.2 lakh crore
by 2025. The Indian real estate sector has been a major beneficiary of the strong economic growth
witnessed in India since the year 2000. The growth in the sector, on the back of a series of reforms, has
not only resulted in significant residential and commercial real estate growth, but also complemented the
development of physical and social infrastructure of the country.
20 INDIAN FOOD SERVICES INDUSTRY: ENGINE FOR ECONOMIC GROWTH & EMPLOYMENT
A Roadmap for Unlocking Growth OpportunitiesThe organized retail is expected to reach INR 23 lakh crore during the same period. Assuming revenue of
INR 19,500-21,125 per square foot per year for a large retail store set-up in India, the total incremental
demand for organized retail space by 2022 could possibly reach 500-530 million square feet. Currently,
70% of the retail space stock is accounted for by top 7 cities of Delhi, Mumbai, Bengaluru, Pune,
Hyderabad, Chennai and Kolkata.
Food Services has recently emerged as a key sector in driving the retail space. Due to heavy demand, Food
Services has emerged as leading segment to increase footfalls. With intent to leverage on higher revenues
generated by the segment, malls are leasing out prime floor spaces to bring new F&B brands within their
fold.
On an average, ~20-25% of the mall space is dedicated to Food Services outlets. Revenue share between
the operators and mall developers is also an emerging business model, wherein the Food Services
operators share 6-8% of their revenues. The concept of mall spaces dedicated completely to Food
Services is also coming up. Some key examples being Epicuria and Sangam Courtyard in Delhi. Epicuria
in Nehru Place started in 2013 and houses some of the most popular Food Services brands like Pizza
Express, Starbucks, Burger King, KFC, The Beer Café, Social to name a few. Similarly, Sangam Courtyard
which started in 2015 is a dedicated food mall having brands like Café Diva, Tha Fatty Bao, Ziu and Delhi
Club House etc.
Exhibit 17: Modern Retail Space Potential across Key Geographies
Geography Modern Retail Space Potential
(Mn sqft)
Delhi - NCR 31
Mumbai 13
Bengaluru 9.2
Source: Cushman Wakefield and Industry Reports
However, high rental across malls and high street spaces are a rising concern for the Food Services
operators. The real estate sector will further benefit from the growth of organized Food Services, which
currently contributes 33% of the total Food Services market and growing at CAGR of 11% will be 41% of
the overall Food Services market in next 2 years. Food Services chains would need an additional 13-15
million square feet of real estate in the next 5 years.
Packaging
Indian packaging industry is estimated at ~INR 2,90,000 crore1 and is expected to reach to ~INR 4,75,000
crore by 2020. Indian packaging offers employment to more than 10 lakh people across the country
through ~10,000 firms.
1
Source: Plastic Packaging: The Sustainable Choice, TSMG - FICCI, 2016 Report
21Indian Food Services Industry Overview
The total demand of F&B packaging segment stands at around INR ~117,000 crore, and the Food
Services based packaging has a contribution of ~2.5% which amounts to INR 2,600 crore. The share of
flexible packaging is increasing within the Food Services packaging.
Moreover, with increasing competition in the Food Services industry and growing focus towards health
and hygiene brands are discovering that packaging has the potential to be a key differentiator. A lot of new
materials are increasingly being used like insulated double-wall paper cups, as well as insulated plastic
cups made from polypropylene (PP) and polyethylene terephthalate (PET).
Increasing interest in composting and recycling of Food Services packaging are driving some material
selections as well. Packaging plays an increasingly important role in supporting menu trends and
consumer demands due to more competition and growth in the ‘grab n go’ category, stronger interest
from convenience stores and changes in distribution channels. Some of the major players in the food
packaging segment are Biopac, Parksons Packaging Limited, Paper Products Private Limited and ITC
Packaging. With a lot of food-tech delivery focused start-ups coming up and the home-delivery and take-
away segment gaining traction, the demand for quality packaging materials is bound to increase, thereby
positively impacting the packaging industry.
Kitchen Equipment, Commissaries and Back-End Kitchen
The total established base for HoReCa equipment amounts to ~INR 22,000 crore in 2017. By 2022 an
additional ~INR 12,000-13,000 crore will be added to the equipment market. Restaurants are the highest
contributors, having a share of about ~70%, followed by hotels (27%) and the remaining by caterers. The
equipment industry has evolved over the last two decades, with increasing presence of international
formats.
The commissaries and back-end kitchen segment can be classified into the following segments:
• Back-end Kitchens: centrally preparing food for self-owned outlets. E.g. Jubilant Foodworks, Dish
Hospitality, Barista
• ravel Industry Commissaries: catering to railways and airlines. E.g. Tajsats, Oberoi Flight Services,
T
Sky Gourmet
• Corporate Catering: preparing food for corporate and industrial messes. E.g. Sodexo, Compass Group,
Tirumala
• Commissaries catering to multiple brands: e.g. India Hospitality.
The chain Food Services market has more than 60% contribution from segments (QSRs/Cafés/CDRs)
procuring from commissaries to maintain uniform quality and taste standards.
The chain Food Services market has more than 60% contribution from segments (QSRs/Cafés/CDRs)
procuring from commissaries. To sustain their growth and develop profits these segments will have to
build a robust supply chain. Commissaries have the potential to play the role of key supply chain partners
as they help in maintaining uniform quality and taste standards. Commissaries will have the potential to
develop themselves as the link between Food Services operators, processors and food producers.
22 INDIAN FOOD SERVICES INDUSTRY: ENGINE FOR ECONOMIC GROWTH & EMPLOYMENT
A Roadmap for Unlocking Growth OpportunitiesKey Trends Influencing Food Service Industry
Social Media/Digital Marketing
In the Food Services industry, marketing spends constituted 4-6% of the total revenue for majority of the
players for FY 2016-17. With the number of people accessible through smart devices on the rise, digital
media has become quite indispensable, and the use of the medium for marketing initiatives has been on
the rise. While traditional media offers mass reach and visibility, digital media provides quick response
time, direct consumer feedback on the efficacy and effectiveness of the initiatives and enables dynamic
campaigns targeting extremely focused audience groups. Also, the investment in creating a digital
campaign that reaches out to specific target group is much lower when compared to traditional media, i.e.
television and print.
The large players especially the chains observe 65-70% of the marketing budget being spent on traditional
media and the balance 30-35% on digital media. However, for the rest of the industry 20-30% of the
marketing budget is spent on traditional media whereas 70-80% is spent on digital media. A focused /
targeted marketing campaign to a specific and well defined target audience is becoming more important
than mass marketing. Reaching to the niche and direct audience is more important than reaching out to
mass populace, since acquiring and engaging with loyal customers is more beneficial for any brand.
The trend reflects that the percentage share of marketing budgets spent through digital initiatives is only
going to increase over the years, given the cost effectiveness and efficacy of the medium.
The Café segment invests heavily on Third Party Aggregators (50%) as it makes the discovery for
consumers easier. This is followed by spends on Social Media (30%), SEO/SEM/Email Marketing (10%) and
Display Marketing (10%).
For the QSR segment, Digital Video is the most important avenue for investment (50%) followed by Online
Search/Email Marketing (20%), Social Media (20%) and Display Marketing (10%).
The Casual Dining segment invests a majority of their marketing budget on Search / Email Marketing
(51%) majorly for discovery and communicating promotional offers. This is followed by Mobile Ads/SMSes
(19%) as these can be used to communicate personalized and location based promotional offers. The rest
of the marketing budget is distributed between Social Media (9%), Digital Video (9%), Display Marketing
(9%) and Third Party aggregators (2%).
The Fine Dining segment invests its marketing budget largely on Social Media (43%) as it is the content
and promotional offers that will drive the consumers’ awareness. This is followed by Search / Email
marketing (26%) which helps in discovery and communicating offers in a more personalized fashion
followed by Digital Video (12%) and Display Marketing (11%). This segment doesn’t spend much marketing
budget on Third Party Aggregators and Mobile Ads/SMSes.
The PBCL segment also invests a large portion of the budget on Social Media (40%) such as Facebook,
Instagram, Twitter etc. and Third Party apps (40%) such as Zomato, Foodpanda, Swiggy, My Butler, Burrp
etc. Investments are also made in Digital Video (10%) and search and Search / Email marketing (10%).
For the Frozen Dessert/Ice Cream segment, 57% of Digital Marketing budgets are spent on Digital Video.
The rest of the budget is equally distributed between Search / Email Marketing, Third Party Aggregators
and Social Media.
23Indian Food Services Industry Overview
Technology use in these markets
Technology has disrupted Food Services industry in the following 3 key segments:
ood Discovery/Restaurant Search: Earlier food enthusiasts had to wait for annual food guides
F
and eating out directories of restaurants. These publications had expert reviews, opinions and vital
information to dine in the city. Now, these directories, expert reviews and opinions are made available by
food discovery or restaurant search players on just a few clicks, a feat attained by food discovery players.
Zomato is a restaurant search and discover service provider launched in 2008, currently its revenue is INR
318 Crore2 (FY 2016 – 17).
Table Reservation: Of late it has become common for fine dining restaurants to offer table reservations
to their clients. In fact, this service has become an integral part of a restaurant’s operation, because of
its multiple benefits. With this service, outlets can estimate demand more accurately and improve on
sourcing & staffing and can manage costs more efficiently. It is beneficial to a customer as reservation
will guarantee one’s table at the time and place he has planned and likely to receive better service at
the outlet as details like time of arrival, no of persons etc. will be shared with the outlet in advance 25%
of all reservations are currently through reservation portals and are projected to grow to 62 - 65% by
2022. Dineout operates as an online restaurant booking site, launched in 2012, current sales number are
4,00,000 diners per month3
Online Delivery: Technology has eased the process of customers having to travel to an outlet for eating
out. Today customers can use their smartphones to order food from any restaurant of their choice and
get it delivered too. No waste of time, no traffic hassles, no quality compromise – consumers are able
to save time and enjoy restaurant food at the same time. Platforms like Foodpanda pioneered the food
ordering industry in 2012, with the idea of providing an end to end food ordering and delivery solution to
urban consumers from the neighbourhood restaurants, which now stands at a revenue of INR 37 crore
(FY 2015-16) and reaching over 15 million users per month. Later on, in 2014, Swiggy was started which
now has a revenue of INR 24 crore.4
A company is categorized a food-tech if they are using explicit technology to reach out to customers for
food review, food delivery or providing food ingredients etc.
Impact of Advent of Capital Availability
Private investments can be broadly categorized into three stages – early stage, growth stage, and
mature/late stage. Private Equity investments in India touched a record high of INR 109,200 crore in 2015
(across 661 deals), 16% higher than the previous high of INR 94,250 crore (across 529 deals) recorded
in 2007 and a whopping 50% higher than the INR 72,800 crore (across 530 deals) invested during the
previous year.
Other than growing GDP and per capita income, there are micro trends that are propelling the restaurant
industry itself and consequently PE investments in the sector. Further, PE firms are adding management
inputs to the restaurants. Restaurant sector is a long-term play for PE investors, and not a transitory
trend. PE investors are typically looking at making a minimum of at least 3x in a four-year timeframe.
Also, there’s a certainty in cash flows if the model is right. That, along with growth, should allow private
equity to make fair returns from this sector.
2
http://www.livemint.com/Companies/sz9zKM7IN02LIcEOmTYEHM/Zomato-says-revenue-up-80-to-49-million-in-FY17.html
3
https://www.dineout.co.in/
4
https://timesofindia.indiatimes.com/deals/-ma/zomato-explores-merger-with-rival-swiggy/articleshow/61377938.cms
24 INDIAN FOOD SERVICES INDUSTRY: ENGINE FOR ECONOMIC GROWTH & EMPLOYMENT
A Roadmap for Unlocking Growth OpportunitiesExhibit 18: Return on Investment
Early Growth Late Stage/Mature
Return expectations 40-50% p.a. 25-30% p.a. 18-25% p.a.
Source: NRAI Technopak India Food Services Report 2016, Technopak Analysis
Exhibit 19: PE/VC Investments
S. Company Company Format Investment Year
No.
Early Stage
1 Charcoal Biryani Lion Ventures QSR 1 Cr 2016
2 Biryani Blues Carpediem Capital Partners QSR 3 Cr 2015
3 Carls Jr India Now Capital, YouWeCan Ventures QSR 2 Cr 2015
4 Maroosh Trans Continental VC QSR 7 Cr 2015
5 White Owl RAAY Global Investments CDR 4 Cr 2015
6 Chaayos Tiger Global Café 32 Cr 2015
7 Boombox Café, Café Out of the Box Now Capital Café NA 2015
8 Maroosh Unilazer Ventures QSR 18 Cr 2014
9 Rocket Sandwich Unilazer Ventures, India Quotient QSR NA 2013
10 The Beer Café Mayfield Café 25 Cr 2013
11 Dana Choga SAIF CDR 5 Cr 2013
12 Faasos Sequoia Capital India QSR 33 Cr 2013
Growth Stage
Mamagoto, Speedy Chow, Rollmaal Max Ventures & Industries and QSR/CDR 66 Cr 2016
1
Goldman Sachs
2 Mamagoto, Speedy Chow, Rollmaal Goldman Sachs QSR/CDR 65 Cr 2015
3 Masala Library, Made in Punjab, Everstone CDR/FDR/ 24 Cr 2015
Farzi Café PBCL
4 Barbeque Nation CX Partners CDR 107 Cr 2015
5 The Beer Café Granite Hill, Mayfield, Harsh Mariwala Café 30 Cr 2014
6 KFC, Pizza Hut and Costa Coffee Temasek QSR/CDR/ 500 Cr 2014
Café
7 Spaghetti Kitchen, Copper Verlinvest, Everstone QSR/CDR/ 7 Cr 2014
Chimney, CBTL FDR/Café
8 Only Alibaba and Baked & Fried SEAF QSR 15 Cr 2014
9 Faasos Sequoia Capital India QSR 20 Cr 2013
10 Burger King India Everstone QSR NA 2013
11 Barbeque Nation CX Partners CDR 110 Cr 2013
25Indian Food Services Industry Overview
S. Company Company Format Investment Year
No.
Buyout
1 Indigo, Indigo Deli India Value Fund CDR/FDR 190 Cr 2015
2 KFC and Pizza Hut Samara, GS Investments, CX Partners, QSR/CDR 205 Cr 2015
Others
3 Moshe’s New Silk Route Café/CDR NA 2013
PIPE
1 Mainland China, Oh ! Calcutta, etc SAIF CDR 14 Cr 2014
2 Mainland China, Oh ! Calcutta, etc SAIF CDR 35 Cr 2013
Note: NA – Not available,*Private investment in public equity. Source: Venture intelligence and news articles
Other Trends Influencing the Food Services industry
Virtual Kitchen
The last couple of years have seen a growth in number of food tech start-ups not only in terms of new
models of aggregators but also food creators and cloud/virtual restaurants. These companies serve high
quality hygienic food prepared under the guidance of well-known chefs, so it tastes like restaurant food
with hygiene coefficient of homemade food.
Ingredient Players
Desire to eat home-made fresh food without spending much time in cooking from scratch has led to
evolution of new category of food tech companies called ‘Ingredient players’. These companies deliver
recipes or ingredients designed by trained chefs at the door step and consumers need to follow the
instruction given in the manual to prepare a fresh dish within no time.
Logistics
Timely delivery of the food ordered is considered as the major challenge for the Food Services industry.
A new trend is coming up in logistics/delivery space, where new companies with some innovation are
coming up in this space, these companies also work as courier service provider, gift delivery partner etc.
and wish to grow with the growth of the associated service providers and these companies are providing
the solution to that as they guarantee timely delivery to the customers.
Location
While malls and high streets have been traditional locations for F&B outlets, we are witnessing emerging
trend of new breed of food centric destinations.
Cuisine Trends
A revival of old recipes, regional cooking and connect with the history of cooking:
26 INDIAN FOOD SERVICES INDUSTRY: ENGINE FOR ECONOMIC GROWTH & EMPLOYMENT
A Roadmap for Unlocking Growth OpportunitiesA new trend has started by few well know chefs and food enthusiasts where they are reviving the
forgotten old or regional recipes and connecting consumers with history of cooking.
Increasing demand for ‘Modern Indian Cuisine’:
A new development is being crafted in Indian restaurant industry where consumers can experience the
modern Indian food prepared by using elements of molecular gastronomy.
Food on the Go
Increased penetration of Food Services in travel destinations airline and railway traffic has been
registering a continuous growth in India. This increase in traffic has necessitated the growth of
infrastructure in the form of new airports and railway stations or area expansion of existing airport
terminals or railway stations. Since F&B is an important component of such terminal/stations, this is
creating new opportunity for F&B operators.
Contactless Payment
Mobile Wallet: Payment platform industry evolves with evolution of shopping patterns. Mobile wallet is a
new concept in India that is slowly beginning to replace the traditional payment methods.
Mobile wallet payment system has got huge potential in India as less than 10% transactions take place
through digital channel and mobile wallet is miniscule part of digital payment.
With infrastructure improvement and wider acceptance, mobile wallet will be a popular mode for payment
at restaurants and retail outlets.
27Unlocking Growth Potential
Unlocking Growth Potential
Importance of Food Services Industry to Economy’s Growth
The Indian economy has a significant presence on the global economic stage. During FY 2010 to FY 2016,
India’s Real GDP grew at a CAGR of 7.3%. It is estimated that GDP will grow at a CAGR of 7.6 % from FY
2016 to FY 2022 and India will be in the top three global economies by 2050.
The Indian economy is pegged to reach an estimated ~INR 230 lakh crore by 2020 (nominal terms) and .
Food Services emergeas a key segment in Indian economy, with the overall market worth INR 3,37,500
crore (2017) which is ~8 times bigger than hotels. The market’s growth will be powered by changing
consumer dynamics and increasing market proliferation by brands in the space.
Share of Food Services Spend in Consumption
The Indian economy, worth INR 155 lakh crore in FY 2017, is estimated to reach INR 230 lakh crore by FY
2020.
Globally India is seen as one of the key consumer markets from where future growth is likely to emerge.
As more people move beyond the basic sustenance level in any country, it reflects in consumption
expenditure. Although, the share of Private Final Consumption Expenditure (PFCE) as percentage of
GDP is slowly decreasing, in absolute terms it has increased from INR 10 lakh crore to INR 87 lakh crore
(1980 – 2016). Rising income levels coupled with growing young working-age population will lead private
final consumption expenditure to grow steadily over the years. Growth in Private Final Consumption
Expenditure is expected to average at around 7.2% of GDP during FY11-FY20.
It is estimated that India’s consumption expenditure will increase to INR 130 lakh crore by 2020 and will
surpass the consumption expenditure of developed economies like Italy, France and United Kingdom.
The rising disposable income is fuelling the overall spend on discretionary items. The per capita personal
disposable income has grown at a CAGR of 14% from 2005-2012. The share of expenses on discretionary
purchase categories like grooming, apparel, consumer electronics and durables, as well as experiences
such as eating-out and dining-in increases, while the share of expenses on basic necessities reduces.
This shift in spending patterns has given rise to a number of micro-trends within the overall consumption
basket in India.
The share of spending in basic goods (food, beverages & tobacco and clothing & foot wear) in private final
consumption expenditure is expected to decline substantially to about 36% in FY20, versus 45% in FY11.
On the other hand, share of discretionary spending (rent, fuel & power, furniture, medical care, transport &
communication, recreation & education) is projected to increase to rise from 55% (P) in FY11to around 64%
in FY20.
28 INDIAN FOOD SERVICES INDUSTRY: ENGINE FOR ECONOMIC GROWTH & EMPLOYMENT
A Roadmap for Unlocking Growth OpportunitiesYou can also read