INDONESIA SELECTED ISSUES - International Monetary Fund
←
→
Page content transcription
If your browser does not render page correctly, please read the page content below
IMF Country Report No. 15/75
INDONESIA
March 2015
SELECTED ISSUES
This Selected Issues paper on Indonesia was prepared by a staff team of the International
Monetary Fund. It is based on the information available at the time it was completed on
February 23, 2015.
Copies of this report are available to the public from
International Monetary Fund Publication Services
P.O. Box 92780 Washington, D.C. 20090
Telephone: (202) 623-7430 Telefax: (202) 623-7201
E-mail: publications@imf.org Internet: http://www.imf.org
Price: $18.00 per printed copy
International Monetary Fund
Washington, D.C.
©2015 International Monetary Fund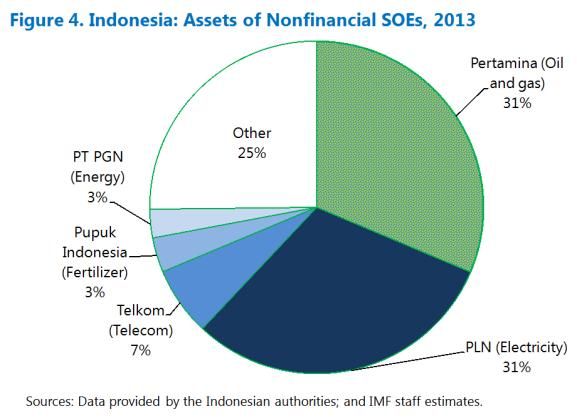
INDONESIA
                    SELECTED ISSUES
February 23, 2015

                     Approved By                Prepared By Seng Guan Toh (APD), Masahiro Nozaki (FAD),
                     Asia and Pacific           and Lawrence Dwight (SPR)
                     Department

                       CONTENTS

                    THE IMPACT OF MAJOR COMMODITIES ON THE CORPORATE SECTOR
                    AND BANKING SYSTEM_________________________________________________________________ 3
                    A. Introduction __________________________________________________________________________ 3
                    B. Recent Trends ________________________________________________________________________ 3
                    C. Impact on Corporate Sector __________________________________________________________ 6
                    D. Impact on Banking System ___________________________________________________________ 8
                    E. Near- to Medium-Term Outlook for the Commodities Sector _______________________ 11

                    FIGURES
                    1. Recent Trends in the Commodities Sector ____________________________________________ 4
                    2. Export Destinations for Major Commodities __________________________________________ 5
                    3. Exports, Revenues, and Profits by Sector _____________________________________________ 7
                    4. Debt Indicators for the Commodities Sectors _________________________________________ 9
                    5. The Banking System and Commodities Sector _______________________________________ 10
                    6. Global Outlook ______________________________________________________________________ 12

                    TABLES
                    1. Changes in Export Receipts ___________________________________________________________ 6
                    2. Drivers of Revenues and Profits, 2008–13 ____________________________________________ 6

                    MANAGING FISCAL RISKS IN INDONESIA ____________________________________________13
                    A. Introduction and Main Observations ________________________________________________ 13
                    B. General Government Fiscal Position and Debt Sustainability ________________________ 14
                    C. Nonfinancial State-Owned Enterprises ______________________________________________ 18
                    D. Health and Pension Spending _______________________________________________________ 19
INDONESIA
FIGURES
1. Selected Emerging Market Economies: Public Debt Profile, 2014 ____________________ 15
2. Contingent Liability Shock ___________________________________________________________ 16
3. Government Debt and Foreign Investors, 2009–14 __________________________________ 17
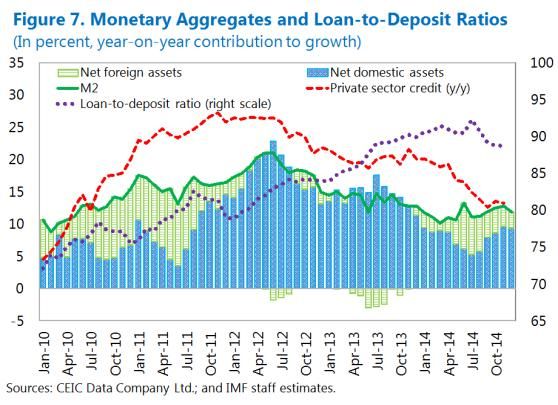
4. Assets of Nonfinancial SOEs, 2013 ___________________________________________________ 18
5. Financial Indicators of Nonfinancial SOEs, 2009–13__________________________________ 20
6. Selected Emerging Market Economies: Public Health and Pension Spending,
2010–12 _________________________________________________________________________ 21
7. Demographic Prospects and Public Health and Pension Spending, 2010–50 ________ 22
TABLES
1. General Government Debt, 2008–2013 ______________________________________________ 14
2. Central Government Operations, 2014–15 ___________________________________________ 18
References ______________________________________________________________________________24
RECENT DEVELOPMENTS IN BANKING SYSTEM LIQUIDITY__________________________25
A. Introduction _________________________________________________________________________ 25
B. Characteristics of Banking System Liquidity in Indonesia ____________________________ 25
C. Recent Trends in Bank Liquidity Conditions _________________________________________ 27
D. Role of Policy Actions _______________________________________________________________ 30
E. Near-Term Prospects and Risks______________________________________________________ 31
F. Implications for the Monetary Transmission Mechanism in the Current
Environment _____________________________________________________________________ 32
FIGURES
1. Banking System Liquid Assets and Concentration ___________________________________ 25
2. Current and Saving Accounts, 2013__________________________________________________ 26
3. Loan Versus Deposit Growth ________________________________________________________ 27
4. Contribution to Customer Deposit Growth __________________________________________ 27
5. Selected ASEAN Countries: Loan-to-Deposit Ratios _________________________________ 28
6. Bank Indonesia’s Liquidity Absorption by Instrument ________________________________ 28
7. Monetary Aggregates and Loan-to-Deposit Ratios __________________________________ 28
8. Loan-to-Deposit Ratios by Bank Size ________________________________________________ 29
9. Funding, Deposit and Lending Rates, and Interest Margins __________________________ 29
10. Policy and Interbank Rates and Deposit Facility _____________________________________ 30
11. Foreign Ownership Share of Rupiah Government Bonds ____________________________ 32
References ______________________________________________________________________________33
2 INTERNATIONAL MONETARY FUND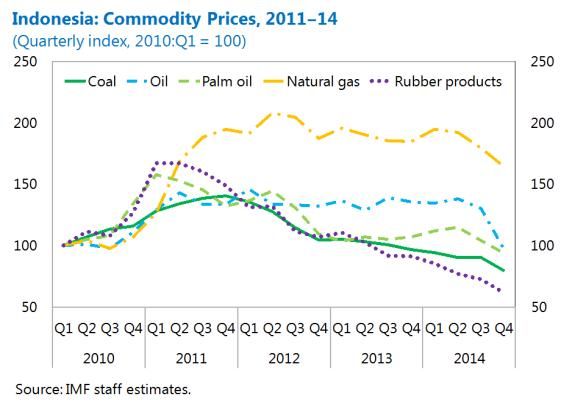
INDONESIA
THE IMPACT OF MAJOR COMMODITIES ON THE
CORPORATE SECTOR AND BANKING SYSTEM1
A. Introduction1
1. This note looks at links between Indonesia’s commodities sector and recent corporate
sector and banking system performance.2 On the production side, oil and natural gas output has
fallen since 2010, with existing fields in decline, while production of coal, palm oil, and rubber
output has increased steadily. At the same time, prices have mostly trended down since late 2011,
reflecting the current commodity down-cycle, which has led to a significant drop in revenues.
Substantial swings in prices have also contributed to volatility in revenues and profits for commodity
producing firms, while their leverage has been rising. While these firms have tended to rely more on
internal financing, and lately on external borrowing, and less on borrowing from resident banks.
Nevertheless, some banks are seeing a rise in nonperforming loans (NPLs) tied to the mining and
agricultural sectors, but from a small base. Facing the near-term prospect of weak revenue
generation and tighter financial conditions, commodity producers’ balance sheets could come under
further pressure absent a noticeable pick up in external demand. This development could have
knock-on effects to other parts of the economy, particularly in more commodity dependent rural
areas.
B. Recent Trends
2. The contribution of Indonesia’s commodities sector to economic activity remains
significant, but the value of production and exports has declined sharply in recent years. Total
production accounted for around 9 percent of GDP in 2014, compared to 14 percent in 2011
(Figure 1). Major commodities still comprised about half of all merchandise exports in 2014.
However, since their peak in 2011, the overall value of commodity exports has fallen by almost
30 percent in U.S. dollar terms. This decline has occurred across all products, but the causes have
differed. For coal, palm oil, and rubber, the drop in the value of exports has been mainly driven by
the recent slump in commodity prices, but for oil and gas underinvested and declining production
capacity has been a key factor (Table 1).
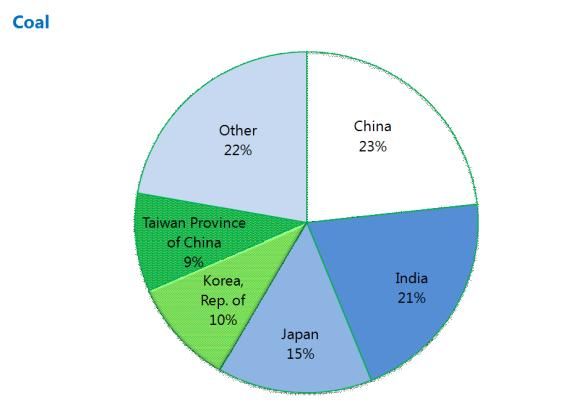
3. Markets for Indonesia’s commodity exports vary by product (Figure 2). While China has
been an important and fast growing trading partner (coal and metal ores), Japan is still Indonesia’s
largest export market (oil and natural gas). Singapore (including re-exports), the United States
(rubber products), India (coal and palm oil), and Korea (most commodities) are also important
1
Prepared by Lawrence Dwight.
2
The focus of this note is on the export-oriented commodities sector, which is dominated by coal, oil, natural gas,
metal ores, palm oil, and rubber products in Indonesia.
INTERNATIONAL MONETARY FUND 3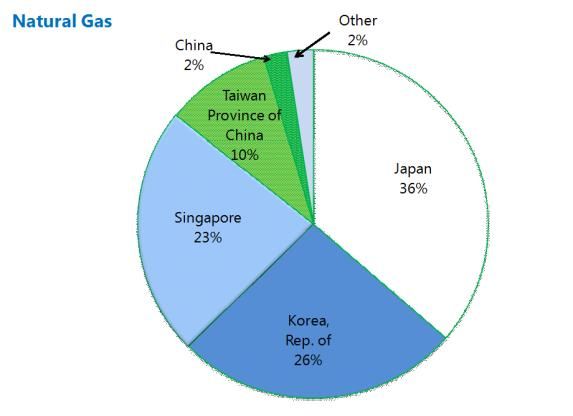
INDONESIA

               Figure 1. Indonesia: Recent Trends in the Commodities Sector

4   INTERNATIONAL MONETARY FUND
INDONESIA

                Figure 2. Indonesia: Export Destinations for Major Commodities 1/

Sources: Global Trade Atlas; and IMF staff estimates.
1/ Figures are averages for 2011–13.

                                                            INTERNATIONAL MONETARY FUND         5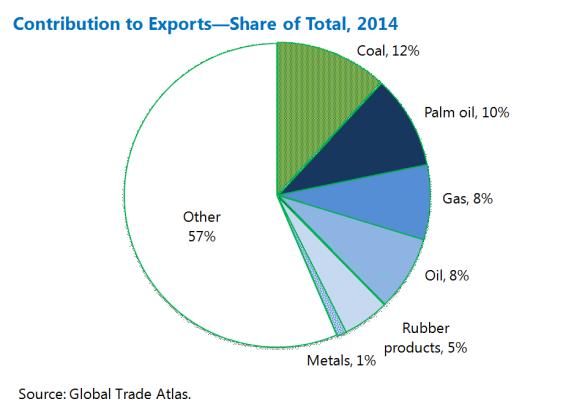
INDONESIA

markets. As of August 2014, the agriculture sector employed around 39 million people (34 percent
of the total, but mainly outside the export-oriented commodities sector), while the mining and
quarrying industry provided employment to 1.4 million people (1.3 percent of the total).

C. Impact on Corporate Sector

4.      Recent trends in commodity
exports have had a significant impact on
corporate revenues and profits.3 In
general, revenues and profits of commodity
producers have been highly correlated with
the U.S. dollar value of exports and global
prices (Table 2 and Figure 3). For the oil and
gas, metal ores, and palm oil and rubber
sectors, profits have been highly correlated
with global prices. However, in the coal

3
 Corporate financial data covers the largest companies in each industry for which data was available. Many
corporations are active in both the oil and gas sectors and palm oil and rubber sectors, respectively. Thus, the
corporate financial data is combined for these two pairs of sectors.

6    INTERNATIONAL MONETARY FUND
INDONESIA

Figure 3. Indonesia: Exports, Revenues, and Profits by Sector

                                           INTERNATIONAL MONETARY FUND      7
INDONESIA
sector, profits and revenues show lower correlations with prices, indicating that production also
plays a role. These observations are consistent with the view that the coal sector in Indonesia has a
relatively low cost of entry and is more competitive so that producers attempt to boost output to
cover costs when prices fall. However, it also means that coal producers have lower profit margins.
5. For corporations operating in the nonrenewable commodities sector, liabilities and
debt ratios have increased significantly in recent years (Figure 4). This trend may reflect lower
global interest rates, which made debt financing more attractive, especially for exporters that have
access to U.S. dollar revenues.
In the coal sector, liabilities have risen by about 30 percent per year on average since 2008,
while operating revenues have grown only 10 percent and profits have declined. The
increase in liabilities shows up in leverage ratios, with the debt-to-equity ratio in the coal
sector around 80 percent at end 2013—doubling since 2008.4 Given a high correlation
between prices and profits, further declines in prices could result in higher leverage ratios.
The oil and gas sector largely reflects developments at Pertamina. Debt liabilities in the
sector have increased more than six-fold since 2008, and leverage ratios have also risen, with
the debt-to-equity ratio at 80 percent at end 2013. Pertamina itself began to issue global
bonds in 2011. The increase in funding in this sector reflects the need for substantial
investment to maintain production, as existing oil and gas fields naturally decline.
In the metals mining sector, liabilities have also risen rapidly, with annual growth
averaging 20 percent since 2008. With operating revenues and profits flat during this period,
however, leverage ratios have increased. Nevertheless, the debt-to-equity ratio remains low
at just over 20 percent.
In the palm oil and rubber sectors, liabilities have risen in U.S. dollar terms but the debt-to-
equity ratio has not shown an overall trend, ranging from 40‒60 percent.
D. Impact on Banking System
6. Direct exposure of the banking system to the agriculture and mining sectors is
relatively low.5 At the same time, weak commodity sector revenues have been a factor in slower
deposit growth, contributing to funding pressures in the banking system. While loans to
4
These figures exclude liabilities of PT Bumi Resources, a large thermal coal producer in Indonesia, which had its
rating cut by Standard & Poor’s to default in December 2014. It holds 40 percent of the liabilities of companies in the
coal sector for which data were available.
5
Banking data are more aggregated than corporate financial data. Bank Indonesia reports outstanding loans to and
NPLs for mining and quarrying (including coal, oil, and gas) and agriculture (including palm oil and rubber) but not to
individual sectors.
8 INTERNATIONAL MONETARY FUND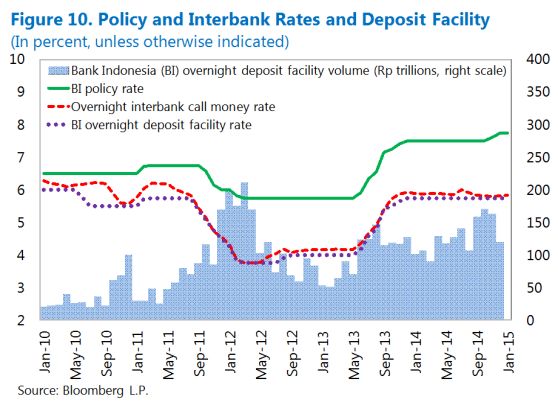
INDONESIA

Figure 4. Indonesia: Debt Indicators for the Commodities Sectors

                                            INTERNATIONAL MONETARY FUND        9
INDONESIA
Figure 5. Indonesia: The Banking System and Commodities Sector
10 INTERNATIONAL MONETARY FUNDINDONESIA
agriculture and mining as a share of total loans outstanding are only 6 percent and 3½ percent,
respectively (Figure 5), banks’ exposure could be larger via indirect effects on other related sectors,
for example construction and equipment. Some lending to commodity-related activity may also be
classified as lending to processing-related sectors.
7. Different types of banks have different exposures. For agricultural loans, state and rural
banks have higher exposures, given their customer base. For mining, foreign banks have the largest
exposure, likely reflecting relationships arising from heavier foreign investment in this sector. Banks’
concentration risk appears to be contained, nonetheless, since even for the banks with the largest
exposures the loans to each sector constitute less than 10 percent of all loans outstanding. Still,
caution is warranted, given these sectors’ common risk exposure profile to a price shock.
8. Nonperforming loans in the agriculture and mining sectors have been lower than the
average, but those in mining have risen recently, drawing closer to the average for all sectors.
Broadly speaking, the major lenders to agriculture (state and rural banks) and to mining (foreign and
joint venture banks) have relatively low NPLs. For regional government banks, NPLs have surged in
both the agriculture and mining sectors, but loans to these sectors account for only a small fraction
of these banks’ loan portfolios.
E. Near- to Medium-Term Outlook for the Commodities Sector
9. Risks facing the commodities sector will likely stay elevated in the near term, given
slowing growth of several major trading partners and the outlook for lower commodity
prices. (Figure 6). To contain the effects of weak profitability and higher leverage of commodity
producing firms on the broader economy, steps to improve monitoring of corporate sector
performance, including external borrowing, should help. However, it will also require close
supervision of those banks heavily exposed to commodity sectors, given the likelihood that NPLs will
increase if demand conditions faced by commodity producers fail to improve. Fiscal and structural
reforms aimed at improving Indonesia’s competitiveness could help commodity producers through
access to better power and transport infrastructure, streamlined investment approvals, and possibly
more foreign investment in the sector.
INTERNATIONAL MONETARY FUND 11INDONESIA
Figure 6. Indonesia: Global Outlook
12 INTERNATIONAL MONETARY FUNDINDONESIA
MANAGING FISCAL RISKS IN INDONESIA1
A. Introduction and Main Observations1
1. This paper looks at current and prospective fiscal risks in Indonesia. It attempts to
highlight the risks that could materialize when exogenous shocks interact with fiscal vulnerabilities
to affect macroeconomic and financial stability. Focus is placed on those risks related to the general
government’s fiscal and debt positions (Section B), nonfinancial state-owned enterprises (SOEs)
(Section C), and health and pension spending (Section D).
2. Declining public debt in Indonesia since the late 1990s has strengthened the
economy’s resilience to exogenous shocks, but vulnerabilities have built up recently that may
heighten fiscal risks. They can be summarized as follows.
First, government funding needs have become increasingly reliant on foreign investors, with
a change in market sentiment possibly leading to a sharp slowdown or reversal in foreign
funding, squeeze on domestic bank liquidity, and rising borrowing costs.
Second, total and external indebtedness of key SOEs has risen. A sharper than anticipated
weakening in the exchange rate, in combination with other risks, could erode the equity
position and debt servicing capacity of those SOEs with incomplete hedges of their foreign
exchange exposure.
Third, despite recent energy subsidy reforms, a close connection remains between budget
performance and world oil prices, given the narrow revenue base and still significant reliance
on oil and gas revenues. A further drop in oil prices could add to downside pressures on
revenues and narrow space for key social and infrastructure spending, while also weighing
on the finances of Pertamina, the state oil company.
Finally, public spending on health and pensions is expected to increase over the medium
and long run, especially if coverage of social insurance is expanded.
3. To help mitigate these risks, prudent design and management of fiscal policy will
remain essential. Specifically, moderate fiscal consolidation would keep funding needs contained,
while non-oil and gas revenues mobilization is needed to safeguard fiscal space for social and
infrastructure spending. Improved operational efficiency of SOEs could strengthen their financial
performance and debt management. Finally, well-designed health insurance and pension systems
will be important to ensuring long-run fiscal sustainability. In addition, fiscal risks should be
communicated effectively with the public to reduce uncertainties for the private sector and improve
the economy’s resilience to shocks. In this connection, Indonesia’s current practice of submitting an
annual fiscal risk statement to Parliament along with the budget is commendable.
1
Prepared by Masahiro Nozaki.
INTERNATIONAL MONETARY FUND 13INDONESIA B. General Government Fiscal Position and Debt Sustainability 4. Indonesia has maintained favorable fiscal and debt positions compared with its peers. General government debt at 26 percent of GDP at end 2014 and current gross funding needs of around 4 percent of GDP a year are much lower than the median of other emerging market economies (EMEs) (Table 1 and Figure 1). Indonesia’s public debt has an average maturity of 10 years and an average interest rate that is well below GDP growth, which also compare favorably with the peers. Local governments’ debt is insignificant, since their borrowing is closely monitored and regulated by the central government. 14 INTERNATIONAL MONETARY FUND
INDONESIA

            Figure 1. Selected Emerging Market Economies: Public Debt Profile, 2014

Sources: IMF, Fiscal Monitor database; and IMF staff estimates.

1/ For Indonesia, data as of end 2013; for other countries, data are 2014:Q1 or latest available.

                                                                            INTERNATIONAL MONETARY FUND         15
INDONESIA
5. In addition to low public debt, contingent liabilities also appear manageable. Based on
available data, the size of contingent liabilities is not large enough to pose an immediate threat to
debt sustainability. Nonfinancial SOEs’ debt was moderately low at 5 percent of GDP at end 2013,
but nearly doubled as a share of GDP since end 2009 (see Section C). Debt guarantees to support
the financing of electricity and water infrastructure projects totaled only 1½ percent of GDP as of
March 2014. Public-private partnerships (PPPs) projects are another potential source of contingent
liabilities due to obligations such as state guarantees for minimum revenues, but Indonesia has
contracted only around 70 PPP projects since 1990, with the cumulative investment of US$35 billion
(equivalent to about 4 percent of 2014 GDP).2 In the event of a large one-time contingent liability
shock (equivalent to 10 percent of GDP), the ratio of public debt and gross funding needs to GDP
would initially rise, but public debt would unlikely be put on an upward trajectory, reflecting
Indonesia’s favorable public debt dynamics (Figure 2).
Figure 2. Indonesia: Contingent Liability Shock 1/
Sources: Data provided by the Indonesian authorities; and IMF staff estimates.
1/ The baseline envisages a small primary deficit over the medium term; see IMF, Indonesia: Staff Report for
the 2014 Article IV Consultation, Appendix III on “Indonesia: Debt Sustainability Analysis.” The contingent liability
shock scenario assumes a one-time contingent liability shock equivalent to 10 percent of GDP in 2015,
accompanied by a 300 basis points increase in the interest rate for the debt issued in 2015.
6. Nevertheless, vulnerabilities have built up in recent years due to increased dependence
on government funding from foreign investors. The share of public debt held by nonresident
investors (rupiah and foreign currency denominated) was around 59 percent of the total at
end 2013, among the highest in major EMEs (Figure 1, bottom panel), as Indonesia has benefitted
from the trend of increased risk appetite and global portfolio allocation to EMEs with the advent of
unconventional monetary policies and low interest rates in the advanced economies
2
Based on the World Bank’s database on private participation in infrastructure (see
http://ppi.worldbank.org/index.aspx).
16 INTERNATIONAL MONETARY FUNDINDONESIA
since 2009 (IMF, 2014).3 Nonresident investors raised their holdings in Indonesia in 2014, amid
global push factors and relatively attractive yields, purchasing around 70 percent of the net issuance
of government securities during the year (Figure 3, left panel), with their ownership of rupiah-
denominated government bonds reaching nearly 40 percent of the total stock outstanding at
end 2014 (Figure 3, right panel).
Figure 3. Indonesia: Government Debt and Foreign Investors, 2009–14
Sources: Data provided by the Indonesian authorities; Bloomberg L.P.; and IMF staff estimates.
7. A narrow revenue base with reliance on oil and gas revenues adds to fiscal
vulnerabilities. At around 17½ percent in 2014, Indonesia’s general government revenue-to-GDP
ratio is among the lowest in peer EMEs, with revenues from oil and gas production around
17 percent of the total (3 percent of GDP). While the government’s fiscal rule has successfully
maintained the general government deficit below the cap of 3 percent of GDP, the low revenue base
coupled with large energy subsidies have constrained public spending on infrastructure and social
programs in recent budgets. Energy subsidy reforms have opened space for larger spending in these
areas.4 However, a further drop in world oil prices from the IMF’s baseline outlook would subject the
general government budget to additional revenue losses, with less offset coming from subsidy costs
savings than in the past (Table 2), all pointing to the need to mobilize more non-oil and gas
revenues.
3
Debt held by nonresidents is currently above the early-warning threshold of 45 percent under the IMF’s debt
sustainability framework for EMEs (IMF, 2013).
4
See IMF, Indonesia—Staff Report for the 2014 Article IV Consultation, Box 5, “Indonesia: Fuel Subsidy Reform and the
Fiscal Impact of Low World Oil Prices.”
INTERNATIONAL MONETARY FUND 17INDONESIA C. Nonfinancial State-Owned Enterprises 8. Nonfinancial SOEs play an important role in the Indonesian economy, particularly in the energy sector. As of end 2013, Indonesia had 124 nonfinancial SOEs, with total assets of about 21 percent of GDP. Pertamina and PLN (Perusahaan Listrik Negara), the state electricity company, account for more than 60 percent of these assets (Figure 4). In upstream activity, Pertamina is currently the second largest oil producer in Indonesia, accounting for around 15 percent of average daily oil output in Indonesia in 2013, and the third largest gas producer, with a market share of 13 percent in 2013. On the downstream side, it has maintained a de facto monopoly in the distribution of key petroleum products such as gasoline and diesel. As for PLN, it accounts for more than 80 percent of national electricity generation and effectively monopolizes electricity distribution. For most of the final products of Pertamina and PLN (e.g., regular gasoline, diesel, LPG (3kg canisters), kerosene, and electricity), prices are administered by the government. While recent energy subsidy reforms effectively discontinued regular gasoline subsidies for all and electricity subsidies for medium and large users, 18 INTERNATIONAL MONETARY FUND
INDONESIA

the other products are still subsidized by the government. For such subsidized products, the
government budget compensates Pertamina and PLN with payments calculated based on agreed
formulas to reflect economic costs, including changes in the exchange rate.

9.       Total and external debt of nonfinancial SOEs has increased in recent years, while their
profits have compressed (Figure 5). Although still relatively low, total debt doubled as a share of
GDP between 2009 and 2013. About two-thirds of this increase originated from debt issued to
nonresidents, with external debt reaching 2.8 percent of GDP at end 2013 (54 percent of total).
Similarly, the share of foreign currency-denominated debt rose to about 70 percent in 2013. This
trend mirrored a similar development in the corporate sector in Indonesia, reflecting loose global
financial conditions and low borrowing costs abroad. Pertamina and PLN accounted for the majority
of the increase in the aggregated debt level of nonfinancial SOEs, using the proceeds from new
borrowing to finance investment in physical assets (e.g., oil pipelines, power plants). As a result, their
balance sheets have become much more leveraged in recent years. On the other hand, nonfinancial
SOEs’ profits have fallen the past few years, while facing higher interest payments. PLN recorded
losses of about 0.3 percent of GDP in 2013, mainly due to exchange rate depreciation.

10.      These developments make nonfinancial SOEs more susceptible to external shocks. For
SOEs that have relied on external debt financing, shifts in the global financial sentiment could raise
their borrowing costs and further weaken profitability. For those SOEs with incomplete hedges of
their foreign exchange exposure, exchange rate depreciation could erode their net worth, with PLN
appearing more vulnerable in this respect. In addition, low world oil prices would affect Pertamina’s
revenues from upstream production and its profit margins. To reduce these vulnerabilities and
better ensure profitability and debt sustainability, improvements in the operational efficiency of
SOEs and maintenance of sound debt management remain important. A strengthening in the
institutional capacity of the government and SOEs to plan, select, and execute high-quality
infrastructure projects is also crucial, in light of government’s strategy to recapitalize a number of
SOEs in 2015 to increase their borrowing capacity (including external) to support infrastructure
investment.5

D. Health and Pension Spending

11.      Public spending on health care and old-age pensions could become a significant
source of fiscal risks in future. Broadly speaking, this spending has three components:
(i) demographics, because pension spending increases with the number of retirees, while the elderly
spend more on health care; (ii) coverage of health care insurance and public pension schemes, and
(iii) adequacy of benefit levels per recipient. While strengthening public health insurance and

5
    See Indonesia—Staff Report for the 2014 Article IV Consultation, Box 4, “Indonesia: Closing the Infrastructure Gap.”

                                                                              INTERNATIONAL MONETARY FUND             19
INDONESIA
Figure 5. Indonesia: Financial Indicators of Nonfinancial SOEs, 2009–13
Sources: Data provided by the Indonesian authorities; Public Sector Debt Statistics of Indonesia; financial statements
of Pertamina and PLN; and IMF staff estimates.
20 INTERNATIONAL MONETARY FUNDINDONESIA
old-age pensions is seen as supporting stronger, more inclusive growth in developing economies, it
recognizably can add to fiscal pressures. Population ageing tends to exacerbate such pressures in
the long run.
12. In recent years, public health and pension spending in Indonesia has been among the
lowest of its peers (Figure 6). In 2012, central government outlays for health and pensions were
1.2 percent of GDP and 0.8 percent of GDP, respectively. Demographics does not fully explain this,
with Indonesia’s old-age dependency ratio—defined as the ratio of the elderly population (age 60
and older) to the working-age population (age 15–59)—was at 12 percent in 2010, only slightly
lower than the median for its peers (14 percent). Instead, low population coverage and possibly
inadequate benefit levels appear to contribute more. For health, public spending covered only
40 percent of total health spending in Indonesia in 2012 (the median of the comparators included in
Figure 6 is 50 percent). Also, because of supply bottlenecks, access to health care services is more
limited in rural areas, holding down average per capita health spending (World Bank, 2014). For
pensions, public spending consists mostly of civil service pensions (0.7 percent of GDP in 2012), with
the rest accounted for by the pension scheme for formal private sector workers (i.e., the PT
Jamsostek program). However, these two public pension schemes covered only around 12 percent
of the total labor force in 2012 (Muliati and Wiener, 2014).6
Figure 6. Selected Emerging Market Economies: Public Health and Pension Spending, 2010–12
Sources: PT Jamsostek, Annual Report 2013; United Nations, World Population Prospects, 2012 Revision; World Bank,
World Development Indicators; and IMF, Fiscal Monitor database, and staff estimates.
13. In this context, the authorities have embarked on an initiative towards universal social
insurance, including for health insurance and old-age pensions. The initiative began in 2004 with
enactment of the Law on the National Social Security System, followed in 2011 by a law establishing
a single social insurance administrator, or BPJS (Badan Penyelenggara Jaminan Sosial). Under this
6
In addition to the civil service pension scheme, civil servants also participate in a retirement benefit program called
the THT (Tabungan Hari Tua) program, which provides lump sum retirement benefit. The accrued liabilities of the THT
program are projected to reach around 2 percent of GDP by 2015 (World Bank, 2012).
INTERNATIONAL MONETARY FUND 21INDONESIA framework, the government began implementing a universal health insurance system (BPJS Health) in January 2014, consolidating several public health insurance schemes.7 The new scheme is financed through contribution payments and aims at covering the entire population by 2019, including informal sector workers. Currently, the central government fully subsidizes contribution payments of the poor and the near-poor (the lowest 35 percent of income distribution), with the annual subsidy cost budgeted at around 0.2 percent of GDP in 2014. Separately, BPJS will start offering employment-related social insurance in July 2015, including old-age pensions and death benefits (called BPJS Employment). The new scheme aims at covering formal sector workers and will be financed by their payroll contributions, with no budgetary support envisaged. The pension schemes for civil servants and private sector workers will eventually be integrated into this scheme. 14. Demographic prospects would contribute to a modest rise in public pension and health spending over the next few decades. Assuming coverage and benefit levels remain unchanged and taking account of an expected rise in Indonesia’s old-age dependency ratio to 35 percent in 2050 (Figure 7, left panel), public spending on health and pensions would increase by 0.2–0.3 percentage points of GDP by 2020, and only double as a share of GDP by 2050 (Figure 7, right panel). Figure 7. Indonesia: Demographic Prospects and Public Health and Pension Spending, 2010–50 Sources: PT Jamsostek, Annual Report 2013; United Nations, World Population Prospects, 2012 Revision; World Bank, World Development Indicators; and IMF, Fiscal Monitor database, and staff estimates. 1/ Baseline projections for pension and health spending take account of Indonesia’s demographic prospects based on United Nations, World Population Prospects, 2012 Revision. 7 The programs for civil servants (Askes), formal sector workers (Jamsostek), and the poor and near poor (Jamkesmas) have been consolidated into BPJS Health. Universal coverage still requires participation of non-poor informal workers. 22 INTERNATIONAL MONETARY FUND
INDONESIA

15.      Broadening the coverage of health insurance would require careful management over
the medium term. Following the experience of Thailand in implementing universal health coverage,
an alternative scenario might see the share of public spending in total health care spending rise
from 40 percent now to 60 percent by 2020. In the event, the ratio of public health spending to GDP
would reach 2.1 percent of GDP in 2020—0.7 percentage points of GDP above the baseline
(Figure 7, right panel).8 Eventually, public health spending would rise to 3.6 percent of GDP by 2050.
To avoid undue burden on the budget, BPJS Health will need to ensure its financial sustainability.
Contribution rates and patient copayments should be set at adequate levels, with budgetary offsets
to limit burden for low-income participants.

16.       The pension system should be designed prudently to avoid emergence of fiscal risks in
the long run. Compared to BPJS Health, broadening coverage of the BPJS Employment will be
challenging because informal sector workers account for 65 percent of the labor force (Muliati and
Wiener, 2014). Even if this occurs, pension spending would not begin to climb noticeably until new
entrants start to retire several decades later. Nevertheless, any expansion of the system should be
designed in a way that avoids emergence of actuarial imbalances in future, which might necessitate
budgetary support. Key parameters of pensions systems such as contribution rates, benefit levels,
and retirement age will need to be reviewed periodically, backed by actuarial studies. In view of
rising life expectancy, a gradual increase in retirement age could also be warranted.

8
  Thailand has achieved universal coverage by expanding its health care system. As a result, the share of public
spending in total health spending increased from 56 percent in 2000 to 76 percent in 2007 and has remained around
this level since then.

                                                                       INTERNATIONAL MONETARY FUND            23
INDONESIA
References
International Monetary Fund, 2013, “Staff Guidance Note for Public Debt Sustainability Analysis in
Market-Access Countries.” Available via the Internet:
https://www.imf.org/external/pubs/ft/dsa/mac.htm.
International Monetary Fund, 2014, Global Financial Stability Report; Chapter 1, “Moving from
Liquidity- to Growth-Driven Markets,” pp. 1–65 (Washington: International Monetary Fund,
April).
Muliati, Iene, and Mitchell Wiener, 2014, “Pension Reform Experience in Indonesia,” Chapter 17 in
Equitable and Sustainable Pensions: Challenges and Experience, eds. by Benedict Clements
and others (Washington: International Monetary Fund).
World Bank, 2012, “Reforming the Civil Service Pension and Tabungan Hari Tua (THT) Programs,”
World Bank Indonesia Policy Brief, Issue 1, April 2012. Available via the Internet:
http://documents.worldbank.org/curated/en/2012/04/17683592/reforming-civil-service-
pension-tunjangan-hari-tua-tht-programs-reformasi-program-pensiun-dan-tabungan-hari-
tua-tht-pegawai-negeri-sipil.
World Bank, 2014, Indonesia Development Policy Review: Avoiding the Trap. Available via the
Internet: http://www.worldbank.org/en/news/feature/2014/06/23/indonesia-2014-
development-policy-review.
24 INTERNATIONAL MONETARY FUNDINDONESIA
RECENT DEVELOPMENTS IN BANKING SYSTEM
LIQUIDITY1
A. Introduction1
1. This paper discusses recent developments in banking system liquidity in Indonesia. At
the outset, it highlights several structural characteristics that have helped shape liquidity
developments in recent years, notably the microstructure underlying the distribution of liquidity and
limitations in the money markets. Taking these into account, it then attempts to answer several
questions. First, what has driven the decline in available liquidity since late 2011, in particular, why
did deposit growth fall sharply over the past three years? Second, how have banks been affected by
the decline—specifically, why has it been more acute at smaller banks? Third, what has been the
effect of policy changes, particularly since mid 2013, on banking system liquidity; i.e., have they
exacerbated structural liquidity problems or been effective in helping banks manage liquidity needs
in a period of adjustment to tighter funding conditions? Fourth, what are the near-term prospects
for banking system liquidity, in particular with a possible tightening in global financial conditions?
Finally, the paper offers views on the implications of these factors on the monetary policy
transmission mechanism in the current environment.
B. Characteristics of Banking System Liquidity in Indonesia
2. Several aspects of agents’ behavior characterize the liquidity situation in the
Indonesian banking system, which has led to
a structural liquidity problem. This problem
can be best described as the concentration of
excess liquidity in larger banks, which exists
beyond normal liquid asset requirements and
has not been absorbed through instruments
used by Bank Indonesia (BI) to conduct open
market operations (Figure 1). It can be traced
back to BI’s liquidity support operations during
the late 1990s, which resulted in a major
expansion in the monetary base.2 Large portfolio
inflows in 2010‒11 also contributed substantially
1
Prepared by Seng Guan Toh.
2
Following the onset of the Asian Financial Crisis, banks representing more than half of total assets of the system
experienced deposit runs to varying degrees. In response, BI injected a large amount of liquidity into the banking
system and in return received nontradable government bonds carrying little interest. Since then, BI has relied on use
of its own securities (SBIs) to mop up the resulting excess liquidity (IMF, 2010).
INTERNATIONAL MONETARY FUND 25INDONESIA
to this liquidity, as a result of partial sterilization of the inflows.3 The structural liquidity problem is
symptomatic of the undeveloped money markets in Indonesia, which are thin, segmented, and
generally inaccessible to the smaller banks. As a result, monetary policy transmission is hampered
and development of a functional term structure of interest rates is constrained.
3. The main characteristics of banking system liquidity in Indonesia are as follows:
Banks’ funding structure is generally very short term, with dependence on large deposits, and
highly skewed in favor of large banks. Reflecting depositor preferences, more than 90 percent
of maturities are of one month or less or
at call, although they are typically rolled
over. Current and savings accounts (CASA
deposits) represent over half of the total
funding base and term deposits4 the rest.
Large corporate-related deposits tend to
be a dominant source of funding5 and
come from the banks’ premium
customers. The top four largest banks
(i.e., Buku 4 banks, or those with core
capital above Rp 30 trillion) have access to
almost three-fifths of low-cost and stable
CASA deposits of the system, reflecting their larger branch and ATM network and name
recognition, while mid-sized and small banks rely predominantly on higher-cost term
deposits for funding (Figure 2).
Demand for precautionary liquidity buffers is high, reflecting banks’ self-insurance for liquidity
management. Given the history and funding structure of the Indonesian banking system,
deposit flight remains an element taken into account in banks’ behavior.6 Banks have tended
to place sizable excess liquidity with BI in a range of short-term facilities. To manage
available liquidity, some have also tended to keep their credit extension in check relative to
3
The challenge to monetary authorities of sterilizing liquidity from surging inflows to the region was not confined to
Indonesia. For example, during 2010‒11, the Philippines’s central bank nearly exhausted its holdings of government
securities for use as collateral in reverse repo transactions. Given constraints on issuance of its own securities, Bangko
Sentral ng Pilipinas had to rely increasingly on other instruments such as nontradable special deposit accounts.
Furthermore, the emergence of excess reserves in the money market in the Philippines contributed to market interest
rates falling below the policy rate, affecting monetary policy transmission (Affandi and Peiris, 2012).
4
At end 2013, almost half of term deposits had a maturity of one month or less.
5
The heavy concentration of the deposit base was such that the Deposit Insurance Corporation (LPS) noted that at
end 2013, a mere 0.3 percent of depositors owned 61 percent of deposits by value. This is also why the LPS did not
guarantee approximately 55 percent of the nominal values of total deposits (despite having an ample ceiling
equivalent to almost US$200,000 per bank depositor).
6
This also helps explain why the maximum deposit guarantee rates set by LPS have some influence on banks’ atthe-
counter deposit rates.
26 INTERNATIONAL MONETARY FUNDINDONESIA
their deposit-taking activities,7 with low loan-to-deposit (LDR) ratios at some banks
precipitating BI to introduce a floor on them in 2010 to spur credit growth. The shallowness
of the money market, perceptions of supervisory stigma in accessing BI’s standing facility for
lending, uncertainties surrounding the availability of a fully functioning lender of last resort,
lack of averaging in reserve requirements, and capacity limitations of the deposit insurance
scheme also contribute to the preference by banks to hold excess liquidity.
The money market lacks depth, reinforcing the concentration of bank liquidity and diminishing
its influence on broader liquidity conditions. Incentives to trade in the interbank money
market are weak, given banks’ desire to hold precautionary liquidity, while access by smaller
banks is limited due to concerns about counterparty risks. Given the small interbank volumes
relative to system-wide activity, money market rates do not give an accurate picture of
funding conditions and have a limited impact on banks’ deposit rate setting.
C. Recent Trends in Bank Liquidity Conditions
4. Banking system liquidity in Indonesia has generally been on a declining trend since
late 2011, driven primarily by a slowdown in deposit growth. This trend is reflected in a slowing
of growth in both term and CASA deposits, which peaked by early 2012 and declined noticeably
thereafter (Figures 3 and 4).The deposit growth slowdown can be attributable to several factors:
(i) constrained corporate cash generation following the downturn in the commodity cycle
since 2012; (ii) more volatile capital flows since mid 2012, lowering the net foreign assets (NFA)
contribution to M2; and (iii) the drawdown of deposits given the opportunity cost imposed by low
bank deposit rates prior to mid 2013.
5. At the same time, bank credit growth picked up as the effects of the global financial
crisis (GFC) waned, peaking in May 2012 at around 26 percent (y/y). Consequently, the average LDR
of banks rose sharply from 72 percent at the beginning of 2010 to more than 92 percent by
July 2014. The trend of higher LDRs from slowing deposit growth relative to credit growth was not
7
Small banks’ LDRs are typically capped by funding constraints.
INTERNATIONAL MONETARY FUND 27INDONESIA
unique to Indonesia; this was also seen in Malaysia,
Singapore and Thailand (Figure 5), driven in part by
a combination of credit-supportive policies
adopted after the GFC and shifts from bank
deposits into alternative financial products amidst
relatively low levels of local interest rates.
6. Prior to mid 2013, however, large banks
in Indonesia still viewed liquidity buffers as
comfortable. At the time, they continued to hold a
large amount of structural liquidity, predominantly
in the form of short-dated nontradable term
deposits with BI. Banks’ reliance on them for
liquidity management was reinforced over time by
BI’s gradual reduction starting in mid 2010 of its
issuance of SBIs for liquidity absorption (Figure 6),
due to the tendency for these instruments to
attract volatile capital flows, which complicated
monetary management. In contrast, due to the
constraints in their funding structure, smaller banks
were more sensitive to liquidity pressures, with
many offering term deposit rates above the deposit
insurance corporation (LPS) guaranteed ceiling
rates.
7. From mid 2013 to mid 2014, a reassessment of liquidity conditions among large banks
occurred. This change was prompted by the shock from the May 2013 Fed tapering talk combined
with several related developments, which tightened bank funding conditions, triggering a period of
adjustment.
Liquidity conditions tightened further as
deposit growth continued to slow noticeably
relative to credit growth, pushing up LDRs
further (Figure 7). Initially this was due to
foreign portfolio outflows, mainly
in 2013:Q3, but as these subsequently
normalized, deposit growth remained
subdued into 2014:H1 by the broader
28 INTERNATIONAL MONETARY FUNDINDONESIA
slowdown in economic activity. Liquidity conditions in 2014 were also affected by substantial
frontloading of government financing needs8 and large private external amortization
payments. Bank Indonesia signaled its guidance for banks to adjust liquidity positions by
increasing from September 2013 the secondary reserves requirement (on liquid assets) and
lowering the upper LDR limit on which banks would incur additional reserve requirements.9
Attempts to slow private credit growth could
not initially keep pace with declining deposit
growth, particularly for large banks. Large
banks mainly retrenched new loan
approvals, particularly for working capital;
outstanding loans could not be adjusted
down as quickly, as customers drew on
previously unutilized credit lines. Faced with
more severe funding constraints, smaller
banks cut credit lines forcefully and
mobilized funding from equity owners.
Several of them also borrowed from the
interbank repo market, which was temporarily boosted by a new Mini Master Repo
Agreement rolled out at end 2013. As a result, even though the LDRs of smaller banks (Buku
1 and 2) had begun to decline, the LDR of larger banks (Buku 3 and 4) generally rose further
in 2014:H1 (Figure 8), indicative of the tighter funding pressures they faced.
These developments, coupled with a
reassessment of depleted liquidity buffers,
prompted a surge in large banks’
competition for term deposits. The onset of
acute funding pressures in this period was
reflected in a steep decline in net available
funding (customer deposits subtracted by
credit, adjusted for statutory reserve
holdings), which led to a marked rise in
deposit rates due to aggressive competition
for term deposits (Figure 9).
8
In light of market uncertainties, the government frontloaded its issuance of rupiah securities in 2014:H1. As a result,
it accumulated surplus financing estimated in excess of 0.6 percent of GDP in 2014:H1 compared to the same period
in the previous year, which resulted in a large buildup in government deposits placed in BI.
9
Bank Indonesia raised the secondary reserve requirement (RR) in September 2013 (fulfilled by banks’ holding of
treasury and BI securities) from 2.5 percent to 4.0 percent, to be phased in by December 2013, and also tightened the
LDR-linked RR by applying it to banks with an LDR in excess of 92 percent (previously 100 percent) and with a capital
adequacy ratio under 14 percent.
INTERNATIONAL MONETARY FUND 29INDONESIA
These system-wide average rates likely understate the extent of the “deposit war” among
banks, as banks were widely reported to offer special rates to their premium customers that
were higher than at-the-counter rates. Lending rates were also adjusted upward, but less
rapidly and only with a lag, as banks’ wide net interest margins (NIMs) provided a cushion to
absorb increases in deposit rates for a time, as banks were reluctant to lose market share
with their premium customers.
D. Role of Policy Actions
8. Actions by BI have been aimed at smoothing adjustment in rupiah liquidity conditions.
When the tapering talk pressures hit, BI rapidly unwound the term deposit facilities with banks to
offset the sharp liquidity contraction that would have resulted due to its large FX sales interventions,
particularly in the June-July 2013 period. As a result, the amount outstanding in such facilities was
brought down to virtually zero by September 2013. Purchases of rupiah government bonds in line
with BI’s dual intervention (FX and bonds) strategy also provided a secondary source of liquidity
injections. The combination of these injections more
than offset the contractionary influences, resulting in
a buildup of cash parked by banks in BI’s overnight
deposit facility (FASBI), which more than doubled
between May and August 2013, and which has since
remained large. This buildup also kept overnight
interbank rates close to the FASBI rate,
notwithstanding increases in the BI benchmark rate
(Figure 10). Meanwhile, the use of swaps by BI,
including via FX swap auctions, provided rupiah
liquidity to segments of banks experiencing acute
mismatches between FX and rupiah funding.
9. Policy actions outside of BI, however, have tended to exacerbate the tightness in bank
liquidity conditions up to mid 2014. First, the government’s sizable issuance of rupiah securities
added to liquidity demands on larger banks. These banks, as primary dealers, have had to commit
liquidity to securities auctions at an elevated level since mid 2013, as a consequence of the
government’s catchup issuance in 2013:H2 and frontloading strategy in 2014:H1. Second, slower-
than-usual execution of the government capital budget in 2014:H1 added to liquidity pressures,
particularly at smaller regional banks, which tend to be more reliant on this type of funding. Third,
deposit rates, particularly those at the counter, rose further following an increase in deposit
insurance (LPS) guaranteed rates in May 2014, which occurred at a time of peak seasonal cash
demand pressures before Ramadan.
30 INTERNATIONAL MONETARY FUNDINDONESIA
10. Recent supervisory action to introduce deposit rate caps could create additional
distortions. The measure, undertaken by the Financial Services Agency (OJK), aimed to alleviate
competition among large banks for term deposits and bring down lending rates. Effective
October 1, 2014, deposit rates offered on all bank deposits up to Rp 2 billion were capped at no
more than the maximum LPS-guaranteed rate (at 7.75 percent). Deposit rates for large deposits
(above Rp 2 billion) were capped at (i) 200 bps above the current BI rate for the largest banks
(i.e., Buku 4 banks) and (ii) 225 bps above the current BI rate for medium to large banks (i.e., Buku
3 banks, with core capital between Rp 5 trillion and Rp 30 trillion). While the full effects of these
measures have yet to be seen,10 it could potentially send confusing signals about BI’s monetary
policy stance and encroach on BI’s monetary policy operations, further distorting policy transmission
by introducing an interest rate control with a fixed spread around the BI rate. The caps also limit the
ability of individual banks in the system to adjust to shocks on liquidity via interest rate flexibility on
deposits, which could not only affect their ability to mobilize large deposits, but even small ones
(i.e. less than Rp 2 billion) given the lower level of rate caps being applied to these. Under these
conditions, banks may resort to keeping more liquidity for self-insurance purposes.
E. Near-Term Prospects and Risks
11. Even though bank liquidity conditions remain relatively tight, there has been some
easing since the second half of 2014 on a combination of adjustments and seasonal factors.
First, credit growth has decelerated below deposit growth in 2014:H2. Second, portfolio inflows have
been sizable since late 2013, helping replenish deposits, as reflected in increases in the NFA
component of M2 (Figure 7) and the level of BI’s gross international reserves. Third, government
budget execution improved in 2014:H2, while seasonal deposit outflows also eased, following the
surge in profit repatriation abroad, external amortization payments, and imports in 2014:Q2. Large
banks have lowered their special deposit rates to premium customers. However, system-wide LDR
remained relatively elevated, registering at around 88 percent as of November 2014.
12. The banking system remains vulnerable to deterioration in external financing
conditions, or at the extreme, a sudden reversal of portfolio flows. This could occur in the event
of unexpected sharp tightening in global financial conditions in 2015. Buoyant conditions in 2014
had facilitated record sovereign bond issuance and portfolio inflows into rupiah government bonds,
10
A similar measure to cap deposit rates was attempted by BI in 2009 through suasion, with mixed results, notably
with lending rates remaining relatively high while tending to bolster banks’ net interest margins.
INTERNATIONAL MONETARY FUND 31INDONESIA with foreign bidders taking up about a third of new rupiah treasury issuances. Vulnerability to a reversal is now heightened as large foreign holdings have risen further to record highs (Figure 11).11 Domestically, the gross fiscal financing requirement in 2015 is expected to remain large relative to 2014. If the government were to face challenges borrowing abroad, it would have to rely more on the domestic market, potentially putting a further squeeze on domestic liquidity and driving up private borrowing costs. F. Implications for the Monetary Transmission Mechanism in the Current Environment 13. Monetary policy operations tended to have a more limited impact on the banking system’s marginal cost of funds, which appears driven more by rates on premium deposits. As noted, the rates paid by banks on these deposits tend to be less reflective of money market conditions, due to banks’ heightened attention to their LDR. However, changes in the BI policy rate and LPS guarantee rate affect banks’ average cost of funds, as at-the-counter deposit rates are benchmarked off these two policy rates (even before the recent OJK action to cap deposit rates). 14. Lending rates appear relatively insensitive to the increase in the marginal cost of funds, and tend to be based more on the average cost of funds of the largest banks, which set the market reference for lending rates and are the dominant credit providers in the system. Lending rate adjustments have been sluggish, as these banks preferred to compress their large NIMs as system-wide deposit rates increased, rather than raise lending rates sharply and unnecessarily risk the loss of their premium customers or a rise in nonperforming loans. 15. The main impact from an interest margin squeeze tends to occur through loan portfolios of the small and medium sized banks, reflected in either aggressively cutting credit lines to noncore customers or attempting to shift the loan book towards high-yielding credits to preserve their NIMs. 11 Notably, the foreign share of rupiah government bond holdings rose from about 30 percent in October 2013 to 40 percent by January 2015. However, for Indonesia, the predominant share of institutional investor holdings (relative to retail investors) historically provides a partial stabilizing factor during outflow episodes due to global volatility. 32 INTERNATIONAL MONETARY FUND
You can also read