Industry Insight Residential Building - September 2017 - Westpac
←
→
Page content transcription
If your browser does not render page correctly, please read the page content below
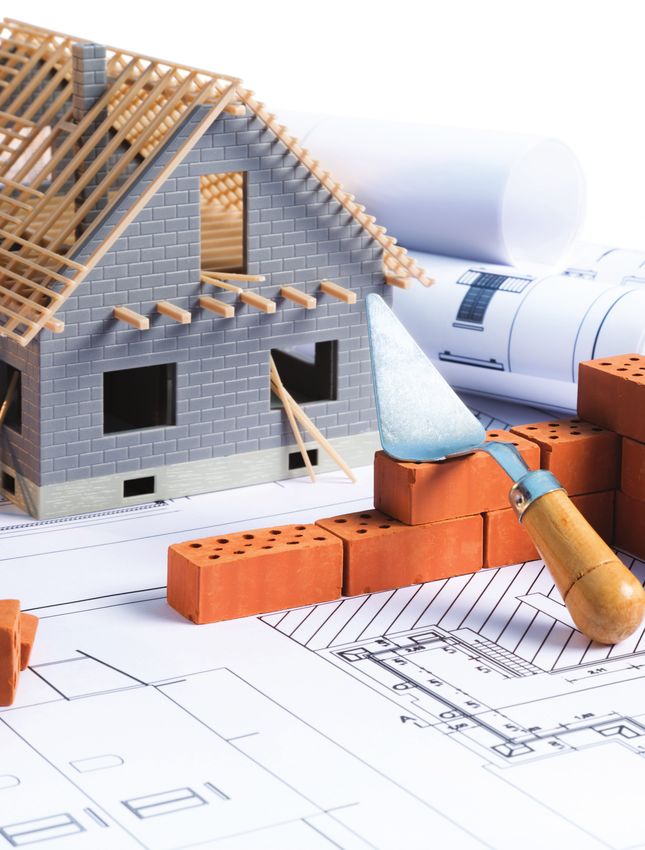
September 2017

Industry
Insight
Residential Building
                 INDUSTRY INSIGHT - RESIDENTIAL BUILDING   | 13 September 2017 | 1
Contents
                                  Summary                                                      01
                                  Outlook                                                      02
                                  Introducing the industry                                     03
                                  Defining the Industry                                         03
                                  Number of Firms                                               03
                                  Number of people employed                                    04
                                  Shape of the industry                                        04
                                  Contribution to the economy                                   05
                                  Residential investment demand                                06

                                  Mapping the value chain                                     08
                                  Inputs                                                       08
                                  Outputs                                                      08
                                  Conversion                                                   08

                                  Regulatory environment                                        11
                                  Competitive dynamics                                         13
                                  Demand side drivers                                           13
                                  Supply side drivers                                           16

                                  Industry issues                                              18
                                  Characteristics of
                                  successful firms                                            20

INDUSTRY INSIGHT
Residential Building

Compiled by:
Paul Clark
Industry Economist
Auckland, New Zealand
Email: paul.clark@westpac.co.nz

                                  INDUSTRY INSIGHT - RESIDENTIAL BUILDING   | 13 September 2017 | 2
Summary
This report focuses on the residential building industry, which is concerned with project managing the
construction of dwellings, from standalone houses to high-density apartment blocks. After summarising
the key characteristics of the industry, the report discusses a range of issues from the legislative and
regulatory environment within which it operates to the volatility of demand and obstacles to innovation
and productivity growth.

The industry is characterised by a preponderance of very         of flexibility because the barriers to entry and exit they
small firms and a few very large firms. The small firms          face are considerably higher and because they often have
typically employ fewer than five people and operate at a         diversified interests in associated industries.
localised level. They typically build one home at a time and
                                                                 However, while relative ease of entry might make the industry
are heavily involved in alterations and remedial type work. By
                                                                 more responsive to changes in demand, it also makes it more
contrast, large firms focus on large-scale housing projects,
                                                                 vulnerable to exaggerated boom and bust cycles.
building up to a thousand houses per year. They tend to have
a regional focus, although some have national coverage.          In boom times when demand is increasing, small firms
                                                                 enter the industry looking for opportunities. Competition
All of these firms operate in an environment of extremely        is low, revenues and profitability are good and order books
variable demand and as a result, residential building activity   are healthy. Increasingly, the capacity to deliver becomes
is far more volatile than the economy in general. A number       the key constraint facing firms. This is true for the industry
of factors shape demand for residential building activity.       as well as the upstream supply of labour, materials and
Some are structural in nature. They are largely predictable      construction services. However, as long as it is profitable to
and affect demand over a long period of time. Key                do so, firms will continue to enter the industry.
factors include changes to the size and composition of           In the bust times when demand is falling, the opposite
New Zealand’s population, as well as the number and type         applies. The amount of work available falls, pricing
of households that exist. These factors change not only the      becomes increasingly competitive (sometimes at cost or
level of demand for homes, but also the composition of           even below to win business), and profitability drops. Small
that demand with a shift towards smaller, medium to high-        firms try to hold on, but as margins tighten they start to
density housing, as well as more bespoke designs.                exit the industry in ever-larger numbers, with negative
Other demand factors are more cyclical in nature. They           implications for employment.
tend to be volatile factors that affect demand for housing       This vulnerability to boom and bust cycles has a number
in the short-term. These range from fluctuating migration        of adverse consequences for the industry. It encourages
patterns (which affect near term changes in population           a short-term focus on operational issues, which makes
size), interest rate movements, changing debt-servicing          it hard to invest time and money in developing, learning
requirements, and lending rules.                                 and/or adopting new approaches. This is particularly
Then there are disruptive factors. These have significant        true for small firms that live a “hand to mouth” existence.
impacts on demand, which can stretch over a long period of       A lack of investment discourages innovation and limits
                                                                 the productivity gains needed to improve industry
time. The most obvious example is the significant re-build
                                                                 competitiveness and reduce building costs. It also ensures
that followed the 2011 earthquake in Canterbury.
                                                                 that this inherent vulnerability to boom and bust cycles
The industry is able to react relatively quickly to cyclical     is self-perpetuating.
and disruptive factors because of the ease with which small
firms, in particular, are able to enter and exit the industry.   Paul Clark
By contrast, larger firms do not exhibit the same degree         Industry Economist

                                                                 INDUSTRY INSIGHT - RESIDENTIAL BUILDING   | 13 September 2017 | 1
Outlook

Long-term, there is always going to be a need for new                industry stands, large firms will increasingly turn their focus
homes in New Zealand. A growing population, more                     towards medium and high-density residential buildings to
households and persistent housing shortages, particularly            meet changes in demand. A particular area of growth will
in Auckland, will underpin this need.                                be terraced housing and low- level apartment blocks, which
                                                                     currently attract high profit margins (although these should
However, from year to year, demand will be cyclical, shaped
by factors such as changing interest rates, household debt           narrow as competition heats up).
burdens, net migration flows, etc. This cyclicality as well          Growth is also likely to receive a boost should the
as the fragmented nature of the industry will ensure that            government introduce new urban planning legislation.
volatility will continue to be a defining feature of the industry.   Separate objectives for regulating urban and natural
Small firms will continue to enter and exit the industry as          environments should help free up land for building
the cycle changes. Large, well-capitalised firms that have           purposes and speed up the development of housing.
diversified operations are likely to be able to withstand the        Other regulatory changes are likely be less popular and
cyclical nature of the industry and so will tend to remain.          impose costs on the industry. For example, possible
Whether they are able to remain will depend on how                   changes to the building code following the Kaikoura
competitive they are. In part, this will depend on their ability     earthquake in November 2016 are likely to mean a
to reduce unit construction costs. Large firms seeking               tightening of standards, which will increase building costs
to minimise these costs will innovate by investing in new            and put pressure on margins. This is particularly relevant
work organisation methods and developing new products,               for small firms that compete largely on price.
including off-site prefabrication (which dramatically cuts           Given how we see the competitive dynamics in the industry
the time for building homes) and greater use of 3-D printing.        playing out into the future, we think that over time, the industry
This in turn should support productivity gains. However, the         will morph into something more like that of Australia’s,
overall productivity of the industry will be hampered by a
                                                                     where larger residential construction firms predominate.
continued lack of innovation by smaller firms.
                                                                     Large firms will increasingly dominate across all market
The ability to compete will also depend on which market              segments, except for alterations, repairs and maintenance
segments large firms operate in. Although standalone                 work, where a declining number of smaller players will
houses will continue to be the bedrock on which the                  operate. This may reduce levels of volatility over time.

                                                                     INDUSTRY INSIGHT - RESIDENTIAL BUILDING    | 13 September 2017 | 2
Introducing the industry

Defining the industry                                           Figure 1 shows that at the end of 2016 there were 18,501
                                                                firms operating in the residential building industry.
The building and construction sector provides the
infrastructure that we rely on for housing, education,          Since 2000, the number of firms operating in the industry
transport, health and social services. It constructs new        has grown by 58%, which equates to an average of 3% per
buildings and structures as well as undertakes additions,       year over the period.
alterations and repairs to those that already exist.
                                                                However, growth in firms has not always been positive, with
The Australian and New Zealand Standard Industrial              declines for each of four years following the post global
Classification (ANZSIC) system provides a convenient            financial crisis period.
way of classifying these activities, differentiating between
residential, non-residential and heavy and civil engineering    Figure 1: Firms operating in the industry
construction activity and the services that support them.
                                                                     APC                                                                             Number '000
                                                                12                                                                                                 19
This report focuses only on the activities undertaken by the                                                                   Growth in Firms (LHS)
                                                                10                                                                                                 18
residential building industry, specifically the:                                                                               Number of Firms (RHS)
                                                                 8                                                                                                 17
–– Construction of the following residential structures          6
                                                                                                                                                                   16
   (as defined by Stats NZ):                                     4
                                                                                                                                                                   15
                                                                 2
   –– Detached dwellings - a standalone dwelling unit                                                                                                              14
                                                                 0
      that is not attached to any other dwelling unit; i.e. a                                                                                                      13
                                                                -2
      typical house on its own section;                                                                                                                            12
                                                                -4
   –– Townhouses – side by side units; such as terraced         -6                                                                                                 11

      housing, townhouses, flats and units;                     -8
                                                                     Source: Westpac, Stats NZ
                                                                                                                                                                   10
                                                                  2000        2002         2004           2006      2008       2010     2012       2014     2016
   –– Apartments – any dwelling with another dwelling
      above or below it or attached to a commercial
      building; and
   –– Retirement units – dwellings specified for retirement
      purposes, from detached dwellings to apartments           Growth in the number of firms in
      and rooms in retirement villages.                         the residential building industry
–– Alterations, additions and/or renovations to                 is similar to other industries
   these structures;
                                                                operating within the building
–– Project management and organisation of these various
   activities; and                                              and construction sector.
–– On-site assembly and installation of
   prefabricated structures.
This report does not focus on the construction services         Collectively, these firms operate at 18,537 sites throughout
industry which undertakes land development and                  New Zealand.
site preparation, as well as the contracting (and sub-
contracting) of structural (such as concreting, bricklaying,    Figure 2: Location of operating units
roofing, structural steel), installation (such as plumbing
and electricity) and completion works (such as plastering,
carpentry, decorating).                                                                     1,065
                                                                                  1,119
                                                                                                                                          Auckland
It also does not focus on activities undertaken by the                   1,179                                                            Canterbury
non-residential and civil construction industries, such as                                                             6,627              Rest of the North Island
                                                                                                                                          Wellington
the construction of and/or alterations to hotels, hospitals,         1,653
                                                                                                 18,537                                   Waikato
prisons, factories, roads, dams and the like.                                                                                             Bay of Plenty
                                                                                                                                          Otago
                                                                      1,794
                                                                                                                                          Rest of the South Island
Number of Firms                                                                                                                         Source: Westpac

The residential building industry consists of a large number                        2,253                   2,847

of firms that operate mostly from a single physical location.

                                                                INDUSTRY INSIGHT - RESIDENTIAL BUILDING                               | 13 September 2017 | 3
Figure 2 shows that just under 36% of these sites are                                          declines recorded for each of the three years following the
within the Auckland region, about 15% in Canterbury,                                           global financial crisis.
12% in Wellington with large concentrations also evident
                                                                                               Figure 4 shows that firms in the residential building industry
in the Waikato, Bay of Plenty and Otago regions. Most of
                                                                                               employed an average 2.3 people in 2016, which is just over
these sites are located in areas that have large growing
populations. Earthquake recovery works have also led to                                        half the average size of all firms operating in New Zealand.
more firms operating in Canterbury.                                                            However, this figure is likely to be understated - it is
                                                                                               common practice within the industry for firms to contract
                                                                                               skills for extended periods rather than directly employing
Number of people employed
                                                                                               staff and putting them on the payroll.
The residential building industry employs a large number
of relatively unskilled and semi-skilled people and
relies heavily on upstream contractors to provide trade
related expertise. About 20% of people working in the                                          People that service these very
industry have no qualifications, while a further 30% of                                        small firms are self-employed
workers have only a school qualification. The industry also
directly employs a large number of technical people such as                                    plumbers, electricians, carpet
architects and designers.                                                                      layers. It is not unusual for a
Figure 3 shows that by the end of 2016, about 42,000                                           plumber to service 5 or 6 of these
workers (including the self-employed which account
for 45% of all workers) were employed in the residential
                                                                                               small firms at the same time,
building industry, accounting for some 20% of the 206,000                                      rather than just work exclusively
workers that work in the building and construction sector.                                     for one.
Adjusted for hours worked, this translates into about
40,000 full time equivalents (FTEs).

Figure 3: Employees working in the industry
                                                                                               Shape of the industry
      APC                                                                  Number '000
 25                                Growth in Employees (LHS)                             45    The proportion of very small firms operating in the
 20                                Number of Employees (RHS)                             40    residential building industry in New Zealand is far larger
 15
                                                                                         35    than for its Australian counterpart.
                                                                                         30
 10
                                                                                         25
  5                                                                                            Figure 5: Firms by number of employees
                                                                                         20
  0
                                                                                         15                   184
                                                                                                                         17
 -5
                                                                                         10
-10                                                                                      5
                                                                                                              920
       Source: Westpac, Stats NZ
-15                                                                                      0            1,470
   2000        2002         2004        2006     2008     2010     2012   2014    2016                                                         1 - 5 Employees

                                                                                                                                               5 - 9 Employees

                                                                                                                                               10 - 19 Employees
Figure 4: Average number of employees per firm                                                                  18,501
                                                                                                                                               20 - 49 Employees

      APC                                                                  Number '000
                                                                                                                                               >50 Employees
10                                  Growth in Employees Per Firm (LHS)                   2.4
                                                                                                                                             Source: Westpac, Stats NZ
  8                                 Number of Employees Per Firm (RHS)                   2.3
  6                                                                                      2.2                                  15,911
  4
                                                                                         2.1
  2
                                                                                         2.0
  0
                                                                                         1.9
 -2
                                                                                         1.8
 -4
                                                                                         1.7
                                                                                               The 18,501 firms that make up the residential building
 -6

 -8                                                                                      1.6
                                                                                               industry come in all different shapes and sizes.
-10 Source: Westpac, Stats NZ
   2000     2002          2004          2006     2008     2010     2012   2014   2016
                                                                                         1.5
                                                                                               About 86% have five or fewer employees, while a further
                                                                                               8% have between six and nine people working for them.
                                                                                               They tend to operate in localised markets, building
Since 2000, the number of people employed by the                                               standalone houses, one at a time, up to two to three a year.
industry has grown by 109%, which equates to an average                                        About 35% of the work undertaken by these firms is on new
of 5% per year over the period. Not surprisingly, growth in                                    housing, 33% on housing alterations and an additional 15%
number of employees shows a similar pattern to firms, with                                     on housing repairs and maintenance.

                                                                                               INDUSTRY INSIGHT - RESIDENTIAL BUILDING   | 13 September 2017 | 4
Figure 6: Firms by type of residential building
The ratio of self-employed 100%
% of total % of total
100%
operators expressed as a share 90%
80%
18%
36%
90%
80%
of all builders in New Zealand 70%
Owner Builders
70%
is about 20% larger than 60% Building >=2 60%
50%
50% Building >100 50%
in Australia.
homes
40% 40%
54%
30% 30%
20% 20%
32%
10% 10%
10%
0% 0%
Another 5% of these firms have between 10 and 19 New Zealand Australia
employees. They operate much like their smaller Source: Westpac, Fletcher Building
counterparts, but are able to complete more houses in a
given year and undertake projects simultaneously. Their As noted the degree of fragmentation evident in
focus tends to be on new houses, but still undertake New Zealand is higher than that in Australia. Figure 7
alterations, repairs, and maintenance work. compares the number of firms building a single house, more
than one house and more than 100 houses. Although there
about 200,000 companies operating in Australia only 10%
The ratio of firms having less build only one house compared to 32% in New Zealand. At
the other end of the spectrum, only a handful of firms in
than 19 employees expressed New Zealand build more than 100 houses a year, compared
as a share of all builders in to over a third of companies in Australia.
New Zealand is about 30%
Figure 7: Firms by number of residential building
smaller than in Australia.
% of total % of total
100% 100%
90% 18% 90%
80% 36% 80%
Building = 1
An additional 1% of these firms have between 20 to 49 70% 70%
Building >=2
employees, focusing on specific regional markets. As shown 60%
50%
60%
Building >100
in Figure 6, they are involved in a broader range of activities, 50%
homes
50%
40% 40%
from property development to building standalone houses, 54%
30% 30%
terraced housing (detached houses), medium density
20% 20%
apartment blocks and associated commercial projects. 10%
32%
10%
10%
The remaining firms, who employ more than 50 0%
New Zealand Australia
0%
people, cover the same activities as their medium sized Source: Westpac, Fletcher Building
counterparts (also shown in Figure 6), but do so on a
much larger scale, often providing end-to-end solutions
(land development, architectural design, building and real Contribution to the economy
estate services) for a range of customers. Most of these
group builders will build at least 100 houses per year, with The residential building industry is a big contributor
some building close to 1000. Most have a national footprint to New Zealand’s economy, but exhibits a high degree
with a number adopting a franchisee operating structure. of volatility.
These would include standalone home builders such as The residential building industry contributed about
GJ Gardner Homes, Stonewood Homes, Signature Homes $3.6bn to the New Zealand economy 2016 - more than
and Jennian Homes. Others, such as Mike Greer Homes, the combined value generated by the non-residential
Fletcher Building and Dominion Residential are independent and heavy and civil engineering construction industries,
builders with operations in several strategic localities. but significantly less than the contribution made by the
Fletcher Building, for example, focuses on medium to construction services industry, which it depends on for a
high-density residential buildings such as apartments,
range of contracting and sub-contracting services.
townhouses and terraced housing in Christchurch and
Auckland. Unlike others in this sector, Fletcher Building is Of this total, house building is by far the largest activity
backwardly integrated, producing its own building material contributing $3.2bn. Alterations, repairs and maintenance
and products for downstream use. activities contributed the remainder.
Offshore participation in the domestic residential building The industry is also fast growing, with net output growing
industry is limited. Foreign firms are often unfamiliar by an average 4.8% per annum between 2000 and 2017.
with local operating conditions and building projects in In recent years, it has grown even faster, averaging 6.6%
New Zealand tend to be relatively small. since 2012.
INDUSTRY INSIGHT - RESIDENTIAL BUILDING | 13 September 2017 | 5Figure 8 shows that the residential building industry has Figure 10: Net capital stock by asset type
generally outperformed economy as a whole as well
Residential buildings
as associated industries in the broader building and
143151 Non residential buildings
construction sector. 32
21 Heavy & civil Engineering
62 Plant machinery and equipment
Figure 8: Growth in contribution to the Transport equipment
New Zealand economy 336
Intangible Fixed Assets
$757, 261
Computer software
134
Index = 100 in 2000 Index = 100 in 2000 Mineral & other exploration
250 250
Research and development
230 All Industries 230
Weapon systems
Other Building & Construction Industries
210 210
138 Source: Stats NZ
Residential Building Industry
190 190
170 170
150 150
130 130 Figure 11 shows how additions to the residential asset base,
110 110 normally referred to as gross fixed capital formation (GFCF),
90 90 have tracked since 1988. Growth in GFCF in residential
buildings has been impressive, rising by almost 75%
Source: Westpac, Stats NZ
70 70
2000 2002 2004 2006 2008 2010 2012 2014 2016
between 2010 and 2017 (March year ending), averaging
8.4% over the period.
Figure 9 shows that growth in residential building industry Figure 11: Gross fixed capital formation by asset type
output is a lot more volatile than changes in overall
economic activity. Since 2000, the industry has regularly 30
APC, Constant 2009/10 Prices $bn, Nominal
20
GFCF - Residential Building
posted double-digit increases and decreases in output. 25 18
Growth GFCF - Residential
By contrast, the growth in the economy as a whole has 20
Buildings
16
remained relatively consistent, dipping briefly into negative 15 14
territory following the global financial crisis. 10 12
5 10
0 8
Figure 9: Comparative growth in value add -5 6
-10 4
20 APC APC 20 -15 2
Residential Building Industry Value Add -20 Source: Stats NZ 0
15 15
All industries Value Add 1988 1992 1996 2000 2004 2008 2012 2016
10 10
Boom
5 Boom 5
0 0
-5 -5
Kiwis have long favoured
investing in houses because
Bust
-10 -10
-15
Source: Westpac, Stats NZ
-15
of tax advantages, notably the
2001 2003 2005 2007 2009 2011 2013 2015
absence of a universal capital
gains tax and the ability to write
off rental losses against personal
Residential investment demand income tax.
Investment made in residential building activity is
significant – it is also highly volatile.
Figure 10 shows that residential buildings are by far the The strong growth in GFCF also shows up in contributions
single largest asset type in New Zealand. Valued at $336bn to overall economic activity. Figure 12 shows that GFGF
in 2016, they account for a massive 44.3% of New Zealand’s in residential building activity typically contributes 5% to
net capital stock or physical asset base. By comparison, 6% to New Zealand’s GDP. This is higher than for other
non-residential buildings, which are the second largest industries within the broader building and construction
asset type contributed just over 18.2%, while horizontal sector. GFCF in non-residential building and heavy and civil
infrastructure; i.e. civil construction and heavy engineering engineering, which both contribute between 2% and 3% to
contributed 17.7%. GDP, have effectively flat-lined in recent years.
INDUSTRY INSIGHT - RESIDENTIAL BUILDING | 13 September 2017 | 6Figure 12: Relative GFCF contributions to GDP Figure 13 also shows that GFCF is significantly more volatile
than economic activity. This reflects the impact of a number
7
% of GDP
Non-Residential Building
% of GDP
7 of factors, ranging from changes in borrowing rates and
6
Civil & Heavy Engineering
6 access to funding - most residential building is privately
Residential Building
funded – to how quickly the industry is able to adapt to
5 5
changes in demand.
4 4
3 3
Figure 13: Relative growth rates - GFCF versus GDP
2 2
APC APC
40 50
1 1
30 Change in Asset Base - Residential Building 40
Source: Statistics New Zealand
0 0 GDP 30
2000 2002 2004 2006 2008 2010 2012 2014 2016 20
20
10
10
0
Figure 13 contrasts changes in GFCF in residential building 0
-10
with activity in the economy as a whole. It shows that -10
investment in residential building activity follows the same -20
-20
pattern. This is not surprising considering that economic -30 -30
growth is largely dependent on the capacity to grow. -40 Source: Stats NZ
-40
01Q1 03Q1 05Q1 07Q1 09Q1 11Q1 13Q1 15Q1 17Q1
INDUSTRY INSIGHT - RESIDENTIAL BUILDING | 13 September 2017 | 7Mapping the value chain
Figure 14 summarises the value chain of which the Outputs
residential building industry is a part:
The key outputs produced by the residential building sector
are newly constructed homes and alterations, repairs and
Inputs maintenance made to existing homes.
The key inputs used by the industry are services, materials, The industry builds between 24,000 to 30,000 homes each
and labour. year (mostly for the upper end of the market) and alters,
Services are provided by local contractors, their sub- maintains and repairs about 32,000 houses.
contractors, architectural and engineering consultancies. The value of these outputs amounted to just under $13.7bn
Figure 15, which details what these services consist of, in 2016.
estimates that they cost the residential building industry
about $4.9bn per year (expressed in basic prices). Of this –– The construction of new homes contributed
total, expenditure on contractors and sub-contractors that $10.5bn to the total. Based on building consent
provide a range of building, installation and finishing services, data, we estimate about 96% was funded privately,
are the biggest cost item, costing the industry about with individuals accounting for 85% and property
$3.8bn. Professional services, which include architectural developers the remainder. A mixture of local and central
and engineering consultancy as well as legal, accounting, government (including public corporations) funded the
advertising and marketing services, account for $0.6bn. remaining 4%.
Materials range from non-metallic mineral based products –– Alterations made to existing homes contributed an
to wood and fabricated wood products. Figure 16 details estimated $2.2bn while repairs and maintenance
these manufactured products, which cost the residential activities added a further $1.0bn to the total.
building industry $1.9bn per annum (again expressed in
basic prices). Of this total, about $0.4bn, mostly non- Conversion
metallic mineral products, such as plastics, glass, ceramics
Converting inputs into outputs incorporates a number of
and various articles of concrete and stone and a small
inter-related steps involving a range of services provided by
quantity of wood and wood products, including panels and
different professions, trades (collectively referred to above
boards, are imported into New Zealand annually.
as construction services) and suppliers (referred to above
Labour used by the construction companies themselves as materials). This process is shown in Figure 17. The role of
rather than the contractors and sub-contractors, costs in a residential building company is to manage this process
the region of $0.8bn per annum. from procurement to delivery and signoff.
Figure 14: Simplified value chain mapping of the residential building industry
Suppliers Inputs* Conversion Outputs
Cost of Inputs Value of work
Manufacturing $1.9bn Materials House Construction $10.5bn
Residential
$0.8bn Labour Building Alterations $2.2bn
Sub-Sector
Other Construction Firms
Professional Services Repairs & $1.0bn
$4.9bn Services maintenance
Other Services
Administration Services
*Inputs shown in basic prices – excludes taxes payable, subsidies received or transport charges by the supplier.
Source: Westpac, Stats NZ
INDUSTRY INSIGHT - RESIDENTIAL BUILDING | 13 September 2017 | 8A grossly simplified process might proceed along the and landscaping. In determining the cost several factors
following lines. have to be considered, not least of which is the cost of
–– A customer or property developer that has purchased services referred to above; i.e. land development costs,
a section would enter into discussions with a residential architects, consulting engineers, contractors and sub-
building firm or invite responses to tender (either open contractors etc, materials, labour and profit margins.
to all or closed to a selected few). –– Once appointed the residential building firm project
A residential building firm could also purchase one manages the building process, ensuring that work done
or more sections, then develop and build on them is in line with design specifications, within budget and on
themselves using contractors in line in normal practice. time. In part, this involves the managing and outsourcing
Alternatively, they might enter into joint ventures and of works to contractors, who in turn outsource to many
alliancing agreements to develop the sections. more sub-contractors. It also involves interacting with
the authorities to make sure consents are in place and
Is also possible that a customer might contract
required inspections have been undertaken.
directly with a property developer to undertake land
development and site preparation works and then –– Once complete, the constructed building would be
separately with a residential building firm. signed off, subject to final inspections and approvals.
–– A residential building firm would be required to provide –– A residential building firm that has developed and built
a detailed design specification and cost breakdown for on sections that it has bought previously may retail
all phases of the build, from site preparation to finishing these sections directly to end customers.
Figure 15: Breakdown of services provided to the residential building industry
Residential building ($1.2bn)
Non-residential building ($0.1bn)
Civil Engineering ($0.0bn)
Pre-erection work ($0.2bn)
$3.8bn Construction Firms
Other Installation work ($0.3bn)
Electrical Installation work ($0.7bn)
Plumbing and other installation work ($0.5bn)
Building completion work ($0.8bn)
Architectural & engineering services ($0.4bn)
Accounting & taxation services ($0.1bn) $0.6bn Professional Services
$4.9bn Services
Other professional services ($0.1bn)
Transport, postal & warehousing services ($0.1bn)
Information, media and telecom services ($0.0bn)
$0.3bn Other Services
Financial & insurance services ($0.1bn)
Other support services ($0.1bn)
Maintenance services ($0.1bn)
Government administration services ($0.0bn) $0.2bn Administration Services
Other admin services ($0.1bn)
Note: Inputs shown in basic prices – excludes taxes payable, subsidies received or transport charges by the supplier.
Source: Westpac, Stats NZ
INDUSTRY INSIGHT - RESIDENTIAL BUILDING | 13 September 2017 | 9Figure 16: Breakdown of material inputs into the residential building industry
Wood & wood products ($0.7bn)
Petroleum products ($0.1bn)
Chemical products ($0.0bn)
Rubber products ($0.0bn)
Plastic products ($0.1bn)
Glass products ($0.0bn)
$1.9bn Manufacturing Materials
Non-structural ceramic products ($0.1bn)
Cementitious products ($0.3bn)
Steel & structural metal products ($0.4bn)
Prefabricated buildings ($0.1bn)
Other fabricated metal products ($0.0bn)
Domestic Appliances ($0.1bn)
Note: Inputs shown in basic prices – excludes taxes payable, subsidies received or transport charges by the supplier.
Source: Westpac, Stats NZ
Figure 17: Simplified steps for building a house
Section
Purchase Design Site Prep Foundations Building Finishing Landscape Signoff
Developer Architect Builder Builder Builder Builder Fencer Building
Inspector
Real Estate Geotech Earth Mover Plumber Glazier Plasterer Landscaper Plumbing
Agent Engineer Inspector
Lawyer Surveyor Concrete Materials Electrician Electrician Earth Mover Electrical
Supplier Supplier Inspector
Quantity Concrete Materials
Bank Surveyor Supplier Plumber Plumber Supplier Builder
(Estimates)
Local
Contractors Building Window & Floor Concrete
Authority (Tendering) Inspector Door Joiner Polisher Supplier Architect
(LIM)
Contractors Plumbing Materials Garden
(Tendering) Inspector Supplier Carpet Layer Products
Supplier
Building Painter
Inspector
Plumbing
Inspector Joiner
Materials
Supplier
Source: MBIE (in consultation with Tennent-Brown Architects)
INDUSTRY INSIGHT - RESIDENTIAL BUILDING | 13 September 2017 | 10Regulatory environment
The residential building industry is subject to a legislative decisions made throughout the design and building
and regulatory framework that seeks to ensure an orderly processes by introducing a new framework for regulating
and balanced approach to land use planning, provide building work and by establishing a licensing regime for
protection to customers against unethical practices and building practitioners.
ensure a safer working environment for workers. However,
Recent amendments to the Act include changes to
this framework has been criticised for stifling supply,
building consent requirements as well as higher penalties
resulting in a massive pipeline of building work that the
for building without an approved consent. The Act also
industry will be hard-pressed to address given existing
provides building consenting authorities, normally local
capacity levels. councils, with increased authority when restricting access
The following legislative and regulatory provisions apply: to dangerous sites.
Resource Management Act 1991 (RMA) Other amendments include the Building (Earthquake-prone
Buildings) Amendment Act 2016, which introduced changes
The Resource Management Act 1991 (RMA) sets out how to the way earthquake-prone buildings are identified
New Zealand’s physical environment is to be managed. and managed under the Building Act. A new system for
Among other things, it regulates land use and the provision managing these types of buildings, introduced in July 2017,
of infrastructure, including residential buildings. will mean that remedial work will have to be completed
The RMA has proved to be controversial. Businesses within a specified time-frame.
in general and land developers in particular have long The Building Code, which is contained in regulations that
criticised the RMA’s resource consent process as being relate to the Act, sets out the minimum standards against
expensive, overly bureaucratic and time-consuming. which building work in New Zealand must comply – even
Other criticisms relate to differences in interpretation work that does not require a building consent.
and application by district and regional councils, a
disproportionate role played by activist groups and a lack of Standards change periodically to keep pace with industry
a proper performance measurement framework of measure developments and other issues that impact on the
its effectiveness integrity of buildings such as the Canterbury and Kaikoura
earthquakes. Typically, these are more stringent than
A 2014 report by Motu Economic and Public Policy those that they replace which has the effect of pushing up
Research seems to support this view. It concluded that building costs.
the RMA, through a combination of section and floor size
requirements, extended consent processes and other Importantly, the Code specifies how completed building
urban design considerations, had added an extra $30,000 work must perform rather than how it must be built and
to the cost of apartment in Auckland, and at least an so it promotes innovation by encouraging builders to
extra $15,000 to the cost of a home. The report estimated use different products and new approaches to building
that additional costs, time delays and uncertainties had (perhaps offsetting the rise in building costs associated
effectively reduced the housing stock by 40,000 homes with the introduction of new standards). However, with
and added an extra $30bn to the cost of building over the most builders focused on day-to-day activities, innovation
last decade. is not high on the priority list. In the absence of a proper
measurement framework it is not clear whether the codes
Recognising these problems the government has have made any material difference to innovation levels in
introduced a series of incremental reforms to streamline the industry.
the resource consent process. The latest round of reforms
were passed in April 2017. Health & Safety at Work Act 2015
The primary objective of the Health & Safety at Work Act
Since then, the government has announced its intention
2015 is to ensure that firms operating in the industry meet
to develop new planning legislation that is separate to
workplace health and safety requirements. Work fatalities
the RMA and dedicated to urban environments. Having
within the building and construction industry as a whole are
separate objectives for regulating urban and natural
more than double the average for all other sectors, with an
environments should mean that these new urban planning
average 10 deaths per year occurring on sites. On average,
laws will enable faster development of housing and other
there are more than 26,000 workplace injuries, of which
urban infrastructure.
more than 3,000 require more than a week off work. This
Building Act 2004 has an adverse impact on the industry productivity and
significantly increases the costs incurred by business.
The primary objective of the Building Act 2004 is to make
sure that buildings are designed and built correctly the In accordance with the Act, Worksafe New Zealand
first time. The Act also seeks to improve the quality of specifies and enforces a range of rules that cover various
INDUSTRY INSIGHT - RESIDENTIAL BUILDING | 13 September 2017 | 11operational aspects of construction from working at Construction Contracts Amendment Act 2015
heights, with tools, machinery and hazardous materials to
The Construction Contracts Act 2002 (the Act) regulates
public safety, site access and emergency situations.
payment provisions in commercial construction contracts.
Licensed Building Practitioner Rules 2007
From 31 March 2017 construction companies, developers
The primary objective of the Licensed Building Practitioner and property owners that contract work out to sub-
Rules (LBP) are to ensure that construction work critical contractors will be required to make new provisions
to the integrity of a building is done by workers that are regarding retention payments, i.e. monies owing to
able to achieve the required standards set out by the sub- contractors held back to ensure any required
Building Code. remedial works are completed. Retention payments
Licences are granted for seven types of restricted typically comprise about 5% to 10% of construction
construction related activity. These activities focus on site company turnover.
oversight work, design work, carpentry, bricklaying (and There are two ways to safeguard retentions: either set the
block laying), plastering, roofing and laying of foundations. cash aside (usually in a trust) or purchase an insurance
A key aim of the rules is to lift practitioner performance product. However, insurers will typically only provide
and productivity. However, with labour productivity insurance to construction companies that have good
in the industry having flat-lined for a number of years balance sheets. Furthermore, under the amendments
and continuing to underperform against the national sub-contractors will be allowed to inspect building firm’s
aggregate, it’s not clear what contribution these rules might records to see whether they have financial resources to
have made. make retention payments and will tend to favour those
that do.
They are also supposed to help consumers make informed
decisions about the practitioners they engage. However, The risk is that commercial construction companies that
given the speed at which workers enter and exit the are not well capitalised and/or do not have strong cash
industry, it is likely that most consumers are making the flows could go out of business. This could affect large
decisions based on price more than the licensed status of scale builders that focus on non residential buildings but
their contractors. might have interests in the residential building industry.
INDUSTRY INSIGHT - RESIDENTIAL BUILDING | 13 September 2017 | 12Competitive dynamics
When trying to understand the nature of competition within the residential building industry, it is
important to understand what factors shape the supply of capacity and the demand for it, how these
might have changed over time and how these are likely to change in the future. It is also important to
consider regional dimensions when assessing these factors.
Demand side drivers Factors influencing household type include:
When considering what factors influence the demand for Changes to affordability. Increasing house prices have
residential buildings it is useful to distinguish between reduced affordability, which has encouraged new living
those that have longer-term structural, short-term cyclical arrangements and resulted in larger household sizes.
and disruptive impacts. This is particularly evident in Auckland where median
price to income ratios have risen from 4.7 in 2002 to 8.8 in
Long-term structural factors early 2017.
Simply put, the bigger the population, the more households High house prices and tax advantages enjoyed by landlords
there will be and as a consequence, the greater the need but not by first time home buyers have resulted in declining
for residential buildings. Figure 18 shows the trajectory of home ownership rates (currently 64% compared to 75%
New Zealand’s population and number of houses since in the early 1990s). This has been particularly evident in
1998. New Zealand’s population increased from 3.7m in Auckland, where 40% of households now rent.
1996 to just under 4.7m people in 2016, while the number
of households rose from 1.3m to 1.7m over the same period. Figure 19: Growth in household types
Both grew by an average 1.2% over the period.
000s 000s 450
450
Another important factor shaping demand is household 400
Source: Stats NZ
400
type. Stats NZ defines a household as either a single person 350 350
who lives alone or two or more people who usually live 300 2001 300
2006
together. A household may contain one or more families, 250 2013 250
other people in addition to a family, or no families at all, 200 200
such as unrelated people living together in a commune 150 150
type setting. 100 100
50 50
0 0
Figure 18: Growth in population and households Couple only Couple with One parent One-person
child(ren) with child(ren) household
Index 100 in 1998 Index 100 in 1998
130 130
125
Households
125 Changes to the population age profile. Figure 19 shows
120 Population 120
that the number of one and two person households (which
together account for 57% of all households in New Zealand)
115 115
have grown more strongly than other household types. The
110 110 key reason for this is the large increase in the number of
105 105
people living in New Zealand aged 65 and over – between
1996 and 2016 this cohort increased by 62.4% and now
100 100 makes up almost 15% of the New Zealand’s population.
95
Source: Stats NZ
95 In 2013, about 80% of people living alone (one-person
1998 2000 2002 2004 2006 2008 2010 2012 2014 2016
households) were aged 45 years and older, with 44% being
older than 65. This trend is likely to continue.
The extent to which changing household types affect demand
for building activity depends on whether the different types
New living arrangements of housing that exist are able to meet changing needs. For
support demand for different example, a growing but ageing population is likely to mean
more dwellings, but a larger proportion of these would need
types of housing. Especially, to be able to cater for the needs of the aged. These homes
when the number of households would typically be smaller, single storey and with easier entry
and exit. If these homes do not exist, they would have be built
is increasing. or existing houses, some of which may have become surplus
to requirements, be altered.
INDUSTRY INSIGHT - RESIDENTIAL BUILDING | 13 September 2017 | 13Figure 21: Growth in building consents between
2009 - 2017
Changes to the structure of
New Zealand’s population will
increase demand for different 3452
Houses
types of housing. This will lift Apartments
levels of building activity over 14 286
Retirement village units
what would have been required 937
7392
Townhouses, flats,
if the population had increased units, and other
dwellings
but no structural changes 2505 Source: Westpac, Stats NZ
had occurred.
Figure 20: Building Consents by Building Type
Although demand for other
types of housing has increased,
Index = 100 in Jan 97, 12m mave Index = 100 in Jan 97, 12m mave
600 600
Houses
500 Apartments
Townhouses, flats, units, and other dwellings
500
the biggest gains are still in
400 Retirement village units 400 standalone housing.
300 300
200 200
Nonetheless, a growing number of smaller households and
100 100 higher land prices has resulted in a shift towards smaller
0
Source: Westpac, Stats NZ
0
homes. According to Stats NZ, the average floor size of all
Jan-97 Jul-99 Jan-02 Jul-04 Jan-07 Jul-09 Jan-12 Jul-14 dwellings consented for the 12 months ending June 2017 was
169m². This compares to the peak of 197m² recorded in 2010.
Demand for smaller homes has been growing for some This reflects a fall in the average floor size for all new
time. Figure 20 shows that demand for retirement homes, irrespective of type. The average floor size of new
homes has grown strongly over the past 10 years or standalone houses has shrunk slightly from an average
so, underpinned in no small part by New Zealand’s 216m² in 2010 to 208m² for the 12 months ending June 2017;
ageing population. apartments from 149m² to 108m²; retirement units from
However, growth has not just been limited to retirement 158m² to 119m²; and townhouses from 123m² to 119m².
homes. Demand for medium and high-density apartments, Despite these declines, floor sizes in New Zealand remain
townhouses and terraced housing has shot up, as surging among the largest in the world. The reasons for this relate
land prices have brought affordability issues to the fore. to the significant tax advantages that owner-occupied
Appreciating land prices have been a key driver of house housing has over other forms of consumption and the
price inflation in Auckland where they account for about role of housing as a tax advantaged investment. For most
60% of the cost of a new dwelling (compared with 40% in households, their house is their largest single asset, so new
the rest of New Zealand). owners tend to build with a view to re-selling into what they
perceive to be the main market, i.e. Four bedrooms, double
In addition to affordability issues, other factors supporting garage, and as much floor area as their budget allows.
demand for medium- and high-density apartments, etc. These choices reflect high land and building consent costs,
include greater environmental awareness, proximity to work which encourage new owners not to under-capitalise.
considerations and other design features. Factors working
against the shift include perceptions of quality, a historical For those that can afford new standalone homes, the trend
preference for traditional standalone houses and issues has been towards greater individualisation, either in the
form of architecturally developed homes from scratch or
relating to community living, such as a loss of privacy.
off existing standard plans (provided by housing companies
Despite the trend towards other types of homes, demand such as Signature Homes, GJ Gardner, etc.). As a result,
for standalone homes still dominates. They account for new housing in New Zealand is characterised by a variety
just under 80% of building consents for new residential of housing forms with little standardisation. A survey of
structures. Figure 21 shows the number of building consents new homeowners by BRANZ found that found that 50%
by type of new home increased by just under 14,300 of respondents had altered a selected design from their
building consents between 2009 and 2017. About 52% of builder’s standard plans, while another 40% had worked
these were for new houses. with an architect to produce a one off design.
INDUSTRY INSIGHT - RESIDENTIAL BUILDING | 13 September 2017 | 14As a rule, individualisation tends to lead to larger average Figure 23: Building consents and borrowing rates
house sizes. It also results in higher costs when compared APC Inverted %
60.0 0
to standard designs. These range from about 15% Building Consents - Residential Building (LHS)
-2
from small-scale builders to as much as 25% for larger 40.0 Floating Mortgage Rates (RHS)
group builders. -4
20.0
-6
0.0 -8
The priority for buyers when -20.0
-10
purchasing a standalone home
-12
-40.0
-14
is get the best quality, including -60.0 Source: Westpac, RBNZ
-16
design features, within their
00Q1 02Q3 04Q4 07Q1 09Q2 11Q3 13Q4 16Q1
budget. Build time is important Low interest rates also encourage people to buy already
for buyers but of a lesser priority. standing homes. However, the extent to which they do
reflects a number of factors, not least of which is the ability
to pay back any borrowings they might have made to
fund their purchase given existing debt burdens and debt
Short-term cyclical factors servicing requirements.
The long-term factors referred to above support a gradual Note: Westpac’s Economics Team analyses and
increase in demand for residential building activity. reports on the factors shaping the residential market
However, there are also short-term cyclical factors affecting on an ongoing basis. Our latest in-depth report on the
demand that are far more volatile. residential market, titled “A Tale of Three Cities” can be
accessed at https://www.westpac.co.nz/assets/Business/
Net migration. Figure 22 shows that the most recent surge Economic-Updates/2017/Bulletins-2017/A-tale-of-three-
in population numbers in New Zealand was due to record cities-April-2017.pdf. A more summarised view of current
setting net inward migration flows, supported by conducive developments in the residential market is provided in our
domestic economic conditions, increased uncertainties latest Economic Overview titled “Throttle Back”, published
abroad, notably in global labour markets, and a lowering of in August 2017. It can be accessed at https://www.
immigration barriers. westpac.co.nz/assets/Business/Economic-Updates/2017/
Bulletins-2017/Westpac-QEO-Aug-2017_EMAIL.pdf
Figure 22: Migration flows and population growth Disruptive factors
2.5
APC '000 (Sadj)
20 Other relevant factors include disruptive and unpredictable
events, such as the 2011 Canterbury earthquake. Figure 24
2.0
Net Migration (RHS)
15 shows that in the aftermath of the Canterbury earthquakes,
Population Growth (LHS)
residential building activity – new construction as well as
1.5 10 alterations, repairs and maintenance to existing structures
– peaked in 2014. Demand has since started to slow from
1.0 5 these elevated levels as residential works have been
completed. As demand continues to normalise, factors
0.5 0 such as changes in the population are likely to become the
more dominant drivers of activity in the province.
Source: Westpac, Stats NZ
0.0 -5
00Q2 01Q4 03Q2 04Q4 06Q2 07Q4 09Q2 10Q4 12Q2 13Q4 15Q2 16Q4
Figure 24: Canterbury rebuild estimates
Interest rates. Figure 23 shows a lagged inverse 1,200
$mil $mil 1,200
correlation between building consents and interest rates; Residential projects
1,000 Non-residential 1,000
i.e. as rates rise, growth in building consents falls, and Infrastructure
vice-versa. 800 Source: Westpac estimates
800
600 600
Strong migration flows have
400 400
helped grow demand for 200 200
residential building in Auckland. 0
2011 2013 2015 2017 2019 2021 2023
0
INDUSTRY INSIGHT - RESIDENTIAL BUILDING | 13 September 2017 | 15Impact on prices prices typically leads to the exit of firms from the industry.
As for entry, the proportion of firms that leave the industry
The short-term factors referred to above affect the prices
tends to be higher than the national average.
received by firms within the residential building industry.
As shown in Figure 25, these can vary dramatically. Recent The number of new firms entering the industry also aligns
increases in population size, particularly in our larger reasonably well to the financial performance of existing
cities, and strong growth in household numbers (fuelled companies. Figures 26 and 27 suggest that new firms enter
in recent years by strong growth in net inward migration), the industry on the expectation of improved profitability
post-earthquake recovery works in Canterbury, attractive associated with higher levels of investment. This would
interest rates, and shifting customer preferences (driven explain what seems to be a 2-year gap between when
in part by affordability concerns), have underpinned firms start entering the industry and when profits start
demand for residential building in recent years. Within an to improve. The flattening in the number of firms entering
environment characterised by a limited supply of land, the industry shown in Figure 26 suggests that industry
particularly in Auckland, as well as costly and often drawn profitability will moderate in 2017/18.
out consenting processes, this has led to a sustained
increase in the price of residential buildings that began in Figure 27: Surplus before income tax
2009 and is only now starting to show signs of easing. $ Mn $ Mn
1000 700
650
900
Figure 25: Residential building price index vs CPI 600
800
550
APC APC, Seas Adj
12 12 700
500
600 450
10 10
Capital Good Price index -
Residential Buildings (LHS) 400
500
8 Headline CPI (RHS) 8 350
400
300
6 6
300
250
Source: Stats NZ
4 4 200 200
2009 2010 2011 2012 2013 2014 2015 2016
2 2
0 0 Figure 27 shows that profitability in 2016 was higher than
-2
Source: Stats NZ
-2
2015. Industry margins rose from 6.0% to 7.1% in 2016. The
96Q1 99Q1 02Q1 05Q1 08Q1 11Q1 14Q1 17Q1 main reason for this was a widening in the gap between
output and input prices as shown in Figure 28. During this
period, residential building prices, supported by strong
Supply side drivers demand, grew faster than input costs, underpinned by
higher prices for construction services.
There are a range of factors that affect the supply of capacity.
A different story is beginning to emerge in 2017. As growth
Changes in demand. Strengthening demand and higher
in building consents start to slow, competition among
prices have encouraged new entrants into the industry in
existing firms has grown, input costs have increased
recent years. Figure 26 shows that the number of new firms
(because of higher construction services costs, which
entering the building and construction sector slightly lags
account for about 40% of total production costs – see
the pickup in prices shown in Figure 25 and the increase in
Figure 29) and output prices, reflecting a softening in
investment in residential buildings shown in Figure 11.
demand conditions, have moved sideways. A resulting
narrowing of the gap between input and output prices is
Figure 26: Birth of new firms likely to have translated into lower profitability, tighter
20
% of Active Firms % of Active Firms
20
margins and tougher competition.
18 Births - All Sectors 18
Births - Construction Sector Figure 28: Factor input prices
16 16
APC APC
10 10
14 14
PPI Input - Residential Building
12 12 8 8
Capital Good Price index -
Residential Buildings
10 10 6 6
8 8
4 4
Source: Westpac, Stats NZ
6 6
2001 2004 2007 2010 2013 2016
2 2
Although figures are not readily available, it is highly 0 0
probable that this is even more pronounced for the -2
Source: Stats NZ
-2
residential building industry. The opposite situation also 96Q1 99Q1 02Q1 05Q1 08Q1 11Q1 14Q1 17Q1
applies – subject to a lag, weakening demand and softer
INDUSTRY INSIGHT - RESIDENTIAL BUILDING | 13 September 2017 | 16Figure 29: Production cost structure tends to be high. However, switching costs for alterations,
%
repair and maintenance work, primarily undertaken by
100 % 100
small firms, are typically low, which can act as an incentive
90 Construction 90
Services 25% to new entrants.
80 Materials 80
70 70 Distribution channels – If existing firms have already been
Labour
60 60 able to secure distribution channels, it may be difficult
35%
50 50 for new firms to be able to distribute their own products.
40 40 The upstream supply chain to the residential building
30 30 industry is highly fragmented, which can lead to a number
20 40% 20 of management and logistical issues – especially for new
10 10 entrants that do not have the relationships that incumbents
have already established. While there is little to stop new
Source: Westpac
0 1
0
entrants from accessing these channels, relationships in
Barriers to entry and exit. The ability of the industry to this industry matter and a lack of a track record may mean
respond to fluctuations in demand depends on barriers to that existing firms crowd them out.
entry and exit. The lower the barriers, the more responsive Capital requirements – If new firms face significant
the industry is to demand conditions. Low to medium
capital expenditure to start-up operations, they may
barriers to entry for small firms mean that they are able
be discouraged from entering the industry. This is not a
to easily enter the industry during boom times and leave
particular problem for small firms that build a couple of
when cash flows dry up in the more challenging periods.
houses a year and/or undertake small-scale renovation,
Large, better-capitalised firms are typically able withstand
a downturn in fortunes, in part because they are often repair and maintenance work. They do not to invest heavily
involved in associated industries, i.e. non-residential and in plant and equipment and rely heavily on timely payments
civil engineering and heavy construction. for work completed to bolster cash flows. For larger firms
focusing on large-scale projects, ranging from property
Larger firms will react to these challenging periods by development to the construction of medium density
co-opting smaller firms to provide resources. However, as apartment blocks and other large complexes, the start-up
conditions become more difficult they will start focusing capital requirements can be significant.
inwardly, restructuring poorly performing units, eliminating
areas of non-core competency, and merging, acquiring Cost advantages independent of scale – If existing firms
and/or entering into joint ventures/alliances. have cost advantages that cannot be replicated, it may
be difficult for new firms to enter the industry. Small firms
The ease with which firms are able to enter and exit the
may enjoy some advantages because they understand
industry depends on the existence of:
the nature of demand within specific localities and
Economies of scale – If firms are able to generate cost are members of a registered body, such as Registered
advantages through economies of scale, it may be more Master Builders Association (RMBA). The same applies
difficult for new firms to enter. Most small firms that for larger firms, although they also more likely to access
characterise the industry do not compete head on with to proprietary technology, either directly or through joint
larger players and are unaffected by any cost advantages ventures and alliances.
these companies are able to generate through bulk
purchasing agreements, joint ventures and alliances. In Regulatory Controls – If government regulations limit entry
boom times, when supply side constraints become more into an industry then new entrants might be discouraged
evident, it is common practice for larger firms to purchase from entering. The residential building industry is highly
capacity from small firms or in the case of labour procure regulated and the trend is for further tightening. These
from overseas. For smaller firms, a lack of capacity to follow include changes to licencing requirements for building
complicated immigration processes/eligibility rules severely practitioners, more stringent workplace health and
hampers their ability bring in people from abroad. safety standards, and improvements to the building
code. Although subject to reforms, lengthy and costly
Brand loyalty – If existing firms have high brand loyalty, new
entrants might need to invest heavily in their own branding, consenting processes are also a disincentive to new market
which can act as a disincentive. Given the one-off nature of entrants. Membership of organisations such as the RMBA
home building, brand loyalty is not a significant hurdle for and New Zealand Certified Builders (NZCB) may help with
new entrants to overcome. Reputation is more of an issue. when providing warranty insurance, which can improve
Small firms often rely on word-of-mouth recommendations competitiveness when pitching for work.
for repeat business within very specific localities. Barriers to exit – If it is too difficult or costly to exit an
Switching costs – If the costs faced by customers of industry, then new entrants might be discouraged from
switching between different products is high, new entrants entering. For smaller players there are few if any barriers to
might find it more difficult to compete. Because building exit. Although larger players may have invested significantly
homes is such a lengthy and complicated process (see in capital and labour resources, these are often transferable
page 10), the costs of switching from one firm to the other to associated industries.
INDUSTRY INSIGHT - RESIDENTIAL BUILDING | 13 September 2017 | 17You can also read