INDUSTRY REPORT submarine telecoms 2013 - Authored by - SubTel Forum
←
→
Page content transcription
If your browser does not render page correctly, please read the page content below

s ub m a r i n e t e l e c o m s
 INDUSTRY
  REPORT                    2013

        Au t h o r e d
             by
Submarine Cable Industry Report Issue 2 March 2013 Copyright © 2013 by Submarine Telecoms Forum, Inc. All rights reserved. No part of this book may be used or reproduced by any means, graphic, electronic, or mechanical, including photocopying, recording, taping or by any information storage retrieval system without the written permission of the publisher except in the case of brief quotations embodied in critical articles and reviews. Submarine Telecoms Forum, Inc. 21495 Ridgetop Circle Suite 201 Sterling, Virginia 20166 USA www.subtelforum.com ISSN: pending 2

Disclaimer: While every care is taken in preparation of this publication, the publishers cannot be held responsible for the accuracy of the information herein, or any errors which may occur in advertising or editorial content, or any consequence arising from any errors or omissions, and the editor reserves the right to edit any advertising or editorial material submitted for publication. If you have a suggestion, please let us know by emailing industryreport@subtelforum.com. 3

Table of Contents 1. Foreword 10 2. Introduction 11 3. Executive Summary 13 4. Worldwide Market Analysis and Outlook 18 4.1 Overview of Historical System Investment 20 4.2 2008 – 2012 Systems in Review 20 4.3 Systems Investment in 2013 and Beyond 21 5. Supplier Analysis 25 5.1 System Suppliers 25 5.2 Upgrade Suppliers 26 6. Ownership Analysis 28 6.1 Financing of Current Submarine Systems 28 7. Regional Market Analysis and Capacity Outlook 31 7.1 Transatlantic 31 7.1.1 Bandwidth and Capacity 31 7.1.2 New Systems 34 7.2 Transpacific 37 7.2.1 Bandwidth and Capacity 37 7.2.2 New Systems 39 7.3 North and South America 43 7.3.1 Bandwidth and Capacity 43 4

7.3.2 New Systems 45 7.4 Australia and New Zealand 49 7.4.1 Bandwidth and Capacity 49 7.4.2 New Systems 52 7.5 Sub-Saharan Africa 57 7.5.1 Bandwidth and Capacity 57 7.5.2 New Systems 61 7.6 South Asia & Middle East/Europe-Asia 62 7.6.1 Bandwidth and Capacity 62 7.6.2 New Systems 65 7.7 Pan-East Asia 67 7.7.1 Bandwidth and Capacity 67 7.7.2 New Systems 69 7.8 Polar Route 70 8. Conclusion 73 List of Figures: Figure 1: Investment in New Submarine Fiber Optic Projects, 18 1987-2012 Figure 2: Deployment of New Submarine Fiber Optic 20 Projects, 1987-2012 Figure 3: Investment in New Submarine Fiber Optic Projects 21 by Region, 2008-2012 5
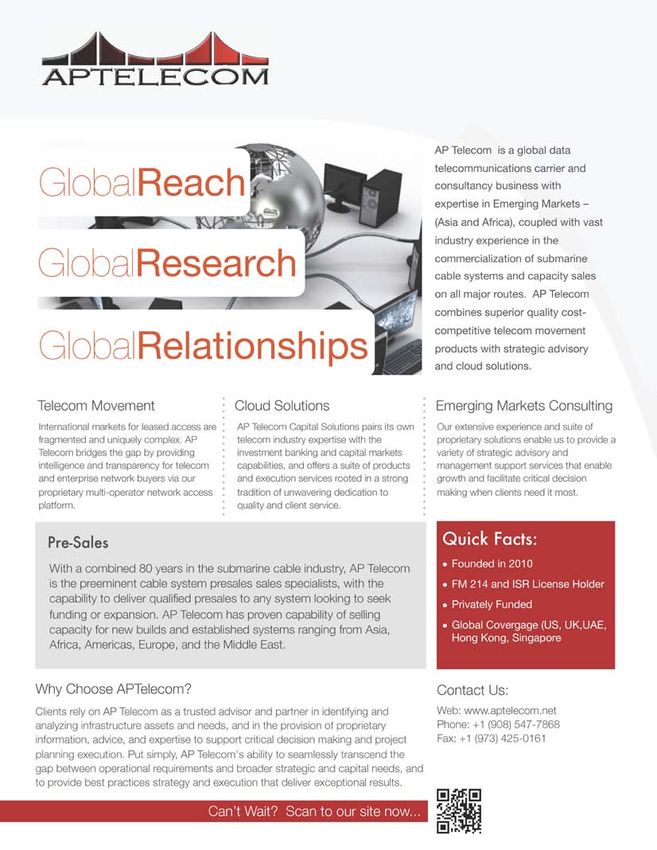
Figure 4: Projects with 2013 RFS Dates and Proposed 22 Submarine Fiber Optic Projects Figure 5: Credible (“High-Activity” and “Medium-Activity”) 23 Proposed Submarine Fiber Optic Projects by Region, 2013 and Beyond Figure 6: Market Share for Supply of New Systems, 2003- 25 2013 Figure 7: Financing of New Submarine Fiber Optic Systems, 28 1987-2012 Figure 8: Financing of New Submarine Fiber Optic Systems, 29 2008-2012 Figure 9: Total Activated Transatlantic Capacity, 2007-2012 33 Figure 10: Total Activated Transpacific Capacity, 2007-2012 38 Figure 11: Chinese International Internet Bandwidth, 2003- 39 2012 Figure 12: Chinese Operators’ Share of China’s International 41 Internet Bandwidth, 2013 Figure 13: Total Activated North America-South America 44 Capacity, 2007-2012 Figure 14: Share of South American International Bandwidth 45 Demand by Country, 2013 Figure 15: Total Activated Capacity between Australia & 50 New Zealand and the United States (including Hawaii and Guam), 2007-2012 Figure 16: Investment in New Sub-Saharan African Systems, 57 1993-2012 Figure 17: Total Activated Sub-Saharan African 59 Intercontinental Capacity, 2007-2012 6

Figure 18: Total Activated South Asian Interregional 63 Capacity, 2007-2012 Figure 19: Total Activated Pan-East Asian Capacity (Trunk 68 Segments), 2007-2012 List of Tables: Table 1: Growth in Activated Capacity along Major Undersea 14 Routes, 2007-2012 Table 2: Key Upgrade and Redeployment Projects for 27 Equipment Suppliers Table 3: Existing Transatlantic Cable Systems 32 Table 4: Planned Transatlantic Cable Systems 36 Table 5: Existing Transpacific Cable Systems 37 Table 6: Planned Transpacific Cable Systems 40 Table 7: Existing US-Brazil Cable Systems 43 Table 8: Major Brazilian Operators and Their Submarine 46 Cable Assets, 2013 Table 9: Proposed Latin American Systems 47 Table 10: Existing Australia/New Zealand Intercontinental 49 Systems Table 11: Market Share of Major Operators in Combined 51 Australia & New Zealand Markets, and Their Key Intercontinental Submarine Cable Assets, 2013 Table 12: Proposed Australia/New Zealand Intercontinental 54 Systems Table 13: Existing West African Intercontinental Systems 58 Table 14: Existing East African Intercontinental Systems 58 7

Table 15: Proposed Sub-Saharan African Intercontinental 61 Systems Table 16: Existing South Asian Interregional Systems 64 Table 17: Proposed South Asian Interregional Systems 66 Table 18: Existing Pan-East Asian Systems 68 Table 19: Proposed Pan-East Asian Systems 69 Table 20: Proposed Polar Systems 70 Sponsors: AP Telecom 56 Ciena 17 Huawei Marine 24 SubOptic 2013 9 Telecom Egypt 30 Terabit Consulting 12 WFN Strategies 72 8

1. Foreword
SubOptic is once again pleased to support the Subtelforum Industry
Report, now in its second year. It fills a gap in the market place by
providing an independent view of the overall industry written by
Terabit Consulting, who have insider knowledge of the structure
and challenges it faces in the future.
Its views are those of the author and some readers may take issue
with some of the conclusions it reaches, but then that is life and not
all commentators have the same view of the world, which is why
an independent author is essential.
Fortunately with SubOptic 2013 being held next month in Paris,
there is an opportunity when the industry comes together, to debate
and discuss both the contents of this report and the wider issues of
concern to many of us in the community of interest served by our
industry.
Some of these are highlighted in this report such as:
• Where will money come from to finance new system build?
• What will the shape of the industry be over the next five years?
• How will the upgrade market impact the turnkey system suppliers?
• The different drivers that will impact the various geographic regions
and what are the major challenges to be overcome.
• This is just a short list of the many issues covered by this report,
which deserves to be read in detail.
Well done to Subtelforum for continuing this initiative, which I
hope will become a regular feature. I look forward to seeing you all
in Paris next month, to continue the debate.
Fiona Beck
President of the SubOptic Executive Committee and
President and CEO of Southern Cross Cable Network
102. Introduction Welcome to the second edition of the Submarine Telecoms Industry Report, which was authored by the submarine industry’s leading market analysis firm, Terabit Consulting, with research overseen by Terabit’s Director of International Research, Michael Ruddy. It serves as an analytic resource within a trilogy of products beginning with the Submarine Cable Map and including the Submarine Cable Almanac. The Submarine Telecoms Industry Report features in-depth analysis and prognoses of the submarine cable industry, and serves as an invaluable resource for all who are seeking to understand the health of the submarine industry. It examines both the worldwide and regional submarine cable markets, including issues such as the new-system and upgrade supply environments, ownership, financing, market drivers, and geopolitical/economic events that may impact the market in the future. In this report, Terabit Consulting identified $28.5 billion in new projects that are currently being actively pursued by their sponsors. Of those, $4.5 billion worth of new projects are either under construction or considered to be in an advanced stage of development and well-positioned for near-term deployment. While the crystal ball will rarely be completely clear, one fact remains – that our 150+ year old international enterprise continues to be a thriving, exciting and ever-evolving industry. Our aim is to make this information as timely and available as possible. As always, we feel that an informed industry is a productive industry. 11
Intelligent intelligence -
                                                        go beyond the numbers!

The Undersea Cable Report 2013
                                                                        From Terabit Consulting

                                                                  The most diligent quantitative and
                                                                  qualitative analysis of the undersea
                                                                  cable market - 1,600 pages of data,
                                                                  intelligence, and forecasts that can
                                                                  be found nowhere else.
                                                                  Terabit Consulting analysts led by
                                                                  Director of International Research
                                                                  Michael Ruddy tell you what’s real
                                                                  and what’s not, where we’ve been
                                                                  and where we’re headed.

      YOUR KEY TO UNDERSTANDING AND HARNESSING
     THE $20 BILLION UNDERSEA MARKET OPPORTUNITY
The     Undersea    Cable    Report
capitalizes on Terabit Consulting’s
global on-site experience working
with carriers, cable operators,
financiers, and governments in over
70 countries on dozens of leading
projects (e.g. AJC, BRICS, EASSy,
Hibernia, SEAS, TBI) - a world of
experience, at your fingertips in a
single resource!

  The Undersea Cable Report 2013 is your single source of information for top-level decision-
    making - with the most detailed profiles, data, market analysis, and forecasts available.

     •   680+ detailed undersea cable profiles                      •   accurate, reliable data
     •   Capacity demand, capacity supply, and capacity pricing     •   valuable intelligence
     •   Ownership, system supply, financing, and project costs     •   innovative modeling
     •   The upgrade market                                         •   thoughtful insight
     •   Global, region-by-region, and route-by-route analysis      •   global perspective
     •   Reliable, detailed forecasts                               •   respected expertise

  For more information visit www.terabitconsulting.com
       or email us at info@terabitconsulting.com
                or call +1 617 444 8605
3. Executive Summary In 2013 the submarine communications industry marks its 25th year of providing transoceanic fiber optic communications. The first quarter-century has been marked by unimaginable highs and lows, but the industry’s performance over the last five years makes clear that it has recovered from its post-dot-com-bubble collapse with a healthy marketplace which, for the foreseeable future, should continue to average at least $2 billion in new investment and 50,000 kilometers annually, together with an increasingly robust upgrade market. More importantly, from the perspective of global economic and human development, the industry’s recent and planned investment patterns show a distinct trend toward improving connectivity in developing regions and accomodating the few island and coastal nations that remain without fiber optic connectivity. Terabit Consulting’s examination of investment and demand reveals that much of the industry’s future activity will be driven by what Terabit identifies as the “BICS” markets – Brazil, India, China, and Sub-Saharan Africa. Over the last five years, more than $6 billion of the period’s $10 billion effectively targeted the latter three markets, and an examination of proposed projects reveals serious plans for an additional $5.5 billion to be invested in the Brazilian market – including two new systems between Brazil and Europe, four between Brazil and the United States, and five between Brazil and Africa. Terabit Consulting identified 177 new projects, with a total value of $28.5 billion, which are either under construction or proposed. Fifteen new projects either entered service in early-2013 or are scheduled for completion in 2013 (i.e. under construction or in advanced stages of development), for a total value of $1.4 billion. There are an additional 24 projects which Terabit Consulting classified as “high-activity,” i.e. considered to be credible projects in an advanced stage of development with a high probability of activation in 2013 or 2014. The total value of these projects is $3.1 billion; consequently, if there are no major construction delays then an average of at least $2 billion worth of new systems will 13
enter service annually in 2013 and 2014. A total of 95 projects were
classified into the “medium-activity” category, for $16.8 billion
worth of proposed investment, serving as a strong indicator of
future deployment over the mid-term. Finally, the “low-activity”
category comprises 43 projects with a combined value of $7.2 billion;
although not in advanced planning stages, each of these projects
was confirmed by Terabit Consulting to be under consideration by
operators or investors, with some showing strong potential based
on market conditions.
An analysis of activated undersea capacity reveals that the greatest
growth has occured in Sub-Saharan Africa, Latin America, and
Asia, led by 71 percent compound annual growth in Sub-Saharan
African intercontinental capacity over the last five years, compared
to 27 percent in the comparatively mature transatlantic market.
Table 1: Growth in Activated Capacity along Major Undersea
Routes, 2007-2012
CAGR, 2007-2012
Sub-Saharan African Intercontinental 71.2%
North America-South America 54.2%
Pan-East Asian 46.6%
South Asia & Middle East Intercontinental 41.2%
Transpacific 36.2%
Australia & New Zealand Intercontinental 33.1%
Transatlantic 26.9%
Terabit Consulting’s regional analyses revealed the unique
characteristics of each long-haul submarine cable market.
In the transatlantic, the lack of new deployment over the last ten
years would seem to make the market ripe for new investment, but
14the financing of new transatlantic cables has proved exceedingly difficult. Nevertheless, there are two serious proposals for new transatlantic connectivity, with each promising low latency between the financial hubs of London and New York. Investment in the transpacific market will continue to be strongly influenced by the growing bandwidth requirements of China and Japan, but Terabit Consulting also identified an opportunity for a transpacific cable from Russia’s eastern coast an even stronger opportunity for single-cable connectivity between the United States and India in order to avoid the risks of passing through Egypt. Deployment of new undersea connectivity to South America will be driven by Brazil, which accounts for half of the continent’s population but five-eighths of its international bandwidth demand. Brazil’s economic growth has been strong and more equitable than in other developing markets, resulting in a larger addressable base for telecommunications and Internet services; the 2014 World Cup and 2016 Summer Olympics are expected to result in even greater increases in bandwidth demand; and its Plano Nacional de Banda Larga (PNBL) is both ambitious and credible. Terabit Consulting’s evaluation of Brazilian operators indicates that there was a strong case for the planned AMX-1 cable, based on the market shares of America Movil’s Brazilian subsidiaries. The collapse of the Pacific Fibre project, which would have connected the United States, New Zealand, and Australia, revealed the challenges faced by private investors hoping to compete in markets served by a handful of operators that control both the consumer markets and the existing international infrastructure. Nevertheless, other investor-led proposals aim to pick up where Pacific Fibre left off. Terabit Consulting believes that some form of operator participation or commitment will be needed for any of the proposed Australian long-haul projects to succeed. Most new Sub-Saharan African investment aims to connect the continent to Latin America, with specific interest in linking the Lusophone countries of Angola and Brazil. From the perspective 15
of the global network, robust connectivity in the South Atlantic is urgently needed but it remains to be seen whether bandwidth demand along the route will be high enough to justify the required investment. Consequently many of the South Atlantic projects have proposed onward links to other continents, hoping to capitalize on the principal of Metcalfe’s law. The market for new undersea capacity to South Asia and the Middle East, which includes the Europe-to-Asia route, is dominated by the expectation that there will be a Sea-Me-We-5, possibly with strong influence from Chinese operators. Terabit Consulting expects that the most successful projects in South Asia and the Middle East will be those that can provide economically and technically viable means of bypassing Egypt. The Pan-East Asian undersea cable market features three new consortium-led projects that are about to be completed, two of which attracted investment from non-traditional investors in the form of Google and Facebook. Terabit Consulting believes that the new consortium-led projects, in which most major East Asian operators have stakes, were necessitated by the fact that most of East Asia’s existing pan-regional bandwidth is controlled by private investors and operators from outside of the region. Plans for trans-Polar connectivity seem to be afflicted by skepticism on the part of financiers, but from a technological, economic, and geopolitical standpoint, the route has never been more credible. Over the long term it is possible that the three largest political powers present in the Arctic (Canada, Russia, and the United States) will take greater interest in the potential for undersea connectivity (and surveillance) in the region. 16
GeoMesh
Land. Sea. Cloud. Networks Unite.

CIENA'S GEOMESH SOLUTION
CHANGES THE GAME.
There's a more flexible and cost-effective way to guarantee
end-to-end network performance from data center to data center.
Ciena's WaveLogic-based transport, intelligent switching, and unified
network management system ensure a future-proof global network
solution, overland and undersea, as cloud-related traffic patterns
continue to evolve.

See how at
www.ciena.com/GeoMesh
4. Worldwide Market Analysis and Outlook
4.1 Overview of Historical System Investment
As of year-end 2012 there had been $56.3 billion worth of
investment in fiber optic submarine systems, comprising 1.25
million kilometers. In the 25 years since the advent of transoceanic
fiber optic systems, the market has averaged $2.25 billion worth of
investment and 50,000 kilometers of deployment per year.
Figure 1: Investment in New Submarine Fiber Optic Projects,
1987-2012
($Billions by Ready-for-Service Date)
$13
$12
$11
$10
$9
$8
($Billions)
$7
$6
$5
$4
$3
$2
$1
$0
1987
1988
1989
1990
1991
1992
1993
1994
1995
1996
1997
1998
1999
2000
2001
2002
2003
2004
2005
2006
2007
2008
2009
2010
2011
2012
Consortium Era: Dot-Com Market Developing-
1987 to 1997 Bubble Dormancy Market Focus
The first transoceanic fiber optic cable, TAT-8, entered service
in December of 1988 (although a few regional systems, both
experimental and commercial, had been installed prior to that date).
For the first ten years of its existence, the submarine fiber optic
cable market was relatively predictable, controlled by consortia of
operators, including many government-owned monopolies.
On January 1, 1998 the European telecommunications market
became fully liberalized. Internet penetration was steadily
ramping up, with usage already exceeding 30 percent in three
18countries: Iceland, New Zealand, and Sweden. By the following year, the submarine consortia’s long-term build-out strategies to accommodate ISDN and Group 4 fax traffic were quickly rendered obsolete. Inspired by the early success of private submarine investment in the transatlantic market, throngs of speculative investors pitched submarine cable build-out plans that ultimately resulted in more than $25 billion worth of new systems being deployed in less than four years. During that period, the price of international bandwidth had spiraled downward, driven by intense competition in many transoceanic markets and unprecedented advancements in dense wavelength division multiplexing (DWDM) technology. By 2002 the majority of the major international wholesale network operators had declared bankruptcy, and deployment of new submarine fiber optic systems came to a virtual standstill. Between 2003 and 2007, the submarine market struggled to reach levels of $1 billion in new investment annually. Major submarine cable plants were shuttered, and the industry saw its annual production capacity fall to approximately one-third of its all-time high of 200,000 kilometers. At the same time, the submarine cable industry’s fleet of installation and repair vessels shrunk in number as ships were converted for use in more profitable endeavors. Wholesale markets for submarine capacity on developed routes remained depressed, and even purchasers of distressed cable assets struggled to remain profitable despite costs bases that were a fraction of original construction outlays. By 2008, however, the industry appeared to have found a new balance focused on bringing connectivity to underserved routes and regions, with annual investment in new projects returning to normal historical levels and the emergence of an extremely robust market for system upgrades fueled by a shift to 40G and 100G transmission technology. 19
Figure 2: Deployment of New Submarine Fiber Optic Projects,
1987-2012
(Route Kilometers by Ready-for-Service Date)
250,000
225,000
200,000
(Route Kilometers)
175,000
150,000
125,000
100,000
75,000
50,000
25,000
0
1987
1988
1989
1990
1991
1992
1993
1994
1995
1996
1997
1998
1999
2000
2001
2002
2003
2004
2005
2006
2007
2008
2009
2010
2011
2012
4.2 2008 – 2012 Systems in Review
In the five years between 2008 and 2012, $10 billion worth of new
submarine fiber optic systems entered service, for an average of $2
billion and 53,000 kilometers per year, which is in line with overall
historical averages.
Geographically, $2.9 billion was invested in new systems in Sub-
Saharan Africa, including four new long-haul systems along the
continent’s western coast and three along its eastern coast. Four
new systems connected India and the Middle East to Europe at a
cost of $1.7 billion, and three new transpacific systems also entered
service at a cost of $1.7 billion. Collectively, more than $6 billion of
the period’s investment targeted the markets of China, India, and
South Africa – three of the five so-called “BRICS” markets.
20Figure 3: Investment in New Submarine Fiber Optic Projects by
Region, 2008-2012
Latin America North American
and Caribbean Regional
3% 3%
Pacific Islands
4%
Australia
4%
Africa
Europe and 29%
Mediterranean
10%
East Asia
12%
South Asia and
Middle East
Transpacific
18%
17%
4.3 Systems Investment in 2013 and Beyond
The analysis identified 177 new projects, with a total value of $28.5
billion, which are either under construction or proposed. Proposed
projects were each classified into one of three categories: “high
activity,” “medium activity,” and “low activity” based on various
criteria including supply contracts, funding, licenses, carrier
commitments, market opportunities, marine surveys, desktop
studies, and feasibility studies.
In the most immediate category, 15 new projects have been
identified that either entered service in early-2013 or are scheduled
for completion in 2013 (i.e., under construction or in advanced
stages of development), for a total value of $1.4 billion.
In addition, 24 “high-activity” projects have been identified, which
are considered to be credible projects in an advanced stage of
21development with a high probability of activation in 2013 or 2014.
The total value of these projects is $3.1 billion. Consequently, if
there are no major construction delays then an average of at least
$2 billion worth of new systems will enter service annually in 2013
and 2014.
A total of 95 projects were classified into the “medium-activity”
category, for $16.8 billion worth of proposed investment. Finally,
the “low-activity” category comprises 43 projects with a combined
value of $7.2 billion.
Figure 4: Projects with 2013 RFS Dates and Proposed Submarine
Fiber Optic Projects
($Billions)
$18
$16
$14
$12
$10
$8
$6
$4
$2
$0
Completed, Under High-Activity Medium-Activity Low-Activity
Construction, or
Highly Likely in 2013
Prior to the most recent round of undersea cable deployment,
Terabit Consulting forecasted that most undersea investment
would be directed toward two spheres: first, unconnected markets;
and second, the so-called “BICS” economies – i.e., each of the BRICS
economies with the exception of Russia (which, given its proximity
to European hubs and terrestrial connectivity, would require lower
levels of investment over the short-term). During the 2008-2012
timeframe, more than $6 billion or 60 percent of investment was
directed toward India, China, and South Africa. Not surprisingly,
the industry has now turned its focus to Brazil, with two systems
planned between Brazil and Europe, four between Brazil and the
22United States, and five between Brazil and Africa, for a total of $5.5
billion worth of proposed investment.
When credible proposed investment, i.e., those projects that can
be classified as either “high-activity” or “medium-activity,” is
classified according to geography, it becomes clear that submarine
investment is likely to be significantly more diversified among
different regions than it had been in the past. Credible proposed
investment targeting developing or unconnected markets accounts
for more than two-thirds of the total. At the same time, there
remains a reasonable amount of credible interest in traditional
transoceanic markets that have historically been the cornerstone of
the industry. Overall, future investment in new submarine systems
appears balanced and sustainable.
Figure 5: Credible (“High-Activity” and “Medium-Activity”)
Proposed Submarine Fiber Optic Projects by Region, 2013 and
Beyond
Europe and Pacific Islands
Mediterranean 2%
3%
Transatlantic
9% Latin America
20%
Africa
9%
Multi-
South Asia/ Continental
ME 10% (including Polar)
13%
Transpacific East Asia
11% Australia 12%
11%
235. Supplier Analysis
5.1 System Suppliers
The future landscape of submarine system suppliers is perhaps one
of the greatest question marks facing the industry. The industry’s
capital and technological requirements serve as a formidable barrier
to entry and have limited the number of suppliers that can viably
compete for turnkey system supply contracts.
There is no clear indication that the supply market for new systems
has become more competitive over time. Historically, the market
for new fiber optic submarine systems was fairly evenly divided
along geographical lines between three groups: the predecessors of
Alcatel-Lucent, the predecessors of TE SubCom, and the Japanese
supply community. The obstacles faced by the likes of KDD-SCS,
OCC, and Hitachi Cable had a negative impact on the Japanese
supply community, leading to a decline in its market share, although
NEC has recently gained strength particularly in the Asia-Pacific
region. Meanwhile, among the two other major suppliers, as TE
SubCom has remained relatively stable at approximately one-third
of the market for new systems, Alcatel-Lucent’s market share has
approached one-half.
Figure 6: Market Share for Supply of New Systems, 2003-2013
(Primary Contracts Only; Excluding Subcontracts)
Ericsson, 1% Others, 2%
Nexans, 1%
NSW, 2%
Huawei Marine,
2%
Fujitsu, 4%
NEC, 12% Alcatel-Lucent,
47%
TE SubCom, 30%
25Many industry observers were encouraged by the launch of Huawei Marine Networks, a joint venture between Huawei Technologies and Global Marine Systems, in 2008. The company’s initial entry into the market was aggressive, and it was accused of “buying market share” by submitting low-cost bids for new projects. Huawei’s development of repeater technology positioned it as a viable competitor against the established suppliers, but its dependence on others for the manufacture of fiber optic cable has proven to be a significant challenge. More recently, Huawei Marine Networks has been dealt a setback by the efforts of some American and Australian politicians to blacklist Huawei Technologies. The three wildcards in the submarine supply landscape are the future strategy of Huawei Marine Networks (including the possibility of partnering with Chinese cable manufacturers); the expected sale of Alcatel-Lucent’s submarine networks division and a realignment of the industry’s manufacturing assets; and the growth of equipment- only suppliers such as Ciena, Infinera, Mitsubishi, and Xtera, driven by 40G and 100G transmission technologies. 5.2 Upgrade Suppliers Capacity upgrades have become one of the most dynamic aspects of the submarine cable industry. Beginning in the late 1990’s few, if any, systems were equipped to their full design capacity at RFS; instead, owners consciously planned to install additional terminal equipment as market conditions dictated. Any optically amplified system can potentially be upgraded beyond its design capacity, and those installed from 1999 onwards are excellent candidates. Provision of terminal equipment for upgrades does not require investment in repeater design, cable manufacturing, or cableships, and this has resulted in many suppliers beyond those traditionally engaged in provision of submarine cable systems entering the market for terminal equipment upgrades. This dynamic may be uncomfortable for some suppliers, but has brought about striking benefits for system owners. The upgrade market will arguably be the most consistent source of growth and has been targeted by four equipment suppliers in addition to the traditional submarine system suppliers. 26
Table 2: Key Upgrade and Redeployment Projects for
Equipment Suppliers
Ciena Southern Cross Cable Network, TGN Atlantic, Japan-
US Cable Network, North Asian Loop, Australia-Japan
Cable, FLAG Europe-Asia, FLAG Atlantic-1, Latin
American Nautilus, Seacom
Infinera Pacific Crossing-1, North Asian Loop, Transatlantic
cable, MedNautilus, Kodiak-Kenai, Pacnet
Mitsubishi Asia-America Gateway, TAT-14, I-Me-We, EAC,
Japanese domestic
Xtera EAC/C2C, AC-1, Gulf Bridge International, GlobeNet,
Arcos, PAC, SHEFA-2, GOKI, Columbus-2, Columbus-3,
Gemini Bermuda, C-BUS, East-West Cable, Tamares
Cable
276. Ownership Analysis
6.1 Financing of Current Submarine Systems
Historically, 71 percent of submarine fiber optic cable investment
has been financed by telecommunications carriers on their own,
in small groups, or in large consortia. Largely due to the influx
of speculative investment during the dot-com bubble, projects led
by non-telecom, private investors have accounted for 22 percent
of investment. Supplier financing accounted for 5 percent, also
largely a legacy of dot-com era financing models.
Figure 7: Financing of New Submarine Fiber Optic Systems,
1987-2012
Government and
Supplier, 5%
Development Bank,
1%
Investor (Private,
Non-Telecom), 22%
Carrier-led and
Consortium, 71%
During the most recent five-year period from the beginning of 2008
to the end of 2012, carrier-led and consortium projects accounted for
80 percent of total investment, with investor-led projects accounting
for 14 percent and government- and multilateral development bank
(MDB)-financed projects accounting for 5 percent.
28Figure 8: Financing of New Submarine Fiber Optic Systems,
2008-2012
Government and
Other, 1%
Development Bank,
5%
Investor (Private,
Non-Telecom), 14%
Carrier-led and
Consortium, 80%
The analysis clearly indicates a shift toward a marketplace in which
the telecommunications operators undertake most investment in
new systems themselves. Opportunities for private, non-telecom
investors have decreased significantly while governments and
development banks have taken a significantly more active role.
Although much of the activity in the latter category has been
focused on less-developed markets, government financing has
recently been proposed for projects on more developed routes such
as the transatlantic.
297. Regional Market Analysis and Capacity Outlook 7.1 Transatlantic 7.1.1 Bandwidth and Capacity The transatlantic submarine cable market continues to confound market observers with its ongoing drought of investment. The route was the object of more than $10 billion of investment during the 15-year period following the advent of the first transoceanic fiber optic cable, TAT-8, in the late-1980s. More than $7 billion worth of new transatlantic systems entered service between 1998 and 2003, primarily seeking to capitalize on runaway Internet bandwidth demand between Europe and North America. Yet there has been no new direct transatlantic construction for more than ten years, and the traditional consortia of operators that once dominated transatlantic telecommunications have remained publicly silent since 2001. Two new investor-led projects in the North Atlantic, both with similar competitive strategies based on low latency, missed their planned 2012 ready-for-service dates, but in 2013 their promoters offered news that seemed to reveal divergent trajectories. One project, contracted to an American supplier, reported that it had gained a preliminary commitment from the United States government’s export credit agency, while the other project, contracted to a Chinese supplier, was forced to suspend all work amidst claims of “dangerous” anti- Chinese political sentiment and blacklisting efforts in the United States. Meanwhile, there has been increasing interest in direct transatlantic links between Europe and Latin America, driven by the growth of Brazilian bandwidth demand ahead of the 2014 FIFA World Cup and the 2016 Summer Olympics, as well as demand for connectivity among the research community (there have also been proposals for what would be the first transoceanic projects across the South Atlantic, connecting South America with Africa; those projects are described in the “Sub-Saharan Africa” section). There also remains a belief among some industry veterans that a consortium-led project may soon materialize in the Atlantic, perhaps proposing a “next-generation” twist to differentiate itself from the traditional TAT cables. 31
Table 3: Existing Transatlantic Cable Systems
RFS System Owner(s)
1999 Atlantic Crossing-1 (AC-1) Level 3
International consortium of
1999 Columbus-3
carriers
Yellow (Level-3)/Atlantic
2000 Level 3
Crossing-2 (AC-2)
International consortium of
2000 Atlantis-2
carriers
2001 FLAG Atlantic-1 (FA-1) Reliance Globalcom
Hibernia Networks (Columbia
2001 Hibernia Atlantic
Ventures Corp.)
International consortium of
2001 TAT-14
carriers
2001 TGN-Atlantic Tata Communications
C&W Worldwide (Vodafone) /
2003 Apollo
Alcatel-Lucent
Between 2002 and 2008, ten transatlantic submarine cables were
either entirely or partially removed from service, leaving nine
systems offering a total of 15 different cable paths between Europe
and the Americas. The seven lit DWDM systems between North
America and Europe are owned by six entities: Apollo SCS Ltd. (a
joint venture between Cable & Wireless Worldwide and Alcatel-
Lucent), Level 3 (formerly Global Crossing, which operates two
systems), Hibernia Networks (owned by Columbia Ventures
Corporation and Constellation Ventures Partners), Reliance
Globalcom, Tata Communications, and the TAT-14 consortium.
Consequently, the transatlantic market can be described as an
overwhelmingly “wholesale” market, where operators have opted
to lease capacity from network operators, as opposed to making
direct investment in their own capacity infrastructure.
32A number of events have brought about the commoditization
of bandwidth between most European and North American
endpoints. In the late-1990s, hundreds of fiber pairs were deployed
to metropolitan areas on both continents, making point-to-point
connectivity both economical and practical, and at the same time
retail markets were fully liberalized. Then, more importantly, in the
early-2000s the dot-com bubble burst drove many cable operators
into bankruptcy, allowing investors to acquire transoceanic
networks at pennies on the dollar and unleashing a downward
price spiral that saw erosion of up to 75 percent per year and the
“dumping” of bandwidth onto the market. In the same decade,
new industries emerged offering data center and content delivery
services that further streamlined international connectivity for
both operators and end-users. By the mid-2000s transatlantic
bandwidth had become extremely cheap (sometimes cheaper
than its construction cost) and end-to-end services between North
America and Europe were efficiently and competitively managed,
to the point where even small- and medium-sized enterprises could
be characterized as viable bandwidth clientele.
Figure 9: Total Activated Transatlantic Capacity, 2007-2012
25,000
20,000
15,000
Gbps
10,000
5,000
0
2007 2008 2009 2010 2011 2012
As of year-end 2012, lit transatlantic capacity was 19.8 Tbps. The
compound annual growth of lit transatlantic capacity was 27
percent over the preceding five years, although actual transatlantic
bandwidth demand growth has been slightly higher, at 30 percent.
33Determining the total design capacity of existing transatlantic systems is an imprecise task: although 40G and 100G upgrade technologies promise vast design capacity increases in theory, the practical implementation of the technology in ten- to fifteen-year old transoceanic systems, especially those which have undergone multiple repairs, has not shown uniform success. Nevertheless, at least five transatlantic systems claimed to be significantly or fully upgradeable to 40G, yielding a design capacity (based on field demonstrations) of at least 66.8 Tbps and as much as 100 Tbps, with even greater capacities theoretically possible with 100G. 7.1.2 New Systems The lack of new submarine deployment directly between Europe and the Americas within the last ten years would seem to make the market ripe for new investment, but the financing of new transatlantic systems has proven exceedingly difficult as continued price erosion, increasing upgradeability of existing systems, and the perceived maturity of demand have all combined to frighten away prospective sources of financing. Furthermore, veterans in the project finance sector remain haunted by the meltdown of the transatlantic bandwidth market in the early-2000s. Most proposed transatlantic projects propose some competitive advantage not available among existing systems. These include lower latencies targeting high-frequency trading (HFT) customers; access to energy-efficient data centers; and direct, cost-efficient connectivity on a historically underserved route (i.e., Europe-to- Latin America). Two privately-financed projects targeting the traditional North Atlantic route between Europe and North America were announced in September of 2010 and July of 2011, respectively: Hibernia Networks’ Project Express and Emerald Networks’ Emerald Express. Initially, both projects announced ready-for-service dates in 2012. Hibernia Atlantic selected the Anglo-Chinese joint venture Huawei Marine Networks to supply (and to potentially provide financing for) its new system while Emerald Networks chose the American supplier TE SubCom. Apart from marine survey activity and securing some of the required permits, there was little material progress announced by either of the two projects during most of 2012. 34
However, in January and February of 2013, important news about both projects began to emerge. Emerald Networks’ news was positive, as it indicated that it had received what it described as a “preliminary commitment” from the US government’s Export- Import Bank in the form of a “Preliminary Project Letter.” Hibernia Networks’ news, on the other hand, appeared dire. The company was reported to have “halted work with Huawei” on the Hibernia Express project due to security concerns expressed by the US government toward Chinese suppliers such as Huawei and ZTE. Hibernia Networks’ reported decision followed a 2012 investigation by the US House of Representatives’ Permanent Select Committee on Intelligence which the chairman of the committee, Republican Congressman Mike Rogers, summarized by saying that “If I were an American company today…and you are looking at Huawei, I would find another vendor if you care about your intellectual property, if you care about your consumers’ privacy, and you care about the national security of the United States of America.” Critics asserted that the 60-page report released by the Intelligence Committee contained no scientific or engineering evidence of security weaknesses unique to ZTE and Huawei, nor did it identify any attempts at espionage; instead, the report based its assertions on what it claimed was the failure of ZTE and Huawei to “provide clear answers to Committee questions…provide supporting documentation…or alleviate Committee concerns.” Critics also claimed that the committee’s actions, which benefitted American suppliers, could easily be construed as trade protectionism. For its part, the committee said that more detailed information could be found in the classified annex to the report, but “that information cannot be shared publicly without risking US national security.” Beyond the political intrigue surrounding the two North Atlantic projects, there remain fundamental concerns as to whether private investors can succeed in such a well-served market where bandwidth has effectively become a commodity. In fact, throughout 2012 it was rumored that both projects had been shelved. The projects’ initial focus on attracting high frequency trading (HFT) companies through latency savings of a few milliseconds was largely debunked as a major potential source of bandwidth demand, as questions also arose regarding the ability to simultaneously market low-latency bandwidth at a premium price to HFT and other mission-critical 35
clientele while still capturing traditional operator demand at
market prices.
Meanwhile, at least three other new systems would provide paths
between Europe and Latin America in an attempt to enhance
connectivity on a route which offers only one relatively low-
capacity alternative to interconnection in the United States (namely,
Atlantis-2).
The success of any of the proposed transatlantic projects will
depend on commitments or participation from tier-one carriers,
as privately- or alternatively-financed cable systems will find it
challenging to compete against future consortium-led endeavors.
Table 4: Planned Transatlantic Cable Systems
(Europe to the Americas)
System Owner(s)
Atlantic Cable System-Europe
Telebras
(ACSea-EUR)
Emerald Express Emerald Networks
Europe Link with Latin America
Research community
(ELLA)
Hibernia Networks (Columbia
Project Express
Ventures Corp.)
Transatlantic Consortium System International consortium of
/ TAT-15 carriers
WASACE North (WASACE Phase
WASACE Cable Company
III)
367.2 Transpacific
7.2.1 Bandwidth and Capacity
Investment in new transpacific systems has been more consistent
than in the Atlantic. New transpacific cables began entering into
service less than six years after completion of the last cable from
the “dot-com” investment boom. Furthermore, while Internet
bandwidth markets on both sides of the North Atlantic quickly
matured and settled into growth rates of less than 30 percent,
the overall growth of Asian bandwidth demand has been more
characteristic of emerging markets.
Table 5: Existing Transpacific Cable Systems
RFS System Owner(s)
2000 Pacific Crossing-1 (PC-1) NTT
International consortium of
2001 China-US Cable Network
carriers
International consortium of
2001 Japan-US Cable Network
carriers
2002 TGN-Pacific Tata Communications
International consortium of
2008 Trans Pacific Express (TPE)
carriers
Asia-America Gateway International consortium of
2010
(AAG) carriers
Pacnet / Google / Bharti /
2010 Unity / EAC Pacific Global Transit (Time dotCom) /
KDDI / Singtel
The transpacific market suffered a shock with the activation of
three new systems between 2008 and 2010. Each of the three new
systems targeted its own market segment: Trans Pacific Express
(TPE) catered to China’s transpacific demand; Asia-America
Gateway (AAG) was the first cable to connect North America
37directly to Southeast Asian markets; and Unity/EAC Pacific, led
by Pacnet and Google, positioned itself as a complement to data
center infrastructure in the United States and Japan. Between
2008 and 2010 the number of active transpacific systems increased
dramatically, from four to seven. Furthermore, the Unity/EAC
Pacific project, with more than two-thirds of its capacity controlled
by non-operators and wholesalers, opened up the Japan-US
wholesale market, which until then had been dominated by TGN
Pacific and Pacific Crossing-1. As a result, transpacific prices fell by
as much as 50 percent in one year.
As of year-end 2012, activated transpacific capacity was 15.2 Tbps.
Using 40G technology, and based on demonstrated upgradeability
in the field, the combined design capacity of transpacific systems
is at least 60 Tbps. Theoretical upgradeability based on the full
potential of 40G and 100G may ultimately reveal itself to be
significantly higher, but the length of transpacific spans is expected
to pose a significant obstacle to the maximum implementation of
wavelengths and higher line rates.
Figure 10: Total Activated Transpacific Capacity, 2007-2012
16,000
14,000
12,000
10,000
Gbps
8,000
6,000
4,000
2,000
0
2007 2008 2009 2010 2011 2012
In addition to strong bandwidth growth, the case for new
deployment in the transpacific is bolstered by the technical
challenges of implementing 40G and 100G upgrades on the route’s
existing submarine segments, some of which are among the longest
cable spans in the world. There is also greater geographical
segmentation in the transpacific market, with operators in
secondary Southeast Asian markets showing a sustained desire
38for additional transpacific connectivity that lands directly on their
shores. It should be noted, however, that prohibitive costs may
lead some Southeast Asian submarine projects to ultimately opt to
land in markets such as Guam, rather than constructing complete
transpacific spans.
Over the long term, the primary driver of transpacific and Asian
submarine markets will undoubtedly be the growth of Chinese
Internet and telecommunications markets. As of 2013, Chinese
international bandwidth exceeds 2 Tbps, with 52 percent directed
toward the United States. Although international bandwidth
demand from China still remains a distant second in the region,
behind Japan’s which is approximately 3 Tbps, the Chinese market
nevertheless shows the strongest prospects for growth in the
region, driven by its fixed broadband market which is expected
to exceed 200 million subscribers by 2014. The country’s fiber-to-
the-home market exceeds 25 million and more than 8 million fiber
kilometers have been deployed. China’s 12th Five-Year Plan calls
for broadband speeds to increase to 20 Mbps in urban areas and 4
Mbps in rural areas by 2015.
Figure 11: Chinese International Internet Bandwidth, 2003-2012
2,000
1,800
1,600
1,400
1,200
Gbps
1,000
800
600
400
200
0
2003 2004 2005 2006 2007 2008 2009 2010 2011 2012
7.2.2 New Systems
There have been few formal announcements of proposed
transpacific systems between Asia and North America.
39Table 6: Planned Transpacific Cable Systems
System Owner(s)
International consortium of
China-US-2
carriers
Serantau Cable System (Malaysia- Konsortium Rangkaian Serantau
US) Sdn Bhd
International consortium of
Southeast Asia-US
carriers
Trans Pacific Express (TPE) International consortium of
Expansion carriers
Given the tremendous costs involved in constructing a transpacific
cable system, the route has historically been a less attractive
market for investor-led projects, with operators taking the leading
role. It is expected that there will be a continuation of the trend of
comparatively smaller transpacific consortia, which during the last
round of transpacific deployment consisted of between six and 17
telecommunications and Internet companies.
For the foreseeable future, operators in China and Japan will likely
have the strongest influence on future deployment of submarine
cables in the North Pacific.
In China, China Telecom and China Unicom have respective shares
of 13 and 26 percent in the Trans Pacific Express (TPE) system, but it
is unclear how long these shares will accommodate each operator’s
demand, and both operators are believed to be seriously considering
options for additional capacity. China Mobile is also expected to
adopt a more aggressive stance with respect to transpacific capacity;
the operator has recently begun making investments in Asian
regional submarine capacity including the Southeast Asia-Japan
Cable (SJC) and Asia-Pacific Gateway (APG), and is constructing
its own Global Network Centre in Hong Kong to integrate its data
center services and submarine connectivity.
40Figure 12: Chinese Operators’ Share of China’s International
Internet Bandwidth, 2013
Research Networks
China Mobile 3%
11%
China Telecom
China Unicom 55%
31%
Japan’s 3 Tbps of bandwidth demand remains the largest in the
region and for the immediate future the transpacific bandwidth
demand of the country’s leading operators NTT and KDDI will
likely be accommodated by their investments in the PC-1 and
Unity systems, respectively. However, the country’s third major
operator, Softbank Telecom, is expected to emerge as an aggressive
investor in submarine bandwidth following its pending mid-2013
acquisition of 70 percent of Sprint Nextel. The acquisition will
give Softbank an expanded portfolio of lit submarine cable assets
in the Pacific, the Atlantic, and Latin America and is expected to
transform Softbank into the world’s third-largest mobile operator
by revenue, behind only China Telecom and Verizon.
Among the transpacific projects that have been announced to
the public, one of the most developed plans is for the Serantau
Cable System, which was proposed by the Konsortium Rangkaian
Serantau (KRS), a group of 24 Malaysian operators. The 18,500
kilometer system would connect Malaysia and the United States,
and would avoid two major submarine cable “choke points” in the
Luzon Strait and the waters off Singapore, which are vulnerable to
earthquakes and anchor damage, respectively. However, as of 2013
the Malaysian government’s financial support, which would likely
be a prerequisite in order to move forward, remains uncertain.
41Although there don’t yet appear to be any credible plans to develop transoceanic connectivity from Russia’s pacific coast, Terabit Consulting’s internal analysis has identified a relatively strong market opportunity for direct connectivity between the east coast of Russia and either Alaska, Canada, or the US West Coast. Over the longer term, Terabit Consulting also expects serious operator-led initiatives for single-cable transpacific connectivity between the United States and India, which would address some of the risk posed by concentration of India-bound cables through Egypt (the proposed BRICS cable would also do the same, albeit in the opposite direction). 42
7.3 North and South America
7.3.1 Bandwidth and Capacity
The North America-South America capacity market is heavily
dependent on three privately-owned geographic ring networks:
Oi’s GlobeNet, Telefonica’s SAM-1, and Level 3’s South American
Crossing (the latter connects to the mainland United States via
Level 3’s other Latin American cables, Mid-Atlantic Crossing and
Pan-American Crossing).
Americas-II is the only other existing link between the United States
and Brazil; it was constructed by a consortium of more than a dozen
operators in 2000 and has been upgraded to levels well beyond its
initially-stated design capacity, although its design capacity is still
estimated to be below those of the three geographic ring systems.
Connectivity to the northern and western coasts of the continent,
meanwhile, is provided by the consortium cables Maya-1 and Pan
American, as well as by Columbus Networks’ Arcos-1 and CFX-1
systems.
Table 7: Existing US-Brazil Cable Systems
RFS System Owner(s)
2000 Americas-II Consortium
2001 GlobeNet Oi
2001 SAM-1 Telefonica
2001 South American Crossing Level 3 (LANautilus (Telecom
(SAC) Italia) fiber pair)
As of year-end 2012, lit submarine cable capacity between North
America and South America was 6.3 Tbps. Growth in activated
submarine capacity has been extremely high, with a compound
annual growth rate of 54 percent over the last five years.
43Figure 13: Total Activated North America-South America
Capacity, 2007-2012
7,000
6,000
5,000
4,000
Gbps
3,000
2,000
1,000
0
2007 2008 2009 2010 2011 2012
The dynamics of the Latin American market are unique; the majority
of Internet demand is directed to North America (specifically
Miami), and bandwidth pricing remains among the highest of
any region, ranging from $25 per Mbps for volume IP transit in
Brazil to $80 per Mbps in Paraguay. Transport pricing on the North
America-South America route is as much as ten times higher than
transatlantic pricing. This is due in large part to the relatively
tight control over the marketplace exhibited by the three major
wholesalers (Level 3, Oi, and Telefonica), as well as unforeseen
bandwidth growth in the continent’s primary markets, combining
to create a “seller’s market.”
Growth in South American bandwidth demand, though strong
in almost all of the region’s markets, is driven by Brazil, which
accounts for half of the continent’s population but five-eighths of
its international bandwidth demand. Brazil’s economic growth has
been strong and more equitable than in other developing markets,
resulting in a larger addressable base for telecommunications
and Internet services, and the 2014 World Cup and 2016 Summer
Olympics are expected to result in even greater increases in
bandwidth demand. The country’s Plano Nacional de Banda Larga
(PNBL), administered by state-owned Telebras, aims to provide 1
Mbps high-speed Internet connections for US$18 per month and
has attracted commitments from most major operators.
44Figure 14: Share of South American International Bandwidth
Demand by Country, 2013
PeruVenezuelaOthers
3% 3%
2%
Ecuador
3%
Chile
5%
Colombia
9% Brazil
62%
Argentina
13%
7.3.2 New Systems
Future deployment of submarine connectivity to South America will
be driven in large part by the bandwidth requirements of Brazil’s
major operators. Three of Brazil’s four largest telecommunications
operators have ownership of significant (terabit-capable) submarine
cable assets. The notable exception is America Movil, which owns
the country’s Claro, Embratel, and Net brand names.
It is therefore unsurprising that the most advanced South American
submarine cable project in terms of development, according to
sources, is America Movil’s AMX-1 cable, which will connect Brazil,
Colombia, Puerto Rico, the Dominican Republic, the mainland United
States, Mexico, and Guatemala. The project’s supplier, Alcatel-
Lucent, asserts that the 17,500-kilometer cable will have a trunk
design capacity of more than 50 Tbps using 100 Gbps technology.
45You can also read


