INEQUALITY IN CHINA: A CASE STUDY - DR. SEN GONG ASSOCIATE PROFESSOR, BINGQIN LI RESEARCH DEPARTMENT OF SOCIAL DEVELOPMENT - SAVE THE ...
←
→
Page content transcription
If your browser does not render page correctly, please read the page content below
Inequality in China:
    a case study

               Dr. Sen GONG
  Research Department of Social Development

Development Research Centre of the State Council

                   P. R. China

     Associate Professor, Bingqin LI
        Crawford School of Public Policy

          Australian National University

                  January 2013
Acknowledgements
We would like to thank the two assistants on this project, Ms Lu YU from
China University of Political Science and Law and Sen CUI from Beijing
Normal University, who have conducted a literature review for the report
and have produced an excellent Chinese translation of the English report.
Many thanks to Mr. Yanfeng GE for his strong support. The authors are
most grateful for comments from Save the Children UK, including those of
Alex Cobham and particularly Jessica Espey. In fact, Jessica rewrote a great
number of paragraphs and and in doing so, she has added some insightful
views and valuable evidence. We very much appreciate Mr. Philip O’Keefe
and Mr. Dewen Wang’s input and the comments of Dr. Meixiang Zhou
from World Bank China Office. However, the authors themselves should
be held entirely responsible for all other errors in the report. It should also
be noted that the views expressed in this report do not represent the
views of the authors’ organisations.
Contents

List of abbreviations and acronyms                                              3
Introduction                                                                    5
China’s impressive progress in reducing poverty                                 6
     A remarkable decline in absolute poverty over the past 30 years            6
     From enabling participation to direct redistribution                       8
     Reducing poverty and addressing inequality are not the same                9
Rising inequalities in outcomes and opportunities                              10
     Income inequality                                                         10
		       Overall inequality                                                    10
		       Income inequality by types of employment and region                   11
		       Inequality in household expenditure and consumption                   12
     Asset inequality                                                          13
     Inequality in human capital                                               14
     Gender inequality                                                         14
     Multiple dimensions of inequalities                                       15
Impacts of inequalities on children’s well-being                               16
     Absolute poverty: closely linked to family size and income levels         16
     Nutrition and survival: closely linked to income levels                   17
	Education quality: increasingly linked to family background                   20
     Water, sanitation and medical services: closely linked to income levels   21
     Multiple deprivation and social exclusion: a focus on gender              21
     Multiple deprivation of children due to inherited factors                 22
Root causes of inequalities                                                    23
     Impacts of economic structures                                            23
     Impacts of economic policies                                              23
     Impacts of social policies                                                24
     Impacts of traditional ideas                                              25
Addressing inequalities in opportunities as well as outcomes                   26
     Progress made to date                                                     26
     Policy recommendations                                                    27
References                                                                     29

                                                                                    1
List of tables List of abbreviations
Table 1 Poverty and inequality in China 1981~2008 7
and acronyms
Table 2 Illiterate population aged 15 and over by gender, 2002~2011 15
Table 3 Average household size by income quintile, 2010 16 ACFTU All-China Federation of Trade Unions
Table 4 Anemia prevalence (%) in rural children under five, in months after birth 18
Table 5 Mortality rate of children under five by gender in surveillance areas (‰) 22 CFPS China Family Panel Studies
Table 6 Number of beds in health Institutions per 1,000 people,
by region (1990~2011) 25 CHIP Chinese Household Income Project
CHNS China Health and Nutrition Survey
List of figures
ECD early childhood development
MLD Mean Log Deviation index
Figure 1 Income growth by deciles, 2002~2007 (in RMB yuan) 10 PPP purchasing power parity
Figure 2 Global trends in per capita GDP growth and Gini coefficients,
1980s~early 2000s 11 RMB renminbi, currency of China (of which the primary unit is Yuan)
Figure 3 Per capita urban household disposable income and per capita rural
household net income (in RMB yuan) 12
Figure 4 Household consumption by rural and urban areas (in RMB yuan) 13
Figure 5 Percentage of underweight children under five,
rural and urban areas, 1990~2010 17
Figure 6 Stunting rate of children under five, rural and urban areas (%) 18
Figure 7 Under-five mortality rate (‰) 19
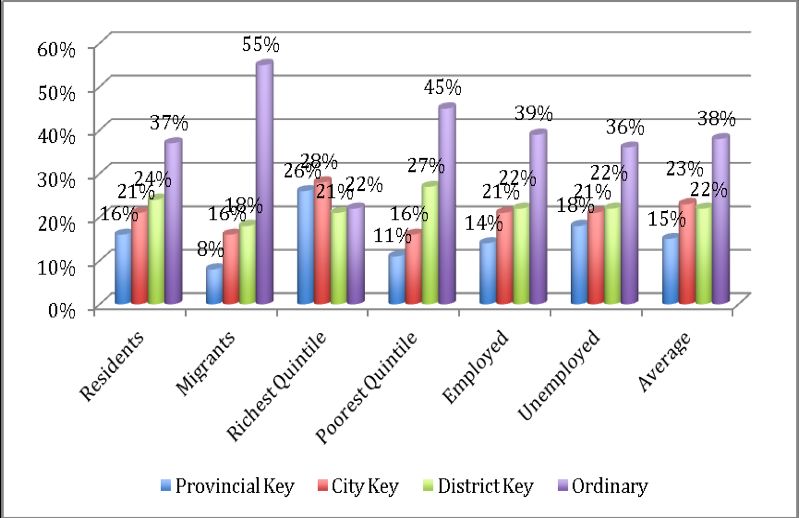
Figure 8 Type of school attended by students
from different family backgrounds 20
2 3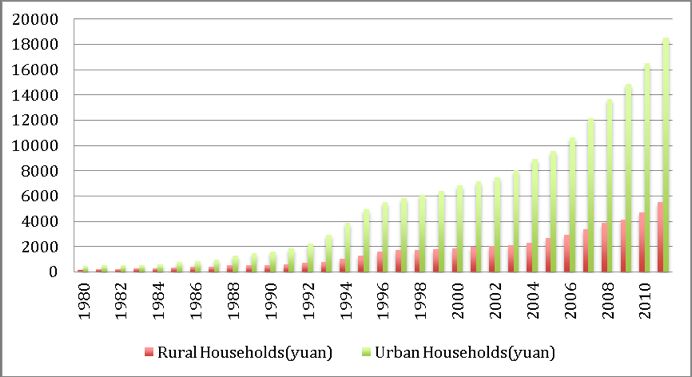
Introduction
    Over the past 30 years, China has substantially reduced the number of people living
    in absolute poverty. Moreover, during the past 10 years, the country has gradually
    introduced social protection measures that target the poor and aim to prevent those
    who have already escaped poverty from dropping below the poverty line in the future.
    However, over time rising inequalities in multiple forms have increasingly become a
    threat to social harmony, the prospect of further growth, and the well-being of future
    generations. As China embarks on another period of reform, it must narrow the gap
    in income and wealth to pave the way for sustainable economic growth and social
    development. This can only be done by addressing the root causes of inequality in
    opportunity and outcomes, such as market distortions, abuse of public resources or
    power, and unequal access to good-quality public services.

    The first section of the Report examines the Chinese approach to development over
    the past 30 years, at the beginning of which absolute poverty was very common. This
    report argues that both the results and the means of poverty alleviation in China are
    significant. The second section summarises the emerging issue of various inequalities in
    China, which include inequality in income, household expenditures, wealth and human
    capital, also by region and gender. The following two sections examine the impacts of
    various inequalities on the well-being of children, and the root causes of inequalities
    respectively. Whilst absolute poverty is still a big issue in China, particularly in remote
    areas, addressing inequality has gradually become a more important item on the national
    development agenda. China has made some progress in tackling the immediate causes
    for rising inequality. In the final section, this report suggests that China should expand
    the development strategy by addressing the root causes of unequal opportunity as well
    as unequal outcomes.

4                                                                                                 5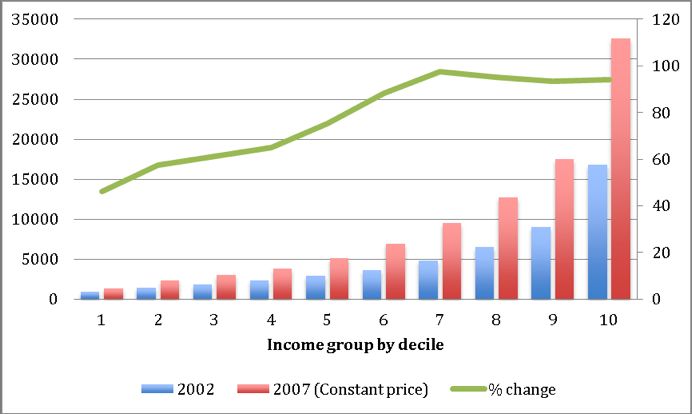
China’s impressive progress
Based on World Bank data on the poverty rate in China However, these 130 million poor people account for a
China’s impressive progress in reducing poverty
(see Table 1), more than 500 million Chinese people have sizeable proportion (about 10%) of the population; most
in reducing poverty
been lifted out of poverty over a period of 20 years. In 1990, of them live in remote or hard to reach areas, particularly
the Chinese population was 1.134 billion (NBS, 2011: Table in western China. Many more people are “almost poor” –
3-5), of which 60.18% lived below the international poverty that is, they live just above the poverty line and are
A remarkable decline in absolute line ($1.25 per day at 2005 prices, purchasing power parity vulnerable to risks and shocks that could push them back
poverty over the past 30 years (PPP)); that’s to say, there were about 700 million poor under it once again (World Bank, 2009: 23–29; World Bank
people in China. By 2011, however, the number of poor and Development Research Center, 2012).
Since the economic reforms launched in 1978, there has from 84.02% in 1981 to 13.06% in 2008. The poverty gap people had reduced to about 130 million. According to the
been a remarkable decline of absolute poverty in China also fell from 39.26% in 1981 to 3.24% in 2008. official income poverty line (equivalent to $1.8 per day),
(see Table 1). The poverty headcount ratio fell drastically there were 128 million poor people in rural areas and less
than 4 million poor people in urban areas.
Table 1 Poverty and inequality in China 1981~2005
Poverty line
Survey year ($1.25 a day, Headcount (%) Poverty gap (%) Watts index Gini index MLD index
PPP)
2008 38 13.06 3.24 -- 46.9 --
2005 38 16.25 4.03 0.05 42.48 0.3229
2002 38 28.36 8.66 0.1162 42.59 0.306
1999 38 35.63 11.09 0.1506 39.23 0.2543
1996 38 36.37 10.73 0.1435 35.7 0.2089
1993 38 53.69 17.65 0.2448 35.5 0.2058
1990 38 60.18 20.72 0.2893 32.43 0.171
1987 38 54.03 18.51 0.2649 29.85 0.1502
1984 38 69.43 25.56 0.3666 27.69 0.1263
1981 38 84.02 39.26 0.6073 29.11 0.1386
Note: PPP indicates that the poverty line used reflects ‘purchasing power parity’ dollars; that is, values have been adjusted to take account
of relative costs not only the formal exchange rate. The Watts index is a distribution-sensitive measure of poverty, reflecting both the share
of the population living in poverty and the extent to which the incomes of people in poverty fall beneath the poverty line (higher values
indicate worse poverty).The Gini index reflects inequality in the whole income distribution, taking a value of 1 for complete inequality and 0
for complete equality. In the table Gini values have been adjusted for the spatial cost of living differences. Like the Gini, the MLD (mean log
deviation) index takes a value of 0 when all individuals have the same income, and higher values indicate greater inequality.
Data source: PovcalNet, the online tool for poverty measurement developed by the Development Research Group of the World Bank, at
http://econ.worldbank.org/povcalnet.
6 7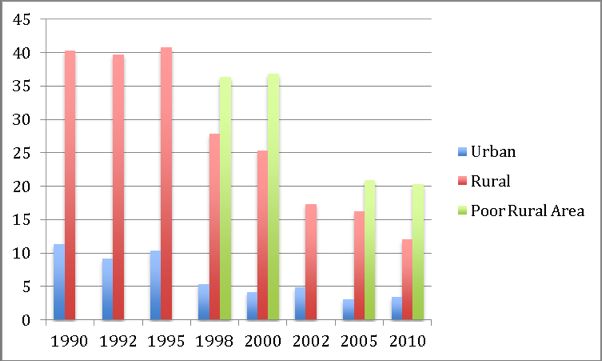
From enabling participation to                                                                                              Reducing poverty and
China’s impressive progress in reducing poverty

                                                                                                                                                                                                                                                                                                              China’s impressive progress in reducing poverty
                                                  direct redistribution                                                                                                       addressing inequality are not
                                                  In the early stage after China introduced the reform          labour mobility via the household registration system (or
                                                                                                                                                                              the same
                                                  and opening-up policy, the Chinese government put             hukou) was gradually loosened to allow rural labourers        Chinese experience suggests that rapid economic growth,           an approach towards poverty reduction as enabling people
                                                  greater emphasis on tackling widespread poverty than          to find jobs in urban areas (see box). In the early reform    combined with an incremental extension of social                  to find jobs.
                                                  on narrowing inequality. In fact, widening inequality was     years, the social safety net established during the central   protection system, has helped to lift vast numbers of
                                                  not considered to be a problem until the late 1990s           planning era, which relied heavily on employer provision      people out of poverty. At the same time, however, fast            Looking ahead, there will be increasing challenges in China
                                                  (Gong, 2003). Poverty alleviation strategies focused          in cities and cooperative provision in the countryside, was   economic growth does not benefit members in the society           to reduce the remaining chronic poverty in a changing
                                                  on creating jobs rather than providing social benefits.       weakened in China. For example, the rural cooperative         equally, even when it creates jobs. In fact, as we will examine   context of widening inequality. In other words, China
                                                  Most government funds for poverty alleviation were            pension system and healthcare basically collapsed. Urban      below, it has increased inequality in the short term. China’s     will face two problems in the new agenda of shared
                                                  directed to “work for relief” schemes to help improve         employers stopped providing some of the social services       experience suggests that post-market redistribution can           development. It will need to address not only the chronic
                                                  physical infrastructure and develop the human capital of      that they used to offer at “work units” (Li and Piachaud,     help improve the worst poverty, but it is not as effective        poverty problem but also the emerging inequality issue.
                                                  poor households. To encourage job-seeking, control of         2004).

                                                    The hukou system
                                                     Hukou, the household registration system, was              control population mobility, particularly movement
                                                     introduced in 1958 to divide the population into           between rural and urban areas. Restrictions on
                                                     rural (agricultural) and urban (non-agricultural)          migrant workers coming to cities to take up jobs
                                                     residents, as well as into local residents and migrants,   were lifted in the early 2000s. However, even today,
                                                     largely according to a person’s place of birth.            the rights to urban welfare and access to some
                                                                                                                services are still dependent on a person’s hukou
                                                     The hukou status of parents is usually transferred         status.
                                                     to their children. The purpose of this system was to

                                                  More recently, greater efforts have been made to              benefits; a subsidised social housing scheme offering
                                                  introduce various social benefit programmes, which            rent rates that undercut market prices for people
                                                  were particularly helpful for low income groups. For          temporarily in need (including migrant workers and new
                                                  the poorest urban populations, a Minimum Living               graduates); and a subsidised home ownership scheme
                                                  Standard Guarantee System was introduced in 2003,             for middle and lower-income groups. More recently, a
                                                  which was later extended to rural populations. In rural       social pension system was introduced for older people
                                                  areas, the Rural Cooperative Healthcare System, which         in rural and urban areas without employment.
                                                  had collapsed many years ago, was re-introduced in
                                                  2002 under a new name, the New Rural Cooperative              After ten years of major policy developments the
                                                  Medical Care System. The state has contributed money          current social protection system offers nine years of
                                                  to this new system as a form of redistribution and an         free compulsory education for all children, universal
                                                  incentive to increase uptake. In urban areas, a similar       coverage of basic healthcare and basic pensions, and
                                                  scheme was introduced in 2006 for local residents             a comprehensive social assistance system based on
                                                  without employment. In the education sector, free and         minimum living standard schemes. More than 70
                                                  compulsory education was re-introduced in cities and          million people have benefited from the social assistance
                                                  rural areas. In 2010, the Chinese government started to       system. Obviously, such a system is a basic protection
                                                  make further reforms to the social housing system: these      floor, which is particularly relevant for the poor.
                                                  included a low rental scheme for people on welfare

           8                                                                                                                                                                                                                                                                                                                    9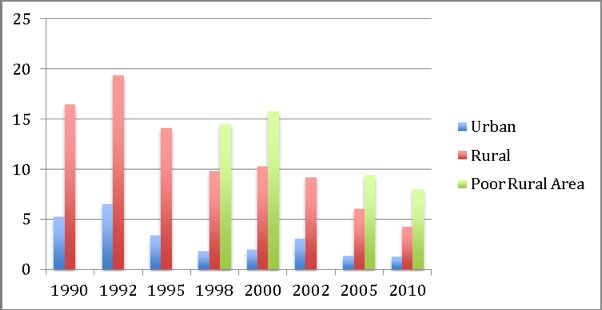
Rising inequalities
As a report from the World Bank and Development the rapid and continuing increase in inequality that China
Rising inequalities in outcomes and opportunities
Research Center (2012) points out, although income has witnessed since the mid-1980s. This sustained increase
in outcomes and
inequality in China is well below that in other developing in income inequality places China well above other Asian
countries (particularly in Latin America), few have seen countries (see Figure 2).
opportunities Figure 2 Global trends in per capita GDP growth and Gini coefficients, 1980s–early
2000s
Income inequality
China’s economic reforms have led to higher national people from higher income deciles than for those in BRA SAF
60
income. According to the World Development lower deciles (see Figure 1). Although the overall trend CHL
Gini coefficient of
NGA MEX ARG
Indicators published by the World Bank, gross domestic of growth has been contained since 2007, there has 50
inequality
PHL HKG
MYS
product (GDP) per capita increased from $524 in 1978 been little change in the pattern of inequality (Li, 2012). 40 CHN THA SGP GBR
USA
to $4,433 in 2010.1 Annual household expenditure was Social disparities are mirrored by large gaps between VNM
IDN KOR
30 RUS
ten times higher in 2011 ($932) than in 1978 ($90).2 the richest and poorest citizens, with mean incomes of IND
FRA
POL
But economic growth and income distribution are very the richest decile some 25 times higher than those of 20
ESP JPN
uneven, which has caused the greater in inequality. the poorest decile (Li, 2012). Furthermore, high-income 6.5 7.5 8.5 9.5 10.5
PPP per-capita GDP (constant 2000 PPP$): log scale
households are under-represented in the dataset,
Overall inequality and many sources of income may not be reported,
including those from bribery and corruption (Wang and
Li et al (2011b) suggest that the Gini index3 in China
Shi, 2010). It is estimated that the richest 10% of the Source: World Bank (2005), cited in World Bank and DRC (2012).
may have increased to 0.48 in 2007 from 0.35 in 1990.
population could be earning more than 50 times the
Income growth has, on average, increased faster for
average income of the lowest 10% (Wang, 2010).
Income inequality by types of employment and
region
Figure 1 Income growth by deciles, 2002–2007 (in RMB yuan) The income inequality is evident by types of employment. workers could be as high as 60 million, which accounts
35000 120 One of the most notable determinants is the type of for 20% of the urban labour force in China. Generally,
ownership of the company involved. As Yue et al (2010) such agencies have fewer responsibilities associated
30000 100 show, monopoly industries are dominated by state- with labour contracts and dispatched workers are often
25000 owned enterprises. As a result, employees in these paid less than contracted employees for the same work.
80 enterprises on the whole earn more than employees in When no longer needed, they are easily “returned” to
20000 other sectors. It is estimated that more than 50% of the the agency without severance pay. According to a pilot
60
wage gap between monopoly industries and competitive survey in one province, the average pay of contract
15000
industries is not justified, and can only be explained by workers is at least 30% more than that of dispatch
40
10000 the monopoly status or the state-dominated nature of workers.
20 these companies.
5000
Income inequality is also evident by geographical
0 0 Another determinant of income level is the nature of region. Rural-urban income differences and regional
1 2 3 4 5 6 7 8 9 10 the labour contract. There are two kinds of employee (inter-provincial) inequalities are together estimated
Income group by decile in many organisations and enterprises, in both the public to account for two-thirds of overall income inequality
and the private sectors. Contracted employees sign (Li, 2012). As shown in Figure 3, since the 1980s,
2002 2007 (Constant price) % change
contracts and work with the same employers; dispatched rural households have earned much less than urban
labourers sign contracts with an agency and are then households on average, and their incomes increase at a
Note: Includinges all provinces and autonomous regions covered by the Chinese Household Income Project (CHIP) surveys,
dispatched to organisations and enterprises who need much slower rate.
1
PPP (current US$)
workers. According to the All-China Federation of Trade
2
Constant 2000 US$. Unions (ACFTU, 2011), the total number of dispatched Growing urban-rural and regional inequality, however,
3
Due to data availability, this report mainly uses the index without adjustments for spatial cost of living differences.
10 11may have been contained or even reversed over the recently experienced a similar reverse in the general However, these high earners represent just a small services that used to be provided for free during the
Rising inequalities in outcomes and opportunities
Rising inequalities in outcomes and opportunities
past few years. According to data from the National trend. The unweighted Gini index for per capita GDP proportion of the population. The vast majority of planning era, such as housing, healthcare and education.
Bureau of Statistics (NBS, 2011:Table 10-2), the ratio per province at current prices had increased from 0.276 people, despite recent improvements in their living Thus, growing incomes do not mean that there is less
of per capita urban household disposable income to in 1990 to 0.357 in 2003, but has been decreasing, to standard, are still struggling to make ends meet (Atsmon pressure in covering living costs.
per capita rural household net income was 2.20 in 0.264 in 2010 – lower than that in the 1990s. Based on et al, 2012). People at middle income levels also face
1990, and had increased to 3.33 in 2009; however, it both per capita household consumption expenditures higher household expenditures. As shown in Figure 3 When the rural sector is included in the picture, the
has declined for two consecutive years since 2010. By and per capita household incomes among provinces, & 4, the average expenditure of a household increased gap in household consumption patterns is much bigger.
the end of 2011, it was 3.13 – close to the 2002 level. the changes in regional inequality are almost the same. faster than household income. This is partially because Figure 4 also shows the growing gap in rural and urban
As Li et al (2012) suggest, regional disparities have also consumer prices have increased rapidly. In addition, consumption over the past 30 years.
the average household now needs to spend on public
Figure 4 Household consumption by rural and urban areas (in RMB yuan)
Figure 3 Per capita urban household disposable income and per capita rural
household net income (in RMB yuan)
20000
25000 18000
16000
20000 14000
12000
15000 10000
8000
10000 6000
4000
5000 2000
0
0
2000
2008
2004
2006
2002
1988
1980
1984
1990
1986
1998
1994
1982
1992
1996
2010
2000
2008
2004
2006
2005
2009
2002
2003
2007
2001
1980
1990
1985
1998
1999
1994
1992
1996
1995
1997
1993
2010
1978
1991
Rural Households (yuan) Urban Households (yuan)
Urban households Rural households
Data Source: Table: “Household Consumption”, China Yearly Macro-Economics Statistics (National), China Data Online.
Data source: National Bureau of Statistics (2011) China Statistical Yearbook, Table 10-2.
Asset inequality
Inequality in household expenditure and Apart from income and consumption, asset inequality is China’s high-net-worth individuals lived in just five places:
also significant. According to Sato et al (2011), housing Guangdong, Shanghai, Beijing, Zhejiang and Jiangsu.
consumption
accounted for 60% of household wealth and for almost
Income inequality is also evident in household If we examine urban areas only, according to a McKinsey two-thirds of wealth inequality among households. Housing The inequality in household housing assets is partially a
expenditure. In the past few decades, but most notably report (Atsmon, et al., 2012) based on surveys with wealth among urban households increased from 4.5 times result of marketisation and uncontrolled speculation in the
in the past ten years, China has seen the emergence of 60,000 people in Chinese cities, 6% of the urban that of rural households in 2002 to 7.2 times just five years housing market in the past decade. As housing became
a growing high-income class with strong consumption population (14 million people) earned between $16,000 later. This gap is significantly wider than the urban–rural marketised in urban China, housing prices in many cities
power. According to the Chinese Family Dynamics and $34,000 (between RMB106,000 yuan and RMB income gap. Moreover, the 2011 China Private Wealth soared. The wealth level of urban households increased
report based on the China Family Panel Studies (CFPS) 229,000 yuan). The household income of 2% urban Study (China Merchants Bank-Bain & Company, 2011) found dramatically in contrast to the static housing sector in
survey in 2009, the average consumption of the highest people (4.24 million) exceeds $34,000. that the wealth of high-net-worth individuals accounted for rural areas. For those that are well off in this situation,
quintile was 15 times that of the lowest quintile (Liu and a greater share of the nation’s wealth, rising to 24% in 2010, rocketing house prices have become a valuable means of
Li, 2010: p18). up from 23% in 2008. Household wealth is also distributed wealth accumulation; but for others, it has made housing
unequally across the country. By 2010, more than 50% of unaffordable. State policies to prevent speculation on the
12 13housing market and to increase the supply of affordable indicators mentioned do not reveal the full picture of gaps Although women have received more education on illiterate population (more than 70%). Table 2 shows the
Rising inequalities in outcomes and opportunities
Rising inequalities in outcomes and opportunities
housing from 2010 may help to improve affordability. in the quality of education and the quality of healthcare. As average over the past 20 years and the female illiteracy gap in illiteracy rates by gender.
However, these policies have also faced strong criticism we shall discuss later, quality of essential services is closely rate is falling, women still constitute the majority of the
from local governments, developers and existing correlated with income levels and family backgrounds.
homeowners, as a greater supply of affordable housing is Table 2 Illiterate population aged 15 and over by gender, 2002–2011
considered to be unfriendly to the private housing market. Gender inequality
Gender structure of illiterate population Share of illiterate population in total population
Local governments were reluctant to allocate valuable aged 15 and above aged 15 and above
The nature of gender inequality in China has changed. Year
land to social housing for free, and private developers and
Three surveys on the situation of Chinese women carried total male female total male female
home-owners were unhappy to see house prices lowered.
out in 1990, 2000 and 2010 show that some traditional
2002 100 27.8 72.2 11.63 6.43 16.92
forms of inequality have disappeared, some persist, and
Inequality in human capital 2009 100 26.5 73.5 7.1 3.76 10.45
some new types of inequality have developed. Increasingly,
When considering inequalities based on years of education men are no longer the only decision-makers at home. 2011 100 26.5 73.5 5.21 2.73 7.77
and life expectancy, the gap by region has narrowed over Instead, aggregate data show that women’s influence in the
time. Unequal access to education is most notable between household and on the well-being of children has increased Data sources: National Population Sample Survey on Population Changes, cited in China Statistical Yearbook, related years.
rural and urban areas. On the whole, Liu and Li’s study significantly. However, their influence in the workplace and
(2010, p132), based on data from the China Health and in the political sphere has hardly increased. As discussed
Poor education, as discussed by Li (2012), has constrained standard. There is a consensus (Li, 2012; World Bank and
Nutrition Survey (CHNS), suggests that in 2009, people in Li (2012), women’s status at work is strongly correlated
women’s participation in the labour market. Although DRC, 2012) that while there may have been an evening
with rural household registration (hukou) received seven with their educational level, but this is not the case for men.
improving levels of education have enabled some out of income inequality in recent years, the trend
years of education, while the equivalent for people with Another persistent gender inequality can be seen from the
women to take up similar positions at work as men, they remains to be confirmed. Moreover, income inequality
urban household registration was 10.8 years. This gap is, widening gap in annual incomes over the past 20 years. The
often had to outperform men in terms of educational is exacerbated by growing disparities in both household
however, smaller for younger people (15~19, where the ratio of female earnings to male earnings in urban areas
achievement in order to get similar jobs. This also means asset and access to quality public services. Besides the
difference is 0.4 years) than for older people (for those has been decreasing rather than increasing: from 77.5% in
that women who are less educated are much more at risk regional dimensions, gender is still a very important
aged 20~29, the gap is 2.5 years; for those aged 30~39, 1990 to 70.1% in 1999 and 67.3% in 2010; it has also been
to unemployment. component of inequality in China. Generally, women are
it is 4.3 years; for those aged 40~49, 3.1 years; for those decreasing in rural areas, from 78.9% in 1990 to 59.6% in
more likely to participate in the low-skill labour market
aged 50~59, 3.2 years; and for those aged 60+, it is 4.5 1999 and 56.0% in 2010.
Multiple dimensions of inequalities and to live in poor households than men.
years). These differences by age group suggest an overall
improvement over time. However, the greater difference Another empirical study (Li et al, 2011a), based on urban The sustained increase in income gaps has transformed
for the 30~39 age group reflects the fact that they attended household survey data in 1995, 2002 and 2007, confirms China into a country of high income inequality by Asian
school in the 1980s to 1990s, a time when the education that the gender wage gap has been widening over time,
system was reformed and the opportunity costs for rural with the trend becoming stronger between 2002 and 2007.
people sending their children to school became higher, Between 1995 and 2002, less qualified and competitive
leading to higher drop-out rates. sectors saw the most rapid increase in the gender wage
gap; but between 2002 and 2007, even the sectors that are
As for life expectancy, the gap by province had also been less competitive and require higher qualifications also saw a
declining from 1990 to 2010. According to NBS (2012, rapidly growing gender wage gap.
Table 3-7), life expectancy from 1990 through 2000 to
2010 in Shanghai was consistently the highest, and in Tibet, The national surveys also highlight the emergence of new
the lowest. The gap between the two places, however, was types of inequalities in the reform years. First, women
declining, from 15.26 years in 1990 to 13.77 years in 2000 comprise the bulk of the workforce in the informal
and 12.09 years in 2010. Similarly, even though rural–urban sector and are therefore not easily covered by the social
income disparities continue to grow, disparities in selected protection system. Second, in cities, they suffered most
health indicators – particularly the maternal mortality ratio – as the state sector began to lay off workers (Ding et al,
have declined since the 1990s (NWCCW et al, 2010: 2009). Third, in the countryside, the agricultural workforce
Figure 2.13). is predominantly female, and men migrates to cities and
towns – so that many women have to take on more work
However, the trends in the selected education and health and responsibilities at home.
14 15Impacts of inequalities on Nutrition and survival: closely
Impacts of inequalities on children’s well-being
linked to income levels
children’s well-being Data from the China Health and Nutrition Survey
(CHNS) over the past three decades show that there
has been an overall improvement in child nutrition in
rate of underweight (low weight-for-age) children
under five was 13.7% in 1990, breaking down to 5.3%
in urban areas and 16.5% in rural areas. Between 1990
rural and urban areas from the early 1990s to the late and 2010, the prevalence of underweight children under-
There have also been some major changes in children’s population as a whole, children are likely to be poorer 2000s. However, the urban–rural gap persists, and rural five decreased significantly to 3.6% nationally, breaking
well-being in China over the past 20 years, particularly or living in poorer households. Combined with share of children are still more likely to be underweight and suffer down to 1.3% in urban areas and 4.3% in rural areas.
regarding levels of poverty, nutrition, survival and total population (10.6% for boys less than 16 and 9.2 from stunting and anemia. In poor rural areas, however, the rate was much higher
education. % for girls less than 16), we get that boys are a quarter than the rural average, at 8% in 2010 – almost twice the
more likely to be living in poverty , and the probability Figure 5 shows progress made in reducing the rate of rural average and six times the urban average (CHNS,
Absolute poverty: closely linked for girls rises to a third4. underweight children under five in urban and rural areas relevant years).
and the remaining gap between the two. The national
to family size and income levels
The rural–urban divide is once again clear if we look
According to the World Bank (2009: pp 62–64), the at child poverty. Table 3 shows the average household
proportion of children in the poorer population is higher size in urban and rural China. It shows the negative Figure 5 Percentage of underweight children under five
than that in the general population. As of 2003, among correlation between household income and household rural and urban areas, 1990~2010
boys less than 16 years old, 16.3% lived in poverty and size, and a higher average household size in rural areas
the proportion for girl was 17.3%. Among the poor, than in urban areas in all income groups. This means that 25
boys less than 16 accounted for 13.2%, and girls less child poverty is more prevalent in rural areas than in
than 16 accounted for 12.2%. Thus, compared with the cities.
20
Table 3 Average household size by income quintile, 2010
15 Urban
Urban household size Rural household size
Rural
Lowest quintile group 3.25 4.52 10
Poor Rural Area
Second quintile group 3.02 4.25
Third quintile group 2.82 4.00 5
Fourth quintile group 2.70 3.71
0
Highest quintile group 2.56 3.30
1990 1992 1995 1998 2000 2002 2005 2010
Source: National Bureau of Statistics (NBS) (2011) China Statistical Yearbook, 2011, Tables 10-7 and 10-23.
Data source: CHNS, relevant years.
The child poverty rate also varies by region. Lu and Wei such as Henan and Gansu, however, childhood poverty
(2002) reported that the average childhood poverty rate rates were as much as 2.5 times higher than the coastal
of coastal provinces was 2.45% in 1999, while rates in average. This is the consequence of the unbalanced Meanwhile, Figure 6 shows that the prevalence of In poor rural areas5, however, the prevalence of stunting
Beijing and Jiangsu were much lower. In interior provinces development levels between coastal and inland areas. stunting (low height-for-age) also decreased significantly, remains high, around 20.3% in 2010 – more than twice
from 33.1% in 1990 to 9.9% in 2010. Stunting among the national average and almost six times the urban
urban children decreased from 11.4% in 1990 to 3.4% average (CHNS 1991, 2011).
in 2010 and from 40.3% to 12.1% among rural children.
5
Poor rural areas refer to those nationally defined poor counties. There are nearly 600 poor counties in 2012 and the list changes as circumstances change.
4
The excess chance for boys living in poverty was 24.5% ((13.2-10.6)/10.6-1=24.5), and the corresponding chance for girls was 32.6% ((12.2-9.2)/9.2-1=32.6).
16 17The mortality rate for children under five, frequently a significant reduction in the infant mortality rate in all
Impacts of inequalities on children’s well-being
Impacts of inequalities on children’s well-being
Figure 6 Stunting rate of children under five, rural and urban areas (%) used as an indicator for child survival, has also decreased parts of China (Western, Middle and Eastern). However,
substantially in China over the past three decades serious inequalities remain: the under-five mortality rate
(see Figure 7). At the national level, the rate has fallen of the Western regions is 2.7 times higher than that of
45
dramatically from 61.0‰ in 1991 to 15.6‰ in 2011. In the Eastern regions in 2007, and compared with large
40 urban areas, it has fallen from 20.9‰ in 1991 to 7.1‰ cities, the rate was 5 times higher in poor rural counties
in 2011, while in rural areas it has fallen from 71.1‰ (UN, 2008).
35 to 19.1‰ over the same period. There has also been
30
Figure 7 Under-five mortality rate (‰)
25 Urban
80
20 Rural 71.1
Poor Rural Area 70 65.6
15 61.6
60 56.9
10 61
51.1 51.4
57.4 48.5 47.9 47.7
5 50 53.1 45.7
49.6 40.4 39.6
45 Total
0 40 44.5
42.3 42 41.4 33.4
1990 1992 1995 1998 2000 2002 2005 2010 39.7 Urban
35.9 34.9 28.5
30 25.7 Rural
23.6
Data source: CHNS, relevant years. 29.9 21.8 22.7 21.1
20.1 19.1
20 25
Similarly, Table 4 shows that anemia rates among children in poor rural areas remained high from 2005 to 2010, 20.9 20.7
22.5
20.6
especially for infants aged 0–12 months, with anaemia rates of over 40% in poor rural counties in 2009. 18.3 18
16.4 16.9 15.5 16.2 16.3
18.1 18.5 17.2
16.4 15.6
10 14.3 13.8 14.6 14.8
12
10.7 9.6
9 7.9 7.6 7.3 7.1
Table 4 Anemia prevalence (%) among rural children under five, in months after birth 0
Rural Poor rural
Months
2005 2008 2009 2010 2005 2008 2009 2010 Note: Under-five mortality rate refers to the number of children per 1,000 live births that die before reaching the age of
Note: Under-five mortality rate refers to the number of children per 1,000 live births that die before reaching the age of five
Data
five Source: World DataBank, 2012, Millennium Development Goals, http://databank.worldbank.org/Data/Views/VariableSelection/
0-5 31.4 31.6 28.6 20.8 40.3 30.1 41.2 21.6
SelectVariables.aspx?source=Millennium%20Development%20Goals#S_I
Data Source: World DataBank, 2012, Millennium Development Goals,
6-11 40.3 34 33.5 28.2 34.6 32.2 42.3 31.9
http://databank.worldbank.org/Data/Views/VariableSelection/SelectVariables.aspx?source=Millennium%20Development%20Go
12-23 26.9 24.7 22.8 20.5 25.7 22.1 32.1 20.5 we examine the relationship between under- progress according to economic as well as health
If als#S_I
five mortality rate by province-level administrative indicators between 1990 and 2008, such that the per
24-35 15.8 19.1 13.3 9 19.1 14.4 18.3 9.6 unit, there is a negative correlation with the level of capita GDP of the poorest provinces and regions in
If we examine the relationship between under-five mortality rate by province-level administrative unit, there is
36-48 13.6 11.4 10.3 7.2 14.6 11 14.6 7.6 economic development (NWCCW et al, 2010). With 2008 is close to that of the richest back in 1990. Similarly,
a negative correlation with the level of economic development (NWCCW et al, 2010). With a few exceptions,
a few exceptions, provinces with lower GDP per capita under-five mortality rates of the poorest provinces in
48-60 12 11.5 7.7 5.7 14 9.7 10.9 7.9 provinces
have a higherwith
childlower GDP rate,
mortality per capita have
and vice a higher
versa (Rudanchild2008
mortality rate, and
are similar vice versa
to those of the(Rudan et al,
wealthiest 2010). in
provinces
et Shanghai
al, 2010).and Beijing,and
Shanghai for instance, have
Beijing, for the highest
instance, have GDP per(NWCCW
1990 capita andettheal,lowest
2010),under-five
suggestingmortality
that there are
Total 21.1 19.8 16.7 13.3 21.6 19.9 22 14.2
therates.
highest GDP per capita and the lowest under-five considerable potentials for
However, China has made impressivegood progress according to economic as well as healththe poorest provinces and
mortality
indicatorsrates. However,
between 1990 China has made
and 2008, impressive
such that regions
the per capita GDPto of
make
the further
poorestimprovements.
provinces and regions in
Data source: CHNS.
2008 is close to that of the richest provinces back in 1990. Similarly, under-five mortality rates of the poorest
provinces in 2008 are similar to those of the wealthiest provinces in 1990 (NWCCW et al, 2010), suggesting
that there areis considerable potentials for the poorest provinces and regions to make further dramatic
improvements.
Education quality: increasingly linked to family background
18 19
Educational inequalities, particularly according to region, are evident in terms of access and quality. As QianEducation quality: increasingly Inequalities in educational attainment and school schools in rural areas suggests that the quality of water
Impacts of inequalities on children’s well-being
Impacts of inequalities on children’s well-being
linked to family background quality are reinforced by the household registration or and sanitation in different regions is closely linked to
Educational inequalities, particularly according to region, of students cannot complete their junior high schooling hukou system. This presents particular challenges for its economic development. In 2008, more than 16% of
are evident in terms of access and quality. As Qian and in poor rural areas. Besides the informal fee payment migrant workers and their families who have limited schools nationally were without a water supply system,
Smyth (2008) note, regional differences may vary by system in schools, the rapid increase in wages has also
access to social services outside their home province. two-thirds of schools lacked hand-washing facilities, and
education level. The higher the level of education, the tempted young people to drop out of school to work.
greater the degree of inequality. This is partly due to In terms of education quality, as Wang and Wu (2008) The resultant effect is that migrant families have to three-quarters of schools had no sanitation facilities.
the increasing cost of receiving more schooling. Also, argues, ordinary education in China has gradually pay prohibitive fees to give their children an education While in the Western region, the situation was even
there are large disparities in education funding, school changed from a meritocratic competition system to a in urban areas and even then, their children can only worse (more than a quarter of schools had no water
facilities, teacher qualifications and school achievements largely private competition system in which students’ attend regular schools, not higher quality ‘key schools’. supply system, three-quarters lacked hand-washing
across provinces and between rural and urban areas. level of achievement is determined by wealth, power
In higher education, children from rural backgrounds facilities and four-fifths had no sanitation) (CDC, 2010).
Qian and Smyth (2008) found that differences between and guanxi (private connections). Figure 8 shows the
coastal and inland provinces in educational attainment outcome in terms of unequal enrolment of students have been increasingly excluded from good quality There are also clear differences in the choice of healthcare
were not as large as inequalities within provinces, which from different family backgrounds. In urban areas, universities in China. While the proportion of college provider among the richest, poorest and middle quintiles
is an indicator of the strength of urban–rural disparities disparities between higher quality ‘key’ schools and lower students from rural areas has increased over the past 20 of the population (NWCCW et al, 2010). The richest
within an area. A survey in poor rural areas (Yi, et al., quality ‘ordinary’ schools are evident in the differential years, the rural–urban gap continues to exist. According quintile tends to favour provincial and city-level health
2012) found that the drop-out rates for grade 1, grade enrolment rates of local, migrant, and poorer children.
to the Department of Students at the Ministry of facilities, which offer the most comprehensive care. In
2 and grade 3 students in junior high schools were The increased importance of private connections and
5.7%, 9.0% and 10% respectively between September “selection fees” to get children into elite urban public Education (cited in Tian, 2011), the proportion of new China, community-level clinics offer cheaper and lower-
2009 and January 2010. That is to say, more than 25% schools reinforces existing social disparities. entrants from rural areas accounted for just over 40% quality healthcare. These services are more likely to be
of total new college enrolment in 1989, increasing to used by the poorest people than the middle or upper
Figure 8 Type of school attended by students from different family backgrounds more than 50% in 2005. However, the share of college income groups. Many people from the lowest quintile
entrants or students from rural areas in the top 100 cannot afford to use health services at all.
60%
universities has declined. Case studies in Beijing
55%
indicate that the current share of students from a rural Multiple deprivation and social
50%
45%
background in Tsinghua University decreased from exclusion: a focus on gender
21.7% in 1990 to 17.6% in 2000; in Peking University, it Different factors combine to cause multiple deprivations
39%
38%
40%
37%
fell from 18.8% in 1991 to 16.3% in 1999; and in Beijing
36%
for certain groups. Taking rural children, and rural girls
Normal University, it fell from 28% in 1990 to 22.3% in in particular as an example, the gender gap in schooling
28%
27%
years has decreased over time, but it still varies
30%
26%
23%
2002 (Sun, 2009; Pan, 2009). Outside Beijing, a survey
24%
22%
22%
considerably by area (rural versus urban). In terms of
22%
22%
21%
21%
21%
21%
in Hebei province in 2005 and case studies also show
18%
18%
years of schooling, there has been nearly no significant
20%
16%
16%
16%
the same trend (Tian, 2011).
14%
15%
gender discrimination against girls in urban areas,
11%
whereas girls in rural areas still face discrimination. This
8%
10%
Water, sanitation and medical is particularly the case for girls in remote and poor rural
areas (Zhang et al, 2012), where schools are more likely
services: closely linked to
to be closed for cost-saving purposes (Li and Piachaud,
0%
本地居民 外来务工人员 收入最高的20% 收入最低的20% 就业者 失业者 平均
income levels 2004). Moreover, rural children would be more likely to
go to ordinary schools and ordinary universities.
s
tsts
ile
e
ile
d
d
nt
There is still unequal access to safe water and sanitation,
ag
ye
anan
ye
t
t
e
uin
uin
er
plo
plo
igrgr
sid
省重点 市重点 区重点 普通
affecting children at home and at school too; access is
Av
tQ
MMi
tQ
As Cao et al (1997) argue, under-utilisation of health
Re
Em
em
correlated with income levels. In five selected provinces
es
es
services by the poor has contributed to the higher
Un
or
ch
for safe water projects, Shang and Wang (2011: p 218) mortality rate of children under five in poor areas.
Po
Ri
found that the proportion of children without safe water Moreover, there are also clear gender dynamics in
the choice of healthcare provider. Girls from poor
Provincial Key City Key District Key Ordinary in poor households was 33.47%, while the proportion in
households are much less likely to be taken to see a
non-poor households was 14.56%. A survey on water doctor when they become ill (see Table 5). Much
and sanitation conditions of primary and junior high depends on where a girl is born.
Data Source: The chart was originally produced by Wang and Wu (2008) and wascited by World Bank and DRC (2012).The authors of this
report has redrawn the chart.
20 21Table 5 Mortality rate of children under five by gender in surveillance areas(‰)
Root causes of inequalities
Impacts of inequalities on children’s well-being
All surveillance areas Poor surveillance areas
Male Female Male Female The inequalities discussed in this report can all be compensation land from rural areas, and low-price
traced to three dimensions of unbalanced growth: natural resources from Central and Western regions. In
1991 47.85 46.25 79.10 79.74 across regions, provinces and counties; across rural and these circumstances, industry is likely to replace labour
1992 42.96 42.11 78.96 81.29 urban areas; and across households, such that incomes with capital when labour costs increase, hence limiting
at the top of the distribution have grown faster than job creation and wage increases – thereby restricting
1993 40.86 41.35 75.95 85.70 those in the middle and/or bottom. In particular, one of the key pathways for the poorest households
income growth has tended to be highest for people to participate in economic growth and the creation of
1994 37.05 36.96 73.57 77.22
who have received the best education. However, on wealth.
1995 33.32 32.57 71.20 74.01 closer examination, the root causes of this unbalanced
growth lie in structural transformation associated with Second, the state-owned economy controls the lion’s
Data Source: National Surveillance Data, cited in Cao et al (1997). economic growth and policies as well as traditional or share of social surplus and savings, but profits are not
cultural factors. allocated adequately to public finance. Relative to the
Using surveillance data from 1997–2000 to analyse Women’s lack of education as well as primary private sector, state-owned enterprises consume a large
differences in the causes of death of children under five responsibility for household care and farm work can
in rural areas, Kang et al. (2002) found that when they also affect their ability to provide maternal care, with
Impacts of economic structures proportion of capital, raw materials and intermediate
inputs to produce relatively smaller shares of gross
examined the place of death, whether the child was sent negative consequences for their children’s health. Urban It is widely recognised (Yu and Chen, 2011: pp16- output and value added (World Bank and DRC, 2012: p
to hospital before death, and the level of diagnosis, there male migration has resulted in women having to take 17; World Bank and DRC, 2012: p 300; Li, 2012) that 25). Moreover, state-owned enterprises only submit 10%
were significant differences between boys and girls. up increasing responsibilities both at home and in their growing inequalities in income and consumption are of their profits on average to public finances.
Boys were more likely to die in hospital, more likely to fields, leaving them with much less time to look after partially attributed to the level of development or
be sent to hospital for treatment before they died, and and educate their children (Jia et al, 2010). In addition, “Kuznets effect” – the result of labour moving from the Third, the structure of government revenues, in particular
more likely to be treated within 24 hours. On average, there is some evidence that mothers under severe low productivity and labour-intensive agricultural sector tax incomes, is neither suitable for income redistribution
boys also received a higher level of treatment than girls. pressure are more prone to become bad tempered to the higher productivity and relatively more capital- nor does it incentivise labour. As Gao (2010) notes,
Boys’ deaths were more likely to be due to unavoidable and physically or verbally abuse their children. This can intensive manufacturing sector. around 70% of tax revenues in China come from indirect
causes such as cancers, whereas girls’ deaths were more enhance the children’s risk of depression (He et al, 2012). taxes (such as sales tax, value added tax and consumption
likely to be due to avoidable causes such as respiratory Interestingly, the same study also found that maternal Another factor behind the growing inequality in many tax), and employers pay more than 90% of tax revenues.
diseases. The findings showed that parents were more care or a lack thereof was correlated with literacy levels. developing economies is international competition or However, unlike income tax, these indirect taxes are
willing to treat boys when they became ill. As the study globalisation (OECD, 2011). At one extreme, China has regressive in nature. As a result, it is very difficult for
concluded, girls had more harsh survival conditions than Multiple deprivation of children begun to recruit top professionals from the international the government to use taxation to respond to income
boys in these rural areas, reflecting the joint effects of market on extremely high pay. However, rises in the
due to inherited factors inequality. Moreover, the World Bank and DRC (2012, pp
male preference and rural poverty. wages of low-skilled workers have been contained to 359–360) note that the “tax wedge”6 on labour is higher
As a chronic and remaining problem, poverty has a major ensure international competitiveness. in China than in most OECD countries.
Gender dynamics not only determine a girl’s healthy impact on access to essential services. As an emerging
development, but also determine the parental skills problem, inequality has much more influence on access Although important, economic structures alone cannot The individual income tax rate varies according to
of mothers, which in turn affects their children’s to social services of good quality. As a traditional problem, explain the growing inequality in China over the past 20 different sources of income and different tax systems,
development. For example, Mangyo (2008) used CHNS gender still has influence on multiple dimensions of child years; economic and social policies have also played an which makes it difficult to tell whether the overall effect is
data from 1989 to 1993 to analyse the impact of the wellbeing, in particular those children in poor regions and important role. progressive or regressive. And to date, China has neither
introduction of in-yard water facilities on child health. households. In a sense, the influence of gender depends
property tax nor taxation on capital gains. These factors
The study found that if the mother in a household was on the factor of poverty. Impacts of economic policies mean that the government has no effective policy tools
better educated with at least a secondary school degree, to reduce wealth inequality (Gao, 2010).
an in-yard water source would improve the children’s Many children are disadvantaged often before they’ve As Yu and Chen (2011) identified, four major economic
height and weight, but not body mass index (BMI). If the even been born. This is due to poverty, gender and policy factors have exacerbated inequality in China.
Fourth, as Yan and Cheng (2010) argue, the current
mother was not so well educated, however, providing inequality, things that they can have no power over. It is First, undervalued land and capital have limited job
system of intergovernmental transfer also reinforces
an in-yard water source did not improve these health necessary therefore to weaken the link between child creation. Labour has been placed in a disadvantaged
inequalities. From the beginning of the economic
indicators. This reflects strong gender inequalities in wellbeing and each of these three factors. position as a result of low-interest financial capital, low-
child health, compounded by the fact that rural women
are generally the least educated group in China.
6
The tax wedge is calculated as (total labour cost-net take home pay)/total labour cost.
22 23reform to 1994 when the taxation system was formally past failures to deal appropriately with the public goods where the lower levels of local government are expected serious financial and emotional stress for migrant families
Root causes of inequalities
Root causes of inequalities
decentralised, the Chinese taxation system was a fiscal nature of investments in human development. Market- to play a greater role in funding schools, there is greater and their children (An, et al., 2011).
contract responsibility system, which meant that the oriented reform, together with a deterioration of public inequality between these local regions. Also, under the
central government was responsible for approving ethics, public institutions, and public administration, has current inter-government fiscal system, large numbers of A similar story can be found in healthcare. At the end of
local budgets and local government were responsible resulted in significant leakages of public expenditure. rural schools were closed down in the early 2000s for 2011, there were 6.24 hospital beds per 1,000 people in
for its own revenues and spending. The problem with There is also a widespread lack of accountability on the purpose of enhancing educational efficiency, making cities compared with 2.80 beds per 1,000 people in rural
this system was that it quickly exposed the weakness the part of government over its duty to deliver public education much less accessible in remote rural areas. At areas. If we only examine health centres, in rural areas,
of unequal economic development between coastal and services. The marketisation of public hospitals is a good the same time, because educational resources are much there were only 1.16 beds per 1000 people for rural
inland regions. Inland regions could not obtain enough illustration of this. Since the late 1980s, public hospitals in more concentrated in urban schools, as some cities population in rural townships (see Table 6). Moreover,
revenues to fund the same level of services as their China have had full financial autonomy. The more profits open their schools to migrant workers’ children, many rural areas have a much lower population density and
coastal counterparts. individual hospitals make, the higher the bonus their migrant workers bring their children to cities. This is an less geographically concentrated services. As a result, it is
employees receive. Under such a performance-based improvement in the sense that migrants now don’t have much more difficult for a person from the countryside
In 1994, the tax sharing system was introduced. The pay system, public hospitals and doctors tend to provide to separate from their children. However, it also means to reach a hospital. This is particularly acute in remote
purpose was to overcome the problem of increased unnecessary services to patients. The marketisation that rural schools may attract even fewer students and rural areas. Apart from having fewer hospital beds
regional inequality. The central and local government reform in social services changed the original public thus less funding.This makes education for those children available, rural areas also suffer a shortage of qualified
would share tax revenues and responsibilities. Apart from service providers into private or semi-private institutions that are left behind even less accessible, and likely to professionals who tend to migrate to cities, often leaving
the local government’s revenues, which are collected that aim to maximise their profits. As a result, social deteriorate even further in quality. Moreover, the national rural hospitals with semi-qualified or even unqualified
and administered locally, the central government would services such as education and healthcare have become university exam system requires students to take the staff (Eggleston et al, 2008). As a result, when there is a
collect revenues from local governments and re-allocate less affordable, leaving large numbers of people either exam in their place of origin, and the content of exams serious illness, farmers have to travel long distances to
them according to different local needs. The aim was excluded from the system completely or receiving poor- varies by province. This means that individual students get the services needed or wait for doctors to come
to use central government funds to even out regional quality services. who migrate out of their home province have to return from the county hospital, often on an irregular basis (Pei
disparities. However, the baseline for taxation and the to their hometown to prepare for the exam. This causes and Bloom, 2011).
tax refund rate was set according to the pre-reform Second, some inequalities are the direct product of existing
taxation records, and consequently, those who had policies that institutionalise inequality of opportunity in
earnt more before were rewarded further. Moreover, essential services or fail to provide an effective framework Table 6 Number of beds in health Institutions per 1,000 people, by region (1990–2011)
the top-down allocation of earmarked grants in China for addressing inequalities.The former includes the hukou Beds of
is based on the principle of conditionality. The majority Beds of health institutions per 1,000 Beds of hospitals and health centres per
system, which reinforces disparities by imposing high township
population 1,000 population
of central government grants are provided on condition costs of education, healthcare, and housing for migrant health
Year centres per
that the local government provides matching funding. households in particular. Migrant workers are also less
National Urban Rural National Urban Rural 1,000 rural
Coastal areas have much more resources to meet able to access lucrative employment opportunities in population
these conditions or match government funding, whereas the public sector and state-owned enterprises, and face
poorer areas cannot generally afford to do so.This means greater challenges than local workers in assessing decent 1990 2.60 - - 2.32 4.18 1.55 0.81
richer areas receive even more grants from central work opportunities. The hukou system also comes into 2010 3.56 5.94 2.60 3.27 - - 1.12
government while poorer areas become even poorer play in the national social insurance system. Rural and
(Yan and Cheng, 2010). rural-to-urban migrant populations do not have the 2011 3.81 6.24 2.80 3.50 - - 1.16
same entitlement and access to urban social insurance
Data source: National Bureau of Statistics (NBS) China Health Statistical Yearbook 2012, Table 21-7; and China Health Statistical Yearbook 2006,
Impacts of social policies schemes as urban local residents. The differential
Table 3.4.
In theory, if citizens had access to affordable and decent treatment of rural to urban migrants via the hukou
quality social services and social protection, the impact system has been widely criticised, but its persistence
reflects the difficulties of reforming the system either
Impacts of traditional ideas
of income and wealth inequalities on the poor would
be less severe. However, the reality is that as the financially or in terms of meeting the particular needs From the ratio of boys to girls among newborn children further studies on the impact of the ‘one child’ policy on
marketisation reforms took place, income and wealth of a mobile population. Migrant workers cannot easily in 2010 (NBS, 2011), we can see the preference for boys schooling between boys and girls. Lee (2012) analysed
inequality widened, and accessibility and affordability of transfer their social insurance contributions to another in China, particularly in rural areas. In cities, the ratio was CHNS data and found that there was no evidence of
social services also deteriorated. Social services have city in a different province when they have to move (Li over 116. In small towns and rural villages, the ratio was unequal education outcomes in one-child households.
become increasingly fee-based, and many protections and Piachaud, 2006). over 120. However, in households with more than one child, girls
apply differently between rural and urban populations, were less well-educated than boys and were more likely
and between local and migrant populations. As the The inter-governmental fiscal system is another example One of the most important factors, if not the most to drop out of school.
World Bank and DRC (2012) observed, several social of a policy that fails to provide an effective framework for important factor, for the higher illiteracy rate among
policy factors have caused these unintended changes. addressing inequalities. As Zheng (2010) shows, as sub- women is that for many years, girls in rural areas were Recent years have also seen the return of the male
provincial governments continue to be decentralised, the given less priority in receiving education; even where girls breadwinner model. As surveyed by Zuo and Bian (2001),
First, some inequalities are the result of unintended fiscal capacity of provincial government is also weakened. were in school, if the family faced financial constraints, both men and women consider the male breadwinner
consequences of marketisation of essential services and For example, in the context of education provision, girls would be the first to be pulled out of school (Li and model to be fair as long as the men can supply the
Tsang, 2003; Klasen and Lamanna, 2009). There are also resources needed.
24 25You can also read