Influence Flowers of Academic Entities - Minjeong Shin, Alexander Soen, Benjamin T. Readshaw, Stephen M. Blackburn, Mitchell Whitelaw, Lexing Xie
←
→
Page content transcription
If your browser does not render page correctly, please read the page content below
Influence Flowers of Academic Entities
                                            Minjeong Shin, Alexander Soen, Benjamin T. Readshaw, Stephen M. Blackburn, Mitchell Whitelaw, Lexing Xie*
                                                                                                   Australian National University
arXiv:1907.12748v1 [cs.HC] 30 Jul 2019

                                               Figure 1: Venue-to-author Influence Flower of VAST (The IEEE Conference on Visual Analytics Science and Technology). The
                                               flower visualises 25 authors who have had the most citation influence to and from VAST. Blue edge width: normalised references to
                                               the author’s work by VAST papers; red edge width: normalised citations made by the author to VAST papers. Node colour (and
                                               sorting) reflect the ratio of references (more blue) to citations (more red); node sizes are scaled by the total amount of references
                                               and citations. The 24 authors with names in grey have published in VAST. The only exception is Alfred Inselberg, who is known and
                                               being cited for parallel coordinates.

                                         A BSTRACT                                                                   Index Terms: Human-centered computing – Visualization –
                                         We present the Influence Flower, a new visual metaphor for the              {Visualisation application domains – Visual analytics; Visualization
                                         influence profile of academic entities, including people, projects,         systems and tools; Empirical studies in visualization.}
                                         institutions, conferences, and journals. While many tools quantify
                                         influence, we aim to expose the flow of influence between entities.         1 I NTRODUCTION
                                         The Influence Flower is an ego-centric graph, with a query entity           Academic profiles of scientist and organisations are engaging for
                                         placed in the centre. The petals are styled to reflect the strength of      both the scientific community and the general public. They help
                                         influence to and from other entities of the same or different type.         us understand individual productivity and reputation, the collective
                                         For example, one can break down the incoming and outgoing influ-            knowledge-making process, and aid decision-making. The practice
                                         ences of a research lab by research topics. The Influence Flower            of such understanding is an active area of research [12]. One set
                                         uses a recent snapshot of Microsoft Academic Graph, consisting of           of open questions is the elusive notion of influence, such as: How
                                         212 million authors, their 176 million publications, and 1.2 billion        is a researcher or a research project influencing the world, what
                                         citations. An interactive web app, Influence Map, is constructed            ideas did it built on, and who is being influenced? What is the
                                         around this central metaphor for searching and curating visualisa-          influence footprint of an organisation, and how does it change since
                                         tions. We also propose a visual comparison method that highlights           the founding of a research institute or the inception a conference
                                         change in influence patterns over time. We demonstrate through              series? How does citation influence compare with influence and
                                         several case studies that the Influence Flower supports data-driven         impact in other means, such as academic genealogy, mentorship, or
                                         inquiries about the following: researchers’ careers over time; pa-          social media activities?
                                         per(s) and projects, including those with delayed recognition; the             The design of visual analytic tools for academic data has seen
                                         interdisciplinary profile of a research institution; and the shifting       much creative energy in recent years. This paper is motivated by
                                         topical trends in conferences. We also use this tool on influence data      three design considerations. The first is to focus singularly on in-
                                         beyond academic citations, by contrasting the academic and Twitter          fluence. Recent work has studied collaboration [23, 38, 43], popu-
                                         activities of a researcher.                                                 larity [26], and communities inferred from influence [31]; or can
                                                                                                                     be multi-focal which include collaborations, topics, and citation
                                             * e-mail:    {minjeong.shin, alexander.soen, benjamin.readshaw,         relationships [7, 11]. We choose to design a visualisation and in-
                                         steve.blackburn, mitchell.whitelaw, lexing.xie}@anu.edu.au                  teraction scheme tailored for understanding influence – rather than
                                                                                                                     splitting the visualisation to accommodate collaboration, popularity,
                                                                                                                     and/or communities additionally. The second is breadth versus depth.
                                                                                                                     Online search engines curate all academic data from the web [35]
                                                                                                                     and a number of research projects aim to provide a detailed view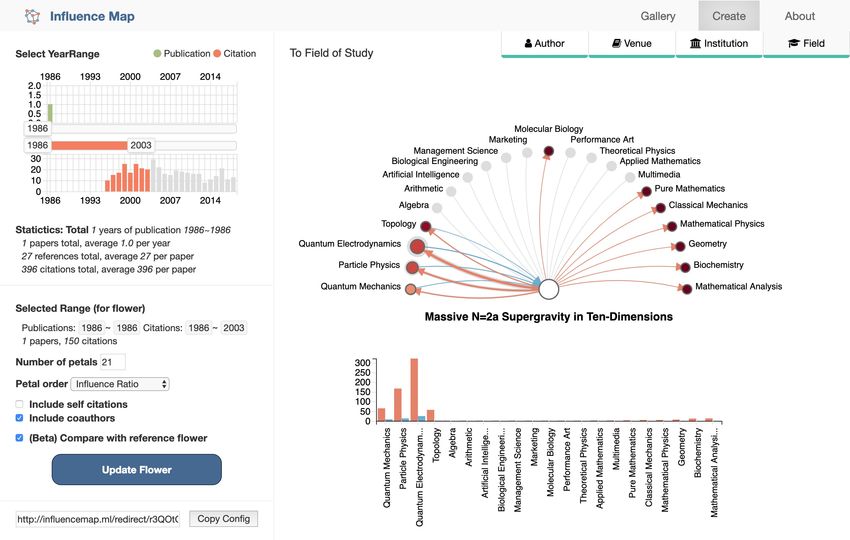
of a field [10, 26, 36]. Some approaches focus on a single types of        2   R ELATED W ORK
entities such as papers [36, 42], authors [28, 43], or keywords [26];
                                                                           This work builds on a rich literature on academic search engines,
while others customise the visualisation for multiple relations [10]
                                                                           bibliographic data visualisation, and studies on the science of sci-
or integrate with other modalities [25]. Here we choose to cover all
                                                                           ence.
scientific disciplines and aim for a consistent visualisation for all
entity types: from people, to institutions, to publication venues and      Academic search engines and libraries are modelled after web
research topics. The single focus on bi-directional influence allows       search engines or library catalogues. A paper and its content are
for breadth. The third consideration is expressiveness vs simplicity.      treated as the primary unit for indexing and searching. Some
This work aims to express enough details for users to engage in            search services provide entity profiles. For example, Microsoft
and understand instances of influence. We also choose to focus on          Academic [35], Scopus, and AMiner [38] contain profiles of authors,
a simple relation – the immediate source and target of influence,          affiliations, and/or research fields; and authors can enable and curate
rather than expanding influence (or collaboration) recursively into a      their own page on Google Scholar. Such profiles typically focus on
network, for which prior work exist [7, 11]. The rational for this is      three types of data: productivity – such as papers published over
that interpreting influence beyond the first hop is difficult for a lay    time, broken down by venue; collaboration – such as coauthor list
user and a network often increases the cognitive complexity for the        or networks; and influence – via proxies such as the total number of
users. The intention is not to create a metric or a set of metrics as      citations, often broken down over time. A few systems offer in-depth
there are many available [3, 4].                                           analysis by joining citations with other sources of data. Semantic
   We introduce the Influence Flower as a new visual metaphor for          Scholar builds influence scores by distinguishing important vs unim-
the bi-directional influence relations between entities (Sec. 4). The      portant citations [39]. Altmetric [22] combines citation metrics with
underlying flower theme is chosen as it has connotations of intel-         other online sources to derive a single influence score for each paper.
lectual growth and the flourishing of ideas over time. An Influence           To the best of our knowledge, most existing systems focus on
Flower is an ego-centric graph with the ego entity in the centre and       quantifying influence rather than exposing the flow of influence
alter nodes on a circular arc. The flower petals are formed by two         between entities of various types. Of particular relevance is Semantic
curved edges, whose thickness represent the strengths of influence         Scholar, where the author influence pane shows the top 5 influencers
in either direction. The size of alter nodes reflect the total volume      (Fig. 14 in the appendix). We feel that top five entities is a nice teaser
of influence and the colour of the alter nodes reflect the ratio of        but not an instrument for understanding influence. Furthermore,
incoming and outgoing influences. We quantify influence using              the presentation is a simple flow diagram, lacking a salient visual
citations as the basic unit and consider the act of referencing another    metaphor.
paper as a signal of incoming influence (to the ego). Similarly, being     Visualisation of bibliographic data has long fascinated visualisa-
cited by another paper signals outgoing influence (from the ego).          tion researchers as they are rich, multi-relational, and in a domain
Normalised citation count is computed using a recent snapshot of           that researchers can readily relate to.
Microsoft Academic Graph (Sec. 3) containing publication records              There are many engaging visualisations made by the InfoVis
since 1800s.                                                               community using the publications of InfoVis and HCI, such as the
   We further construct Influence Map1 , an interactive system,            PaperVis [8], PaperLens [26], PivotPaths [10], and CiteVis [36]
around the Influence Flower as the main visual element (Sec. 5). One       systems. All four systems contain an overview of papers and topics.
can search for any entity including authors, institutions, conferences,    Further, they either support users exploring topical trends [26], allow
journals, papers, or aggregate a set of entities to form a project or a    drilling down on paper-author-topic relations [10], or present the
group. Enabled by efficient indexing and caching in the back-end,          citation relationships between papers [8, 36]. These systems are
users can sort and filter with the Influence Flower. One can also          paper-centric and require a predefined community or domain to
compare snapshots of influence over time. An example Influence             start the overview and exploration. It can be hard to use such a
Flower is shown in Fig. 1 and an Influence Map snapshot is shown           methodology on a large scientific domain (e.g. astrophysics) which
in Fig. 6.                                                                 has too many papers to fit on a screen and papers scattered around a
   We demonstrate the use of the Influence Flower and Influence            large set of journals (from Nature, Science to Icarus and Astronomy
Map using a number of case studies (Sec. 6), including: visualis-          & Astrophysics).
ing a scientist’s career corroborated with biographic and interview           The network of coauthors and ego-centric views of one’s collab-
records; picturing the impact of a paper across disciplines (with          oration have also been a prevalent theme for visualisations. Such
delayed recognition); profiling the intellectual footprint of a research   systems are often designed with different emphases and goals, such
institution; mapping the topical trend changes in a conference; and        as quantifying the time and strength of mutual influence [29], pre-
using the Influence Flower metaphor on non-academic data, by com-          dicting researchers future activities [23], and depicting coauthorship
paring the Twitter and academic influence profiles of a well-known         with a subway map metaphor [44]. One particular foci of multiple
researcher.                                                                systems has been to track collaborations over time, such as the de-
   The main contributions of this work are:                                sign of egoSlider [43], EgoNetCloud [28], and 1.5D ego network
                                                                           visualisation [33]. For these systems, the notable limitations are
    • The Influence Flower, a new visual metaphor exposing the             that the ego networks are focusing on authors as the key entity. The
       influence between a wide range of academic entities.                corresponding visual metaphors do not readily generalise to other
   • The Influence Map system1 , available to the public, for cu-          academic entities.
     rating and interacting with influence flowers in any scientific          Besides the two topical clusters above, a diverse set of visual
     field.                                                                paradigms have been explored on academic data. Fung et al. [13]
   • Extensive case studies demonstrating data-driven inquires for         present a design study for the bibliographic record of a person,
     researchers, research projects, publication venues, organisa-         multiple attribute-mapping schemes which are applied to three vi-
     tions, and comparing academic influence to those in social            sualisations schemes: networks, trees, and matrices. Wu et al. [42]
     media.                                                                use the tree metaphor to represent a paper’s heritage and influence
                                                                           over time. Latif and Beck [25] present a text-centric summary of
                                                                           one’s scientific career, enriched by sparklines (inline mini figures),
   1 Code,  demo videos, and interactive figures are provided at           and side panels on collaborator networks and coauthored work. A
http://influencemap.ml/vast19                                              number of systems consist of multiple connected information-dense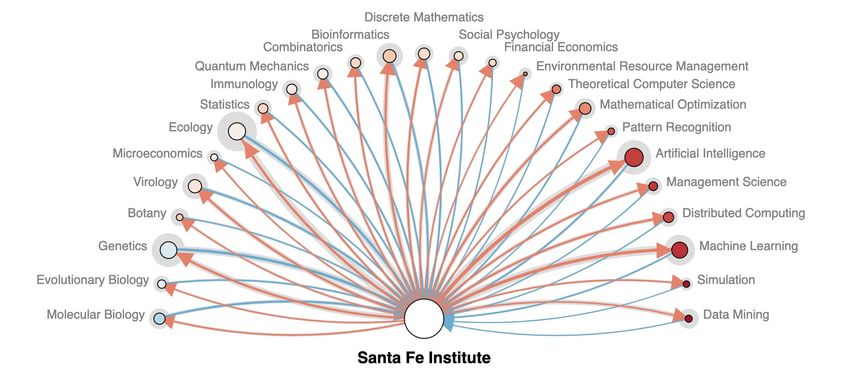
visualisations. PaperLens has different views on topics and trends in       includes 468 million paper-author relationships, 1.2 billion paper-to-
research fields [26]. CiteWiz [11] portrays a network of authors and        paper references, and 949 million paper-to-topic mappings. About
topics, along with glyphs for author influence over time. The CiteS-        70K papers are added to MAG daily [32], we plan to update the
pace system [6, 7] integrates a rich set of visualisations with network     Influence Map system with newer MAG data periodically.
analysis; driven by the goal of finding research fronts and emerging        A discussion on data coverage and quality. Results of large-scale
trends [7], and finding turning points using a co-citation network [6].     information extraction, entity resolution, and classification from
Two notable recent visualisation systems, egoSlider [43] and Im-            the web is not necessarily perfect (e.g., Appendix Fig. 16). We
pactVis [41], propose rich visualisations of collaboration and influ-       briefly review recent work that validate the coverage and accuracy
ence over time. Both systems treat time as an essential dimension,          of MAG, and present a few of our own observations. In addition,
either in the stream of collaborations [43], or as one dimension in the     our interactive system allows users to correct entity resolution errors
main influence matrix [41]. Influence Flower choose not to express          by merging MAG entity ids (Sec. 5.1).
time in the main visual metaphor, but offers it as a data filtering            Microsoft Academic has been compared to other popular biblio-
option instead (Sec. 5).                                                    graphical sources. On a sample of 145 academics across five disci-
The science of science [12] is an active research area that uses large      plines [14], MAG was found to have better coverage than Web of
data sets to study the mechanisms underlying the production of new          Science and Scopus, but less coverage in book chapters and miscel-
knowledge. In terms of identifying highly influential work, Sinatra         laneous publications (white papers, newletter articles) than Google
et al. [34] observed that the highest impact work in scientist’s career     Scholar. Another work builds on a verified publication list from an
are randomly distributed, and Wu et al. [42] found that the age of          entire university [17]. MAG was found to share the same bias as
related work and team size are correlated with producing disruptive         Scopus and Web of Science to cover less humanities, non-English,
work. Van Rann [40] identified papers with delayed recognition              and open-access publications.
as a common phenomena. Ke et al. [20] proposed methods to                      Microsoft Academic reports two versions of citations counts
systematically identify them from citation time series. Hoonlor             for each publication – a count of algorithmically verified citations,
et al. [16] mapped trends in computer science and quantified the            but also an estimated citation count. There are no ground truth
fraction of keywords in papers that trend before or after they do so        citation counts to compare with, however it has been observed that
in grant applications. Another line of inquiry examines scientists’         the verified citations tend to be lower than what Google Scholar
demographics and scientific achievements. Sugimoto et al. [37]              reports [14]. Sometimes inflated and deflated citation counts are
found a positive correlation between scholars’ scientific impact and        found in MAG due to document merging [18]. Furthermore, the
their mobility; Lariviere et al. [24] profiled gender disparities in        practice of preprinting has made accurately dating the publication
science; and King et al. [21] observed different citation practices         more difficult – although Google Scholar suffers from similar issues.
between men and women.                                                         We observe two phenomena in the computer science research
   In summary, this work contributes one central metaphor for vi-           community that may affect citation statistics. First, articles appear-
sualising the ego network of diverse types of entities. Our focus is        ing within a given venue (especially conferences) may be subject
on influence rather than collaboration. The goal is to broadly cover        to entirely different editorial processes. For example, a single con-
all academic fields. We aim to enable data-driven formulations and          ference proceedings may include full-length rigorously reviewed
answers to questions in science-of-science, using the ego-centric           articles, poster abstracts, demos, and panel sessions without meta-
Influence Flower metaphor and its supporting interactions.                  data identifying these distinctions. Fig. 15 in the appendix illustrates
                                                                            this using ACM SIGCHI as an example. This may dilute the appar-
3 DATASET                                                                   ent impact of a prestigious peer reviewed venue that also contain
We use the Microsoft Academic Graph (MAG) dataset to compute                large numbers of short, poorly cited ancillary articles such as de-
influence statistics. MAG is the data source behind Microsoft Aca-          mos and posters. Second, papers are sometimes published as a short
demic2 and is a large and openly available academic dataset covering        conference abstract and then later as a full paper, or sometimes simul-
all research fields. MAG is comprised of six types of academic enti-        taneously as conference and journal papers (e.g. VAST and TVCG).
ties and their relations [32]: paper, author, institution, venue (journal   This leads to ambiguity in resolving the publication venue of a paper,
and conference series), event (conference instance), and topic. En-         and will affect aggregated statistics. One strategy for addressing
tity types of paper, author, institution, journal, and conference are       this issue, used by a recent ranking system [2], is to query MAG
discovered from structured (e.g. publisher and knowledge base) and          with curated paper titles (e.g. from DBLP). They found that 97%
unstructured (e.g. web pages indexed by a search engine) sources.           of papers from 308 computer science venues have corresponding
MAG provides entity resolution such as merging records from dif-            entries in MAG.
ferent sources, de-duplication, and disambiguation.
    Microsoft Academic uses a large vocabulary of research top-             4     M EASURING   INTELLECTUAL INFLUENCE
ics [35], seeded by Wikipedia entries, to classify each of its papers.
These topics are mapped to papers using a machine learning algo-            We describe the composition and visual design of an Influence
rithm on paper information, such as title, abstract, and publishing         Flower, the approach for computing influence scores, and a pro-
venue. MAG includes 230K research topics organised into a six-              posed method to visually compare two flowers.
level hierarchical structure. Level 0 includes nineteen top-level           4.1    The Influence Flower
disciplines, such as physics and medicine. Topics are organised into
a directed acyclic graph. An example chain of parent-child relations        We use citations as a proxy for intellectual influence and adopt a
might be: computer science, algorithms, computational complexity            simple method to quantify it. If paper 1 cites paper 2, then paper
theory, NP-complete. Level 0 and level 1 concepts are manually              2 is considered to have influenced paper 1. Note the direction of
reviewed. In this study, we use 294 level 1 concepts to measure             influence is the opposite of the citation. Other data sources of
topical influence.                                                          influence exist, such as Altmetric [22], academic genealogy [27], or
    The current Influence Map system is based on a MAG data snap-           unstructured interviews (e.g. [1]). We leave incorporating other data
shot taken on 2018-06-29. It includes scientific papers published           sources of influence as future work.
from 1800 to 2018. The dataset has 176 million articles, 212 million           We design the Influence Flower, a new visual metaphor for pre-
authors, and 52 thousand journals and conference series. It also            senting aggregated influence around a given academic entity. Aca-
                                                                            demic entities could be a paper, a project, an author, an institution, a
   2 https://academic.microsoft.com                                         conference, a journal, or a topic. An academic entity is represented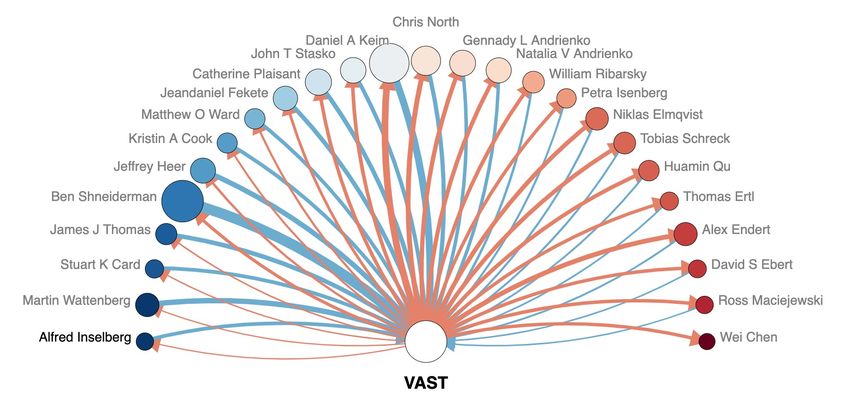
as a collection of papers in MAG. If it is an author, it is the collection
of papers that the author has authored. If it is a conference series, it
is the collection of published proceedings of the conference.
    The Influence Flower is an egocentric graph, with one node in
the centre (the ego), and other related nodes on the outside (the
alters). We define a node, either the ego or alter, as an academic                     (a)              (b)              (c)              (d)
entity. Edges in the flower indicate the influence relation between
the ego and the alters. The direction of an edge denotes the direction
                                                                             Figure 2: Alternatives designs for the influence flower and petals. (a)
of the influence. The curved edges between the ego and alters form           A full circle flower design. (b) Flower petals with arrows in the both
petals of the flower that blossoms when animated. We omit the edges          ends. (c) A wide band of flower petals. (d) Coloured flower petals.
between alters to preserve the visual layout of a flower. The flower is
designed to support visual inquiries (Sec. 6) about the relationships                                                          (a,a)
                                                                                A sorted and truncated set of scores in si· can be rendered as
between the ego and its alters, rather than the network around the           the red (outgoing) influence edges in an author-to-author Influence
ego.                                                                                                    (a,v)
    Other metaphors have been introduced to visualise academic               Flower (e.g. Fig. 8) and s· j would be blue edges in a venue-to-
entities. The closest to the current one is botanical trees [13, 42],        author Influence Flower (Fig. 1). Faster computation of influence
where tree height represents the time, and leaves and roots represent        scores are implemented using indexing techniques in Appendix A.
citations and references. Streams is another metaphor for tracking              A normalisation scheme for influence scores is crucial for its use
changes in collaboration over time [28, 33, 43, 44]. The key focus           and interpretation, especially since modern academic papers can
of the Influence Flower is on the aggregated strength of influence           have between one and thousands of authors, and cite between a
between entities, whereas trees and streams use time as a primary            handful to a few hundred other works. We normalise the influence
dimension. With the Influence Flower, temporal changes can be                score so that one citation has one unit of influence. Appendix B
captured by snapshots of the flower at different points in time, as we       discusses the normalisation method, several alternatives investigated
describe in Sec. 4.4.                                                        and a pilot validation.
                                                                             4.3 Visualising an Influence Flower
4.2 Computing influence scores
                                                                             An Influence Flower is laid out on a circle with the ego in the centre
To generate nodes and edges of an Influence Flower, we aggregate             and alters evenly distributed along the arc. We choose a circular
the pairwise influence of entities associated with the papers of the         design to make flower petals of the same length. Alternatives, such
ego. We regard as a unit of influence a citation made by a single            as placing alters in a horizontal line break the flower metaphor
paper and received by another, since this is the smallest unit reflected     and could mislead due to the different edge lengths. We decrease
in academic data.                                                            the angular span if the flower has less than 10 petals and linearly
   We denote E as the set of entities and P as the set of papers in          increase it if there are more than 25 petals. The maximum span
the dataset. We consider six entity types: author, venue, institution,       is 270 degrees, for a maximum number of 50 petals. The alters
topic, paper, and project. The association matrix A ∈ {0, 1}|E|×|P|          with the highest maximum of incoming and outgoing influence are
indicates the relations between entities and papers. The correspond-         selected. We sort the alters by the maximum of two influence instead
ing association matrices of author, venue, institution, and topic types      of the sum to avoid cases when one colour overwhelms another. The
                                                         (a)
are A(a) , A(v) , A(i) , A(t) . That is to say, element Ai j = 1 if and      default number of petals is 25. The selected petals are sorted by
only if paper j is authored by person i, 0 otherwise. Note that row          the influence ratio (blue to red colour) by default. The number and
         (a)                                                                 the ordering can be adjusted interactively (Sec. 5). The scale of the
vector ai· has value 1 for all papers authored by person i and col-          flower is adjusted according to the display size and the number of
              (t)
umn vector a· j has value 1 for all topics that paper j is relevant to       petals.
(see Sec. 3). Projects and ad-hoc paper collections are encoded as a         Edge appearance is determined by the influence score. The colour
vector of indicators, i.e. a one-hot vector for a paper and a multi-hot      and arrowhead of an edge indicate its direction. We assign two
vector for a project. For example, a(p) = [1, 0, . . . , 0, 1] refers to a   contrasting colours, red to denote the influence that the ego has
paper collection containing two papers, at the very beginning and            towards the alters and blue to represent the influence that the alters
end of the paper set, respectively.                                          have towards the ego. The weight of the edge wi j denotes the
   Citation matrix C ∈ {0, 1}|P|×|P| represents the citation relation        strength of influence from entity ei to e j . wi j is proportional to the
between papers. Ci j = 1, if pi influences p j (p j cites pi ), otherwise    normalised influence score S̄i j (Appendix B) and log-normalised for
0. Note that we do not compute the entire citation matrix C. The             visualisation.
index structure in Appendix A is used to obtain the relations between        Node colour and size are determined by the pair of edges connected
the ego entity and its references and citations, which are represented       to the node. The colour of a node signifies the difference in strength
by a column and a row of C.                                                  between incoming and outgoing influence. We define influence
   The total influence can be expressed as multiplication of these           ratio as the difference between the incoming and outgoing influ-
indicator matrices. To obtain influence scores between all entities of       ence, normalised by their sum. A blue (#053061) to red (#67001f)
type k and type l, where k, l ∈ {a, v, i, t}, we only need to compute:       interpolator, d3-scale-chromatic, is used to determine node colour
                                                                             according to the influence ratio. The ego node is white. The size
                          S(k,l) = A(k) CA(l)T                        (1)    of a node is proportional to the sum of influence. We scale the
                                                                             maximum node size according to the display size. The ego and
Hence, the influence score between author i and topic j is calculated        the biggest alter have the maximum size, while the other nodes are
     (a,t)  (a)    (t)T                                                      scaled accordingly.
as Si j = ai C a j .
                                                                             Alternative designs of the Influence Flower are shown in Fig. 2. A
   For example, the influence scores
                                   h from author ii to all authors           full circle flower (Fig. 2 (a)) allows a larger number of alters and
                            (a,a)     (a,a) (a,a)
is represented as a vector si· = Si0 , Si1 , . . . ; the influence           edges are less overlapped compare to a semicircle flower. However,
                                        (a,v)
                                               h
                                                  (a,v) (a,v)
                                                                 iT          the semicircle (or incomplete arc) reinforces the flower metaphor
vector from all authors to venues j is s· j = S0 j , S1 j , . . . .          as it has a sense of gravity where the ego at the bottom can be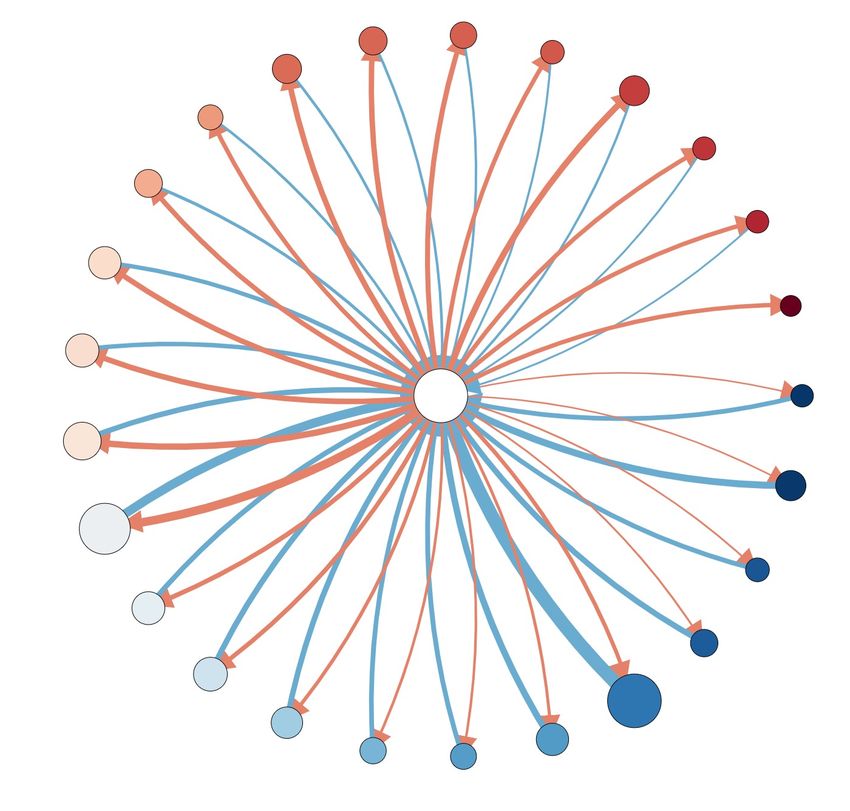
seen as a flower stem. Moreover, the left to right arrangement in
the semicircle makes it easy to understand the petal order. We
considered different shapes of flower petals (Fig. 2 (b), (c) and (d)).
Straight edges (b) are not preferred because they do not effectively
depict a flower and it is hard to discern the size of incoming and
outgoing influence. The earlier version of the influence flower had a
wider band of petals (c), but were changed to a narrower band for
better readability. We also considered using the colour of a filled
petal (d) to indicate influence ratio and radius to indicate influence
strength. It was not chosen since concurrently varying edge, fill,
and length makes interpretations harder and different petal lengths                                                      (1971~1999)

adversely impacts the label layout.
   In the current flower layout, displaying more than 50 petals is
difficult. One could potentially scale up the display using other
flower shapes, such as layered (e.g. roses) or with a geometric space
partition (e.g. pompom dahlias). Another direction for extending the
metaphor can be multiple flowers in a bouquet (e.g. corresponding
to a research group) or a garden (e.g. individuals in an institution),
where each flower can be examined in detail on demand.
Sorting and filtering provide various perspectives from which to
analyse Influence Flower. Four different sorting options, influence
ratio (node colour), influenced by (blue edges), influencing (red                                                        (2000~2009)
edges), and the total influence (node size) are provided for interaction
(Sec. 5.2). Each method changes the ordering of alters in a flower,
                                                                             Figure 3: Comparing author-to-author Influence Flower of Ben Shnei-
but it does not change the selection of the top alters.
                                                                             derman using publications and citations in three time periods. Top:
    We consider two filtering options: co-contributors and self-             1971 to 1999. Bottom: 2000 to 2009. Grey background: anchor flower
citations. The Influence Flower is able to capture less obvious              from 1971 to 2018. See Sec. 4.4 for discussions.
influence outside of one’s co-author networks with the filtering. We
define two entities to be co-contributors if the entities have con-          the contrast flower while keeping node order and position fixed by
tributed to the same paper. For the venue type entity, co-contribution       the anchor flower. Note that nodes in the contrast flower are a subset
indicates if the ego has published a paper to the venue. For the topic       of the nodes in the anchor. We stack two flowers to allow direct size
type entity, it means that the ego has written a paper of the topic.         comparison, unlike other studies [43, 44] arranging ego-graphs in
Co-contributors of the ego are indicated by nodes with greyed out            a sequence to represent temporal dynamics. Comparisons between
names. We define a self-citation between a paper and a cited paper           two different entities, two different types, or time periods which are
as a relation dependent on the ego. A paper citation is a self-citation      not subsets of one another is left as future work.
if both papers have the ego as an author (a venue, an institution, or a         Fig. 3 compares two snapshots of the author-to-author Influence
topic). Citations from co-authors are included by default, because           Flowers of Ben Shneiderman, the largest alter node in Fig. 1. The
the focus is the ego node and influencing co-authors (who likely             anchor flower is created using his career publications and citations
have a separate intellectual profile and affiliation) are an integral part   1971-2018, greyed out as a background. The top flower is created us-
of one’s influence profile.                                                  ing publications and citations from 1971 to 1999, the bottom flower
    Fig. 1 is an example venue-to-author Influence Flower of the IEEE        using those from 2000 to 2009. Catherine Plaisant is the largest
Conference on Visual Analytics Science and Technology (VAST).                alter in both flowers. For Shneiderman, Plaisant bore more outgoing
The ego of the flower, VAST, consists of papers published in this            influence before 2000 (red), the influence almost equalised in the
conference since its inception. The alter nodes of the flower are 25         2000s (white). One may also notice Niklas Elmqvist, whose mutual
authors with the highest combined incoming and outgoing influence,           influence with Shneiderman was non-existent before 1999, began
ordered by node colour. Ben Shneiderman is the most influential              in the 2000s and mostly happened after 2009. This is corroborated
author to VAST (rank 1 by blue edge score and combined score).               by career information obtained from Elmqvist’s homepage – that
Daniel A. Keim is the author most influenced by VAST (rank 1 by              his first paper was published after 1999, he started his faculty career
red edge score) and also the second most influential to VAST (rank           between 2000 and 2009 (2008), and he joined the University of
2 by blue edge). Most authors publish in VAST (name in grey font).           Maryland, where Shneiderman works, in 2014.
The exception is Alfred Inselberg, who is cited in VAST for his work
on parallel coordinates, and has been influenced by VAST papers.             5 T HE I NFLUENCE M AP S YSTEM
                                                                             The Influence Map system is built around the Influence Flower as the
4.4 Comparing Influence Flowers                                              central visual component and it contains three additional interactive
To compare multiple Influence Flowers generated at different time            components: searching and curating a flower, the flower visualisation
periods, we created the concept of an anchor flower. The anchor              module, and the details page. Fig. 4 presents the flow of the system.
flower is the reference against which an Influence Flower (the con-          Searching and curating entities is done by querying via Elasticsearch.
trast flower) is compared. The anchor and contrast flowers share the         All the scoring and data manipulation is done in Python 3 with the
same ego and alters in the same type. The time period of the anchor          pandas library. The web user interface is implemented with HTML
is always the superset of all contrast flowers – here the entire time        and JavaScript and styled using Bootstrap. We use D3.js [5] for
range of the ego is used. The anchor is greyed out in the background,        the visualisation of charts and flowers. In Sec. 5.1–Sec. 5.3, we
and a contrast flower is drawn in colour on top of the anchor flower.        explain each step of the workflow of the Influence Map system.
The anchor flower determines the overall node ordering, background           Appendix A describes indexing and caching strategies to scale the
size and position. The node size and edge weight in a contrast flower        Influence Flower to tens of thousands of citing papers.
is calculated by the relative influence score with the corresponding            Common entry points to a visual analytics system include brows-
node and edge in the anchor. The colour of the node is decided by            ing and search. Here we choose search as the main entry point.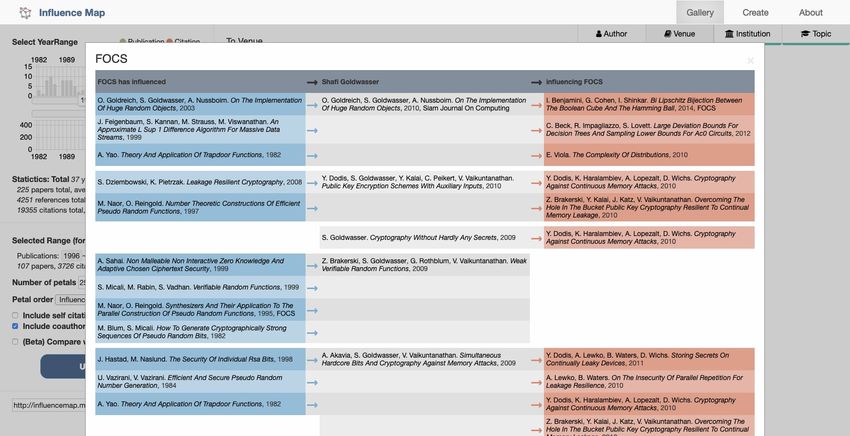
Entity Search Flower Page Detail Page 5.2 Interacting with the Influence Flower
Data
Preprocessing • Search academic • Calculate influence • Display underlying Fig. 6 shows the user interface of the Influence Flower page. The
entities score information
• Aggregate entities • Update influence
main interface consists of five components: a year range filter and
flower statistics panel, a fine-grained control panel, influence type tabs,
• Compare flowers
Database
the Influence Flower, and influence overview bars. The Influence
(§5.1, Fig.4) (§5.2, Fig.5) (§5.3, Fig.6)
Flower of the searched entity (Fig. 6 (d)) is located in the middle.
The influence type tabs (Fig. 6 (c)) switch from four different types
of flowers: author, venue, institution, and topic.
Figure 4: Overview of the Influence Map system summarising the The influence overview bars (Fig. 6 (e)) provide a complementary
main interactions in each component. Snapshots of the entity search way to understand influence. It presents the number of references and
page, the main flower page, and the detail page are in Fig. 5, Fig. 6, citations of the top 50 entities, sorted by the maximum of incoming
and Fig. 7, respectively. and outgoing influence. We choose alters based on the max rather
than total influence, because we would like to present a somewhat
balanced view of incoming and outgoing influence – total influence
is more likely to be dominated by one colour. The overview bars
show the coverage of the Influence Flower. The entities appeared in
the Influence Flower are drawn in colour, otherwise in grey. The total
number of entities is also presented. Each red and blue bar maps to
a corresponding red and blue edge in the Influence Flower. Mouse-
overing a node in the Influence Flower highlights the connecting
arrows and the corresponding location in the influence bar chart,
and vice versa. While the Influence Flower focuses on visualising
the relative differences between nodes and edges, the overview bar
chart helps users understand absolute values underlying the flower
metaphor. This also captures the maximum number of references
the ego made to the alters (and citations the ego received from the
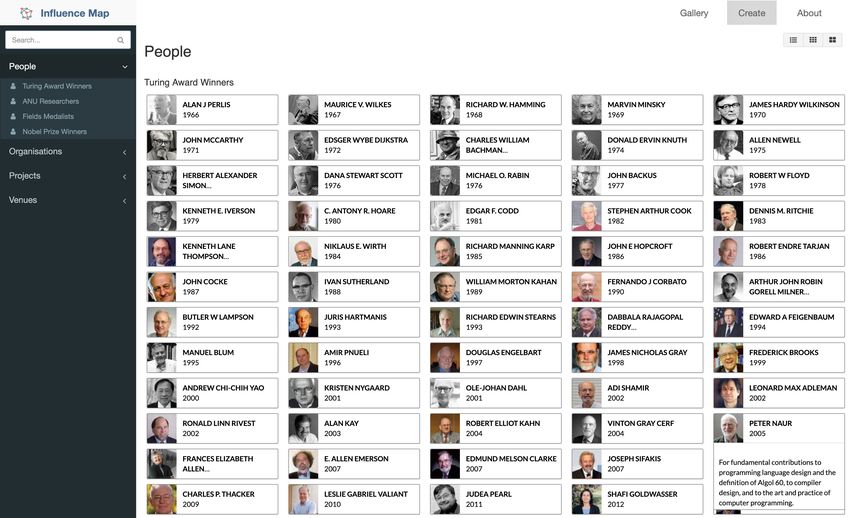
Figure 5: Search for the author name, John L. Hennessy. The number alters).
of papers, citations, and affiliation information help find the correct The default Influence Flower is created to cover the entire aca-
entities of interest. demic time span of the ego. We define the entire academic time
span as the period from the first publication record to the last ci-
On one hand, current-day users are accustomed to web search and tation record in the database. The number of petals by default is
scholar search; on the other, making an overview for hundreds of 25, and petals are sorted by influence ratio (blue to red colour) by
millions of entities is a design challenge on its own and lies beyond default. Users are able to change the time range and properties of
the scope of the current work. As an alternative entry point, we the Influence Flower via two filters on the left.
curate the Influence Map gallery with a set of authors, venues, and The year range filter (Fig. 6 (a)) enables filtering by time using
projects to help users’ initial engagement with the system without two bar charts: a publication chart (top, green) and a citation chart
the two-step search process. A screenshot of the gallery is shown in (bottom, orange) that share the same x-axis range. Each bar in
Appendix C. the publication chart indicates the number of papers that the ego
published in the given year. Similarly, bars in the citation chart
5.1 Searching for an academic entity indicate the number of citation that the ego received. The publication
Creating an Influence Flower starts with searching for names of range slider (green) under the publication chart allows users to select
academic entities, which may be one or more of authors, institutions, a specific publication time span of interest. The citation chart will be
conferences, journals, and papers. Elasticsearch supports full-text recalculated using the papers in the selected publication year range.
query and query results are sorted by their relevance score. The Users can further filter the received citations using the citation range
full-text query is especially useful for searching close variants of slider (orange) to specify the time span in which papers are cited.
author names, which may be abbreviated or missing middle initials. The statistics panel below the year range filter presents an overall
Furthermore, we modify the relevance score to favour entities with summary, showing the average and total number of papers, of the
higher citation counts. Appendix D discusses the modified scoring references and citations generated in the entire academic career of
function. the ego.
Fig. 5 shows the user interface of the search page. The search The fine-grain control panel (Fig. 6 (b)) presents the properties
page consists of three components: a search bar (top), a result table required to create or update an Influence Flower. First, it shows
(left), and a curation list (right). Using the search bar, users first the number of papers and citations selected from the year range
select the type(s) of an entity to search by name. Then the search filter. The system then provides five options to alter the flower:
result appears in the result table. The number of papers and citation the number and sorting order of petals, options to toggle inclusion
information is provided for each entity. We additionally provide of self-citations and co-contributors, and an option to compare the
affiliation information for searching authors and author information flower with the anchor flower. Pressing the ‘update flower’ button
for searching papers to reduce ambiguity. The checkbox on the will create the new flower. The system initially shows the flower
right-hand side of a row in the results is used to add the entity to with the entire year range and default options. Note that the ‘copy
the curation list. Selected entities can be removed by un-ticking config’ button on the bottom left of the page provides a link with the
the checkbox or clicking on the selection on the curation list. The current flower configuration for sharing and later access.
system allows aggregation of multiple entities of different types,
which can be used for selecting multiple entity ids with the same 5.3 Details behind an edge
name: creating a project flower by selecting multiple papers or To understand what constitutes the influence in the flower, the system
authors, or creating a flower with the sum of related conferences and can show the underlying paper information. For example, Fig. 7
journals. Users are able to rename the flower of aggregated entities. presents the details page when clicking the FOCS (IEEE Symposium
Finally, the ’go’ button on the bottom leads to the Influence Flower on Foundations of Computer Science) in the author-to-venue flower
page for the curated entity list. of Shafi Goldwasser Fig. 6(c). The left (blue) column lists the papers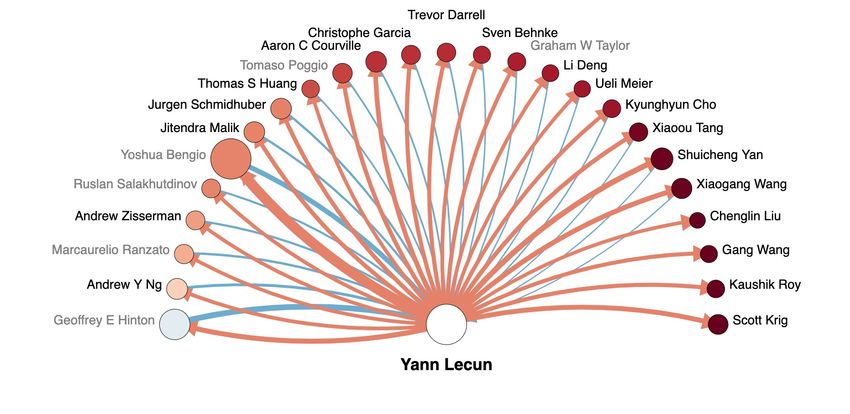
(a)                                                                                              (c)

(b)

                                                                                           (d)

                                                                                           (e)

Figure 6: Snapshot of the Influence Map system containing an author-to-venue Influence Flower. The ego entity is Shafi Goldwasser, 2012
Turing Awardee for foundational work on modern cryptography. The alter nodes are publication venues, with conferences shown as acronyms
and journals as full names. The system consists of (a) year range filter and statistical summary, (b) fine-grained control, (c) influence type tabs,
(d) Influence Flower, and (e) influence overview bars. See Sec. 5 for a description of system components and Sec. 6.1 for a discussion on
Goldwasser’s influence profile.

Figure 7: Detail page showing the underlying influence between
FOCS (Symposium on Foundations of Computer Science) and Shafi
                                                                             Figure 8: Author-to-author Influence Flower over Shafi Goldwasser’s
Goldwasser, generated by clicking the FOCS node in the Influence
                                                                             career 1982 – 2017. See Sec. 6.1 for discussions.
Flower Fig. 6(c). The blue and red columns present FOCS papers that
have influenced and have been influenced by Goldwasser. Arrows
indicate the direction of influence. The entries are chronologically
                                                                             6.1 Influence Flower and a career trajectory
ordered by the ego’s own papers (grey column, middle).                       We examine the Influence Flowers (Fig. 6 and 8) of Shafi Goldwasser,
                                                                             who laid the foundations for modern cryptography (with Silvio
                                                                             Micali), and was recognised with a Turing Award in 2012. We
of the alter node (FOCS) that have influenced the ego, Goldwasser.
                                                                             compare the people and publication venues in her Influence Flower
The middle column shows the papers of the ego. Finally, the last
                                                                             with those present in her publication profile and mentioned in her
column lists the papers in FOCS and that are influenced by papers
                                                                             interview transcripts [1], finding a few notable correspondences.
written by the ego. The blue and red arrows represent the flow of
                                                                                We discuss three notable researchers in Goldwasser’s author In-
influence between the pairs of papers. The blue (red) arrows in the
                                                                             fluence Flower (Fig. 8). Manuel Blum was the PhD advisor for both
table combine to correspond to the blue (red) edge between two
                                                                             Goldwasser and Micali, and his course on computational number
entities in the flower.
                                                                             theory was described by Goldwasser as “a turning point” [1]. In
                                                                             the flower, Blum’s influence on Goldwasser is larger than that of
6 C ASE STUDIES                                                              Goldwasser to Blum. Silvio Micali has been Goldwasser’s long term
Having described the design of the Influence Flower metaphor and             collaborator from both being graduate students at UC Berkeley to
the system for searching and interacting with the flower, we present         faculty members at MIT. Between Micali and Goldwasser, the ratio
five case studies for using Influence Map: (1) the career of a re-           of influences in the flower is close to one (off-white node color).
searcher; (2) an example of delayed impact; (3) the intellectual             Amit Sahai is one of Goldwasser’s PhD advisees, his node is a light
heritage of a lab; (4) the evolution of a research community, and (5)        shade of red, indicating that Goldwasser has had more influence
using Influence Flowers beyond the academic context.                         on him than the other way round. In Goldwasser’s author-to-venue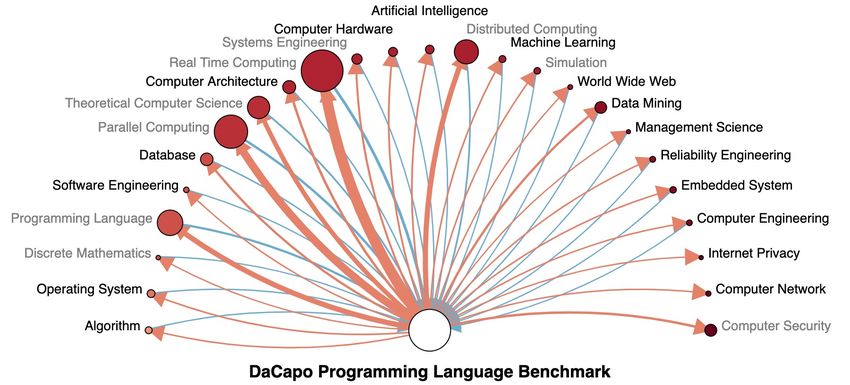
6.3 Interdisciplinary work of a research institute
                                                                              We examine the Santa Fe Institute, an independent nonprofit research
                                                                              and education centre, in its first 20 years. The institute led the devel-
                                                                              opment of the field of complexity science – the inquiry for common
                                                                              mechanisms that lead to complexity in various theoretic and real
                                                                              world systems. In computer science, Santa Fe researchers are known
                                                                              for important results in network science. From the Influence Flower
                                                                              of the institute, we seek evidence not only on its multidisciplinary
                                                                              heritage, but also on the disciplines that it has influenced.
Figure 9: Paper-to-topic Influence Flower of a physics paper with                The study of complexity science examines many different do-
delayed recognition [30] showing 1986 – 2003 with the anchor flower           mains, including computational, biological, and social systems. This
1986 – 2018. The paper received the first citation after 10 years. Most       is reflected in the Influence Flower (Fig. 10) by the inclusion and
of the initial citations are from physics, but later it gets more citations   relatively equal size of the alter nodes: from botany, to social psy-
from different research fields. See Sec. 6.2.                                 chology, to simulations. In the Influence Flower, strong heritage
                                                                              of complexity science from biology is reflected as the two highest
                                                                              influencing alter nodes being ecology and genetics. Further, on
                                                                              the right hand side, the Influence Flower shows that the topic ar-
                                                                              eas they have influenced are within the computer science side of
                                                                              complexity science – artificial intelligence, machine learning, etc.
                                                                              From the anchor flower, the observation patterns of the influence is
                                                                              consistent in Santa Fe’s current research, with interactions between
                                                                              biology and computing topics increasing the most over the past
                                                                              decade. The ratio and volume of total influence may also be affected
                                                                              by the increased publication volume on the corresponding topics in
                                                                              computing, ecology, and genetics.
                                                                                 In this case study, we use Influence Map to profile the heritage
Figure 10: Institution-to-topic Influence Flower of the Santa Fe Institute    and contributions a research centre has towards multiple fields. We
1988 – 2008, with the anchor flower 1988 – 2018. See Sec. 6.3.                choose the Santa Fe Institute due to its moderate size and concentra-
                                                                              tion of topics. In a large organisation (e.g. a university) the influence
                                                                              may be too spread out to see meaningful patterns. Instead, moderate-
flower Fig. 6(c), we can see that Goldwasser’s work between 1996              sized institutions can be established and grown in a decade or so, a
and 2011 has influenced several communities that she does not pub-            timeframe relevant to decision-makers.
lish in herself (dark venue names), such as information theory and
communication networks.                                                       6.4 Trend change of a venue
   Here, Influence Map provides a detailed view of one’s intellec-            Computer science as a field has been having increasingly many pub-
tual influences by different entity types, and the observations are           lications every year and the fast development of ideas has made
corroborated by the biography and opinions of the ego.                        studying this evolution important [16]. We look at the International
                                                                              World Wide Web Conference (WWW) in this case study to consider
6.2 A paper with delayed recognition                                          how Influence Map can be used to examine a conference which cap-
                                                                              tures the changing landscape of computer science. In our analysis,
A paper with delayed recognition, often called a sleeping beauty or a         we use a series of Influence Flowers to examine the change in topics
Mendel syndrome, indicates a publication which received very little           over time in WWW (Fig. 11). We divide the time span of WWW
or no attention for a while, then was discovered later and received           into three non-overlapping time intervals, 1994-1999 (1990s), 2000-
many citations. For example, the term Mendel syndrome is from                 2009 (2000s), and 2010-2018 (2010s). Each Influence Flower is
Gregor Mendel in plant genetics, whose work is accepted by the                created using publications and citations of the corresponding time
community after three decades. There are many recognised causes               interval. The anchor flower is not utilised in this example, as we
for delayed recognition, such as conservatism of the community,               are more concerned about the ratio of influence in each topic area,
errors in judgements, or lag time for the discipline to mature [9].           rather than the total growth overtime. The topics of papers, rather
Many works have investigated delayed recognition in the scientific            than the topic of influence, can be found in Fig. 18 in the appendix.
literature [9, 20, 40].                                                           Fig. 11 presents three venue-to-topic Influence Flowers of WWW
    We examine a physics paper with delayed recognition [30]. When            in the 1990s, 2000s, and 2010s. Contrary to the namesake of the
the term sleeping beauty was first introduced by [40], this paper was         conference, the relative influence of WWW to the topic of the world
used as an extreme example. Fig. 9 presents the paper-to-topic                wide web has been decreasing. The world wide web topic has
flower of the paper, comparing the contrast flower from 1986 to               the highest incoming and outgoing influence in the 1990s, but has
2003 with the anchor. The paper does not draw any attention until it          decreased in the subsequent years. Further, the colouring of the
gets its first citation after 10 years (1995). From 1995 to 2003, the         nodes shows that the influence direction between WWW and the
paper influenced quantum electrodynamics and other physics and                world wide web topic has been changed. Contrasting to the red in
mechanics fields. In 2004, the paper is introduced as an example of           the 1990s flower, the alter node in the 2010s flower has become
a sleeping beauty. Since then, it is cited from entirely different fields     blue indicating that WWW gets influenced more by the topic than
identifying sleeping beauty papers such as management science,                its influence on the topic. With the decrease in the world wide web
biological engineering, and marketing. At the same time, it is still          topic, there is also a notable increase in relative influence for data
influential to physics.                                                       mining playing a major role from the 2000s. The machine learning
    Influence Map provides the visualisation of delayed recognition           and artificial intelligence topics have emerged over time, becoming
by showing the delaying time and volume of attention, along with              particularly prominent in the 2010s flower. One explanation is that
the changes in the influence profile. This analysis not only applies          synergy between WWW and artificial intelligence and machine
to papers with delayed recognition, but also to any paper, project            learning grew stronger. These observations are corroborated by the
(e.g. Appendix Fig. 17), or other type of academic entities.                  appendix Fig. 18, where we can see that strength of world wide web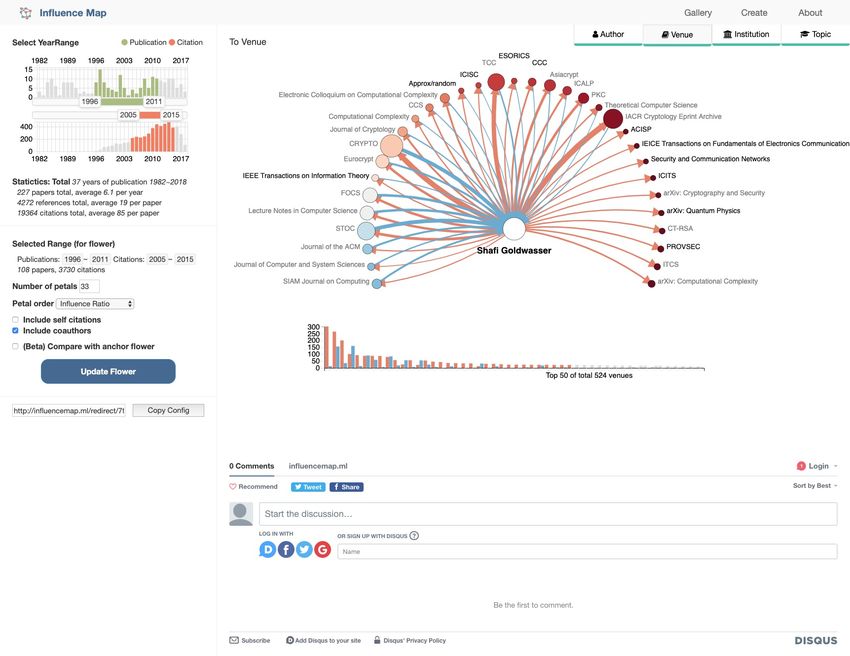
1990s (1994-1999)

                                     2000s (2000-2009)

                                                                         Figure 12: Academic (top) vs Twitter (bottom) Influence Flowers for
                                                                         Yann LeCun, 2018 Turing co-awardee for breakthroughs in deep
                                                                         neural networks. See Sec. 6.5.

                                                                         ences Avinir, @LaFrenchTech, @Montreal AI), and industry and
                                     2010s (2010-2018)                   scientific organisations (@facebook, @GoogleAI, @nvidia, @Na-
                                                                         tureNews, @TheOfficialACM). The few reciprocating edges are to
Figure 11: Venue-to-topic Influence Flowers of International World       @TheOfficialACM who conferred the award, the French President
Wide Web Conference (WWW). Each flower represents the trends             Macron, and a few others in the AI industry.
of the conference by selecting both the publications and citations of       Contrasting the academic and social media Influence Flowers, we
each decade – 1990s, 2000s, and 2010s. See Sec. 6.4.                     can see that the two data sources capture activities in very different
                                                                         communities (research vs media) and the actors of influence tend
topic in published papers decreases, whilst data mining and machine      to be very different. More generally, this case study illustrates that
learning increase.                                                       Influence Flower can be readily adapted for other data domains
   In this case study we have demonstrated how one can use Influ-        and that one can rethink the mapping between flower elements and
ence Map to examine the changes in research topics of a publication      data attributes, e.g. follower count becomes the additional attribute
venue. Influence Map visualises the primary topics of influence in       reflected in node size.
a venue. We note that this analysis is not limited to conferences or
                                                                         7 C ONCLUSION
journals, but to any group or community that publishes over time.
                                                                         We propose the Influence Flower, a new visual metaphor to portray
6.5 Influence Flowers of social media data                               the flow of influence between academic entities. We develop the
The Influence Flower metaphor can be applied to data outside of          Influence Map system to interactively search entities and create influ-
academic graphs. Fig. 12 presents two Influence Flowers for Yann         ence flowers, supported by efficient indexing of the entire Microsoft
LeCun, one of the 2018 Turing Awardees who has an active Twitter         Academic Graph. Further, we present case studies illustrating the
profile. On the top is the author-to-author Influence Flower over        use of the Influence Flower in understanding one’s scientific career,
LeCun’s career, as defined in Sec. 4 and similar to Fig. 8. The bottom   the dynamics of interdisciplinary impact, the intellectual profile of
flower is generated using one week of tweets mentioning LeCun (or        an institution, and the topic shift of an academic community. We
Twitter user @ylecun, the ego node) until two days after the award       also discuss an example Influence Flower using social media data.
announcement on 2019-03-27. The interacting Twitter users form              Future work lies in two fronts. In this visual design, we would like
the alter nodes. The node sizes are proportional to their respective     to ease the tension between its visualisation function and richness of
number of Twitter followers. The edges describe the influence            the flower metaphor, such as to endow meanings to size and shade
made by retweets, mentions, and replies. The thickness of edges          of the petals, and to enact growth. On the functional front, we would
are proportional to the number of times one user has mentioned           like more versatile comparisons of flowers beyond subsets in time,
the other. Similarly to the academic flowers, the influence flow is      and using the Influence Flower to understand the production and
opposite to the direction of mentions. The alters mentioning LeCun       consumption of science at large.
produces a red edge to show that LeCun influenced the alter.             Acknowledgements This work is supported by ANU College of Engineering and Com-
   LeCun’s academic flower shows co-recipients Hinton and Bengio         puter Science, Data to Decisions CRC, and ACM SIGMM. We thank Microsoft and
having the most influence, both are reciprocated. Moreover, Andrew       Kuansan Wang for the academic graph data. Computing infrastructure is provided by
Ng, who is well-known in machine learning research and active            NECTAR. Nectar is supported by the Australian Government through the National
on Twitter, is the only common node across both flowers. On the          Collaborative Research Infrastructure Strategy (NCRIS). We thank Kathryn McKin-
Twitter flower, three types of nodes mentioned @ylecun: people           ley, Bob Williamson, John Lloyd, Thushara Abhayapala, Cheng Soon Ong, Rajeev
in the artificial intelligence industry (@demishassabis, @JeffDean,      Gore, Michael Norrish, Joan Leach, Kobi Leins, and Deb Verhoeven for contributing
@jeremyhoward, @hardmaru), organisations in France and Canada            their ideas and perspectives. We also thank the anonymous reviewers for constructive
- LeCun and Bengio’s home countries (@EmmanuelMacron, @Sci-              suggestions.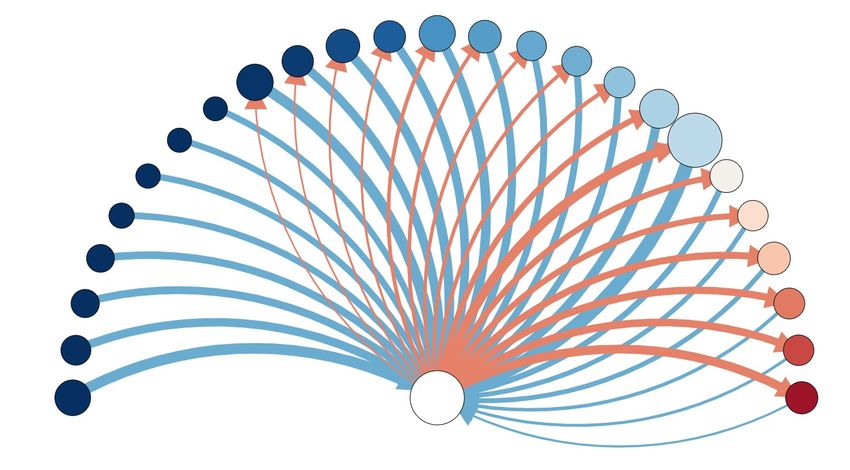
R EFERENCES                                                                        [25] S. Latif and F. Beck. VIS Author Profiles: Interactive descriptions of
                                                                                        publication records combining text and visualization. IEEE transac-
 [1] Turing awardee profile: Shafi goldwasser - additional material,                    tions on visualization and computer graphics, 25(1):152–161, 2019.
     2013. https://amturing.acm.org/info/goldwasser 8627889.cfm, re-               [26] B. Lee, M. Czerwinski, G. Robertson, and B. B. Bederson. Understand-
     trieved March 2019.                                                                ing research trends in conferences using paperlens. In CHI’05 extended
 [2] E. Berger, S. M. Blackburn, C. Brodley, H. Jagadish, K. S. McKinley,               abstracts on Human factors in computing systems, pp. 1969–1972.
     M. A. Nascimento, M. Shin, K. Wang, and L. Xie. GOTO rankings                      ACM, 2005.
     considered helpful. Communications of the ACM, 62(7):29–30, 2019.             [27] J. F. Lienard, T. Achakulvisut, D. E. Acuna, and S. V. David. Intellec-
 [3] C. T. Bergstrom, J. D. West, and M. A. Wiseman. The eigenfactor                    tual synthesis in mentorship determines success in academic careers.
     metrics. Journal of Neuroscience, 28(45):11433–11434, 2008.                        Nature communications, 9(1):4840, 2018.
 [4] L. Bornmann and H.-D. Daniel. Does the h-index for ranking of                 [28] Q. Liu, Y. Hu, L. Shi, X. Mu, Y. Zhang, and J. Tang. EgoNetCloud:
     scientists really work? Scientometrics, 65(3):391–392, 2005.                       Event-based egocentric dynamic network visualization. In 2015 IEEE
 [5] M. Bostock, V. Ogievetsky, and J. Heer. D3 data-driven docu-                       Conference on Visual Analytics Science and Technology (VAST), pp.
     ments. IEEE transactions on visualization and computer graphics,                   65–72. IEEE, 2015.
     17(12):2301–2309, 2011.                                                       [29] F. Reitz. A framework for an ego-centered and time-aware visu-
 [6] C. Chen. Searching for intellectual turning points: Progressive knowl-             alization of relations in arbitrary data repositories. arXiv preprint
     edge domain visualization. Proceedings of the National Academy of                  arXiv:1009.5183, 2010.
     Sciences, 101(suppl 1):5303–5310, 2004.                                       [30] L. J. Romans. Massive n= 2a supergravity in ten dimensions. Physics
 [7] C. Chen. CiteSpace II: Detecting and visualizing emerging trends                   Letters B, 169(4):374–380, 1986.
     and transient patterns in scientific literature. Journal of the American      [31] M. Rosvall and C. T. Bergstrom. Maps of random walks on complex
     Society for information Science and Technology, 57(3):359–377, 2006.               networks reveal community structure. Proceedings of the National
 [8] J.-K. Chou and C.-K. Yang. PaperVis: Literature review made easy.                  Academy of Sciences, 105(4):1118–1123, 2008.
     In Computer Graphics Forum, vol. 30, pp. 721–730. Wiley Online                [32] Z. Shen, H. Ma, and K. Wang. A web-scale system for scientific knowl-
     Library, 2011.                                                                     edge exploration. Proceedings of ACL 2018, System Demonstrations,
 [9] R. Costas, T. N. van Leeuwen, and A. F. van Raan. The mendel                       pp. 87–92, 2018.
     syndrome in science: durability of scientific literature and its effects on   [33] L. Shi, C. Wang, Z. Wen, H. Qu, C. Lin, and Q. Liao. 1.5D egocentric
     bibliometric analysis of individual scientists. Scientometrics, 89(1):177–         dynamic network visualization. IEEE transactions on visualization
     205, 2011.                                                                         and computer graphics, 21(5):624–637, 2015.
[10] M. Dörk, N. H. Riche, G. Ramos, and S. Dumais. PivotPaths: Strolling         [34] R. Sinatra, D. Wang, P. Deville, C. Song, and A.-L. Barabási.
     through faceted information spaces. IEEE transactions on visualization             Quantifying the evolution of individual scientific impact. Science,
     and computer graphics, 18(12):2709–2718, 2012.                                     354(6312):aaf5239, 2016.
[11] N. Elmqvist and P. Tsigas. CiteWiz: a tool for the visualization of           [35] A. Sinha, Z. Shen, Y. Song, H. Ma, D. Eide, B.-j. P. Hsu, and K. Wang.
     scientific citation networks. Information Visualization, 6(3):215–232,             An overview of microsoft academic service (mas) and applications. In
     2007.                                                                              Proceedings of the 24th international conference on world wide web,
[12] S. Fortunato, C. T. Bergstrom, K. Börner, J. A. Evans, D. Helbing,                pp. 243–246. ACM, 2015.
     S. Milojević, A. M. Petersen, F. Radicchi, R. Sinatra, B. Uzzi, et al.       [36] J. Stasko, J. Choo, Y. Han, M. Hu, H. Pileggi, R. Sadana, and C. D.
     Science of science. Science, 359(6379):eaao0185, 2018.                             Stolper. CiteVis: Exploring conference paper citation data visually.
[13] T.-L. Fung, J.-K. Chou, and K.-L. Ma. A design study of personal                   Posters of IEEE InfoVis, 2, 2013.
     bibliographic data visualization. In 2016 IEEE Pacific Visualization          [37] C. R. Sugimoto, N. Robinson-Garcı́a, D. S. Murray, A. Yegros-Yegros,
     Symposium (PacificVis), pp. 244–248. IEEE, 2016.                                   R. Costas, and V. Larivière. Scientists have most impact when they’re
[14] A.-W. Harzing and S. Alakangas. Microsoft academic is one year old:                free to move. Nature News, 550(7674):29, 2017.
     The phoenix is ready to leave the nest. Scientometrics, 112(3):1887–          [38] J. Tang, J. Zhang, L. Yao, J. Li, L. Zhang, and Z. Su. ArnetMiner:
     1894, 2017.                                                                        extraction and mining of academic social networks. In Proceedings
[15] D. Hicks, P. Wouters, L. Waltman, S. De Rijcke, and I. Rafols. Bib-                of the 14th ACM SIGKDD international conference on Knowledge
     liometrics: the leiden manifesto for research metrics. Nature News,                discovery and data mining, pp. 990–998. ACM, 2008.
     520(7548):429, 2015.                                                          [39] M. Valenzuela, V. Ha, and O. Etzioni. Identifying meaningful cita-
[16] A. Hoonlor, B. K. Szymanski, and M. J. Zaki. Trends in computer                    tions. In Workshops at the Twenty-Ninth AAAI Conference on Artificial
     science research. Communications of the ACM, 56(10):74–83, 2013.                   Intelligence, 2015.
[17] S. E. Hug and M. P. Brändle. The coverage of microsoft academic:             [40] A. F. Van Raan. Sleeping beauties in science. Scientometrics,
     Analyzing the publication output of a university. Scientometrics,                  59(3):467–472, 2004.
     113(3):1551–1571, 2017.                                                       [41] Y. Wang, C. Shi, L. Li, H. Tong, and H. Qu. Visualizing research impact
[18] S. E. Hug, M. Ochsner, and M. P. Brändle. Citation analysis with                  through citation data. ACM Transactions on Interactive Intelligent
     microsoft academic. Scientometrics, 111(1):371–378, Apr 2017. doi:                 Systems (TiiS), 8(1):5, 2018.
     10.1007/s11192-017-2247-8                                                     [42] L. Wu, D. Wang, and J. A. Evans. Large teams develop and small
[19] J. P. Ioannidis, K. Boyack, and P. F. Wouters. Citation metrics: a primer          teams disrupt science and technology. Nature, p. 1, 02 2019. doi: 10.
     on how (not) to normalize. PLoS biology, 14(9):e1002542, 2016.                     1038/s41586-019-0941-9
[20] Q. Ke, E. Ferrara, F. Radicchi, and A. Flammini. Defining and identify-       [43] Y. Wu, N. Pitipornvivat, J. Zhao, S. Yang, G. Huang, and H. Qu.
     ing sleeping beauties in science. Proceedings of the National Academy              egoSlider: Visual analysis of egocentric network evolution. IEEE
     of Sciences, 112(24):7426–7431, 2015.                                              transactions on visualization and computer graphics, 22(1):260–269,
[21] M. M. King, C. T. Bergstrom, S. J. Correll, J. Jacquet, and J. D. West.            2016.
     Men set their own cites high: Gender and self-citation across fields and      [44] J. Zhao, M. Glueck, F. Chevalier, Y. Wu, and A. Khan. Egocentric
     over time. Socius, 3:2378023117738903, 2017.                                       analysis of dynamic networks with egolines. In Proceedings of the
[22] S. Konkiel, M. Dalmau, and D. Scherer. Altmetrics and analytics for                2016 CHI Conference on Human Factors in Computing Systems, pp.
     digital special collections and institutional repositories. 2015.                  5003–5014. ACM, 2016.
[23] T. Kurosawa and Y. Takama. Co-authorship networks visualization
     system for supporting survey of researchers future activities. Journal
     of Emerging Technologies in Web Intelligence, 4(1):3–14, 2012.
[24] V. Larivière, C. Ni, Y. Gingras, B. Cronin, and C. R. Sugimoto.
     Bibliometrics: Global gender disparities in science. Nature News,
     504(7479):211, 2013.
You can also read