Influence of Chinese National Centralized Drug Procurement on the price of policy-related drugs: an interrupted time series analysis
←
→
Page content transcription
If your browser does not render page correctly, please read the page content below
Preprints (www.preprints.org) | NOT PEER-REVIEWED | Posted: 6 April 2021 doi:10.20944/preprints202104.0157.v1

 Article

 Influence of Chinese National Centralized Drug Procurement
 on the price of policy-related drugs: an interrupted time series
 analysis
 Ni Wang 1,†, Ying Yang 1,2,*,†, Luxinyi Xu 1, Zongfu Mao 1,2, Dan Cui 1,2,*

 1 School of Health Sciences, Wuhan University, 115# Donghu Road, Wuhan 430071, China;
 2018203050035@whu.edu.cn (N.W.); yangying@whu.edu.cn (Y.Y.); 2020203050034@whu.edu.cn (L.X.);
 zfmao@whu.edu.cn (Z.M.); alyssazz@126.com (D.C.)
 2 Global Health Institute, Wuhan University, 115# Donghu Road, Wuhan 430071, China

 * Correspondence: yangying@whu.edu.cn (Y.Y.); alyssazz@126.com (D.C.); Tel.: +86-156-2326-3020 (Y.Y.);
 +86-133-1715-0755 (D.C.)
 † These authors contributed equally to this work.

 Abstract: In 2019, Chinese government implemented the first round of National Centralized Drug
 Procurement (NCDP) pilot (so-called "4+7" policy) in mainland China, achieved a prominent price
 reduction of 52% on average for 25 bidding winning products. Under cross-price elasticity theory,
 the price behavior of pharmaceutical enterprises for policy-related drugs might change. This study
 used drug purchasing data from the Centralized Drug Procurement Survey in Shenzhen 2019, and
 applied single-group Interruption Time Series (ITS) design to examine the impact of "4+7" policy on
 the drug price index (DPI) of policy-related drugs. The ITS analysis showed that the DPI of win-
 ning (-0.183 per month, p
Preprints (www.preprints.org) | NOT PEER-REVIEWED | Posted: 6 April 2021 doi:10.20944/preprints202104.0157.v1

 of the State Council of the People’s Republic of China implemented the National Cen-
 tralized Drug Procurement (NCDP) policy [11]. In the first round of the NCDP pilot, four
 municipalities and seven sub-provincial cities in mainland China were selected as pilot
 cities, thus, the first round of NCDP pilot is also known as “4+7” policy. Under NCDP
 policy, original branded drugs and generic drugs that passed the consistency evaluation
 of quality and efficacy were involved to conduct volume-based procurement, leading to a
 decline in drug prices by “group purchase” [12]. In the “4+7” policy, 25 drugs were cen-
 tralized purchased (CP) with an average price decline of 52% [13].
 According to the cross-price elasticity theory, in a group of drugs with substitution
 relationship, the percentage change in quantity demanded for one product in response to
 a percentage change in price of another product [14, 15]. Under the NCDP policy, the
 price behavior of pharmaceutical enterprises related to CP drugs would inevitably
 change. Previous studies reported the change of policy-related drugs after the imple-
 mentation of “4+7” policy. Wang et al.’s [16] study in Shanghai found that the average
 daily cost of branded and generic cardiovascular drugs fell by 66.45% and 24.24% after
 the implementation of “4+7” policy. Chen et al. [17] reported that the price of winning
 products, non-winning products and basic alternative drugs decreased in Shenzhen.
 Yang et al. [18] indicated that the price of non-winning antipsychotic drugs decreased by
 more than 10% as the results of “4+7” policy, while the price of non-winning drugs in the
 same varieties dropped by less than 5%. However, Ye et al. [19] reported opposite results
 that the defined daily dose cost (DDDc) of non-winning products and alternative drugs
 increased by 17.43% and 7.68%, respectively.
 In summary, previous findings regarding the impact of NCDP policy on drug prices
 have been controversial. In the present study, we took the "4+7" policy as an example,
 using Drug Price Index (DPI) and single-group Interruption Time Series (ITS) to examine
 the impact of the NCDP policy on the change of policy-related drug prices in Shenzhen.

 2. Materials and Methods

 2.1. Data Sources
 This study used data from the Centralized Drug Procurement Survey in Shenzhen
 2019 (CDPS-SZ 2019) [17]. In China, the CDPS-SZ 2019 was organized and conducted by
 the Global Health Institute of Wuhan University between December 2019 and January
 2020. The survey aimed to evaluate the effect of drug-related policies in Shenzhen, China,
 and collected monthly drug purchase order data between 2018 and 2019. In the CDPS-SZ
 2019 database, each purchase order record included purchase date, generic name, dosage
 form, specification, pharmaceutical manufacturer, price per unit, purchase volume,
 purchase expenditures, etc. A general database containing 963,127 monthly aggregated
 purchase order records was established, involving 1079 drug varieties (by generic name),
 346 medical institutions, 857 pharmaceutical manufacturers. The total purchase expend-
 itures reached RMB 20.87 billion.
 The purpose of this study is to examine the impact of NCDP policy on prices of
 policy-related drugs. Thus, we included samples with the following criteria: (a) the
 medication covered by “4+7” CP and their alternative drugs (Table A1). The CP drugs
 were sorted into winning and non-winning products based on the bidding results of
 "4+7" policy; (b) the time period between January 2018 and December 2019; and (c) the
 medical institutions purchasing drugs were from Shenzhen, China. Finally, 47,163 pur-
 chase order records of 82 drug varieties (by generic name) were included in the analysis.
 Figure 1 presents the flow chart of sample screening.
Preprints (www.preprints.org) | NOT PEER-REVIEWED | Posted: 6 April 2021 doi:10.20944/preprints202104.0157.v1

 Figure 1. Flow chart of sample screening. Note: CP, centralized purchased.

 2.2. Outcome Variables
 Drug Price Index was used as outcome variable in this study, which is a common
 indicator reflecting the trend of drug price change over different periods [20, 21]. This
 study applied three commonly used DPI: Laspeyres Price Index (LP), Paasche Price Index
 (PP), and Fisher Price Index (FP).
 LP is calculated as the ratio of price in reporting period and the price in baseline pe-
 riod, weighted by the quantity in baseline period. This method assumes that the con-
 sumption structure of drugs remains unchanged in different periods, and is applicable to
 reflect the pure price change of drugs. LP is calculated as follows:
 ∑
 = (1)
 ∑
 PP is calculated as the ratio of price in reporting period and the price in base-period,
 weighted by the quantity in reporting period. The index reflects the increase or decrease
 in drug costs due to the price change when the quantity and consumption structure has
 changed. PP is calculated as follows:
 ∑
 = (2)
 ∑

 FP is calculated as the geometric mean of LP and PP, which was weighted by the
 quantity in both baseline period and reporting period. Thus, FP can equalize and average
 the biases of LP and PP. Theoretical researches showed that FP is an optimal form of price
 index, and is called “the ideal index” [22]. FP is calculated as follows:

 = × (3)

 In the above formula (1)-(3), P means the price, P0 and P1 refer to price per Defined
 Daily Doses (DDDs) of each product in baseline- and reporting period. Q means pur-
Preprints (www.preprints.org) | NOT PEER-REVIEWED | Posted: 6 April 2021 doi:10.20944/preprints202104.0157.v1

 chasing quantity, Q0 and Q1 refer to DDDs of each product in baseline- and reporting
 period. DDDs is the ratio of the quantity of drug utilization and Defined Daily Dose
 (DDD) [23]. If the drug price index > 1, it indicates the increase of drug price in the re-
 porting period when compared with the base-period; If the drug price index =1, it means
 that drug prices remain unchanged over the two periods; If the drug price index < 1, it
 means that drug prices in the reporting period decrease compared with the base period.
 In this study, January to June 2018 was assigned as the baseline period, and July
 2018 to December 2019 was assigned as the reporting periods to calculate drug price in-
 dexes of each month (18 months).

 2.3. Statistical Analysis
 Descriptive statistics were used. We first described the change of DPI of included
 drugs before (July 2018 to February 2019) and after (March to December 2019) the im-
 plementation of "4+7" policy.
 Interrupted time-series analysis was applied to assess the change of Fisher Price
 Index after the implementation of "4+7" policy. ITS is a commonly used approach for
 evaluating changes in longitudinal series following a quasi-experimental intervention
 occurring at a fixed point in time. The interrupted time series was constructed with DPI
 data in Shenzhen from July 2018 to December 2019. The time unit was set to 1 month and
 the intervention time point was set to March 2019, making 18 time points available for
 analysis, including 8 points as pre-"4+7" policy period and 10 points as post-"4+7" policy
 period. To estimate the effect of the intervention on the outcome variables, the following
 segmented linear regression model was developed [24-26]:
 = + × + × + × + (4)

 Where, Yt is the independent outcome variable (i.e. Fisher Price Index) in month t.
 time is a continuous variable indicating time in months at time t from the start of the ob-
 servation period. intervention is an indicator for time t in the pre-"4+7" policy period (in-
 tervention = 0) and post-"4+7" policy period (intervention = 1). time after intervention is a
 continuous variable indicating months in the post-"4+7" policy period (time in the
 pre-"4+7" policy period is coded 0).
 In this model, β0 estimates the baseline level of the independent variable at the be-
 ginning of the observation period. β1 estimates the linear trend during the
 pre-intervention period. β2 estimates the level change in the outcome variable immedi-
 ately following the intervention. β3 estimates the trend change in the outcome variable in
 the post-intervention period compared with the pre-intervention period. εt is an estimate
 of the random error at time t. Durbin-Watson test was performed to test the presence of
 first-order auto-correlation (a value around 2 indicates no sign of auto-correlation). If
 autocorrelation is detected, the Prais-Winsten method was applied to estimate the re-
 gression. Stata version 16.0 was used to perform the ITS analysis. A p-value
Preprints (www.preprints.org) | NOT PEER-REVIEWED | Posted: 6 April 2021 doi:10.20944/preprints202104.0157.v1

 Table 1. The change of drug price index for winning and non-winning products pre- and post-"4+7"
 policy.

 LP PP FP
 Pre- Post- GR (%) Pre- Post- GR (%) Pre- Post- GR (%)
 Winning products
 Mean 0.93 0.44 -53.42 0.94 0.42 -54.82 0.44 0.09 -79.02
 SD 0.09 0.03 - 0.08 0.03 - 0.08 0.01 -
 Min 0.80 0.42 - 0.81 0.41 - 0.32 0.09 -
 Max 1.00 0.53 - 1.00 0.51 - 0.50 0.13 -
 Non-winning products
 Mean 0.99 0.96 -2.32 0.99 0.89 -9.91 0.49 0.43 -11.96
 SD 0.01 0.02 - 0.01 0.04 - 0.01 0.03 -
 Min 0.97 0.94 - 0.97 0.85 - 0.47 0.41 -
 Max 1.00 1.00 - 1.00 1.00 - 0.50 0.50 -
 Note: LP: Laspeyres Price Index; PP: Paasche Price Index; FP: Fisher Price Index; Pre-: pre-"4+7" pol-
 icy, i.e. July 2018 to February 2019; Post-: post-"4+7" policy, i.e. March 2019 to December 2019; GR:
 growth rate; SD: standard deviation.
 Table 2 summarizes the results of CP drugs and alternative drugs. After the im-
 plementation of "4+7" policy, the LP, PP, and FP of CP drugs decreased by 58.95%, 60.68%,
 and 83.38%, respectively. The FP of CP drugs dropped from 0.48 (SD = 0.02) in pre-"4+7"
 policy period to 0.08 (SD = 0.03) in post-"4+7" policy period. The LP, PP, and FP of alterna-
 tive drugs decreased by 2.30%, 2.11%, and 4.34%, respectively. The FP of alternative drugs
 dropped from 0.49 (SD = 0.01) in pre-"4+7" policy period to 0.47 (SD =0.02) in post-"4+7"
 policy period. For the overall of CP drugs and alternative drugs, the LP, PP, and FP de-
 creased by 35.83%, 41.49%, and 62.21%, respectively. The FP of the overall drugs dropped
 from 0.48 (SD = 0.01) in pre-"4+7" policy period to 0.18 (SD = 0.03) in post-"4+7" policy
 period.

 Table 2. The change of drug price index for centralized purchased drugs and alternative drugs pre-
 and post-"4+7" policy.

 LP PP FP
 Pre- Post- GR (%) Pre- Post- GR (%) Pre- Post- GR (%)
 CP drugs
 Mean 0.98 0.40 -58.95 0.98 0.39 -60.68 0.48 0.08 -83.38
 SD 0.02 0.07 - 0.01 0.07 - 0.02 0.03 -
 Min 0.95 0.35 - 0.96 0.34 - 0.46 0.06 -
 Max 1.00 0.60 - 0.99 0.59 - 0.50 0.18 -
 Alternatives
 Mean 0.99 0.97 -2.30 0.99 0.97 -2.11 0.49 0.47 -4.34
 SD 0.01 0.02 - 0.01 0.02 - 0.01 0.02 -
 Min 0.98 0.95 - 0.97 0.95 - 0.48 0.45 -
 Max 1.02 1.00 - 1.00 1.00 - 0.51 0.50 -
 Overall
 Mean 0.98 0.63 -35.83 0.98 0.58 -41.49 0.48 0.18 -62.21
 SD 0.01 0.05 - 0.01 0.06 - 0.01 0.03 -
 Min 0.97 0.60 - 0.97 0.52 - 0.47 0.16 -
 Max 1.00 0.77 - 1.00 0.72 - 0.50 0.28 -
 Note: LP, Laspeyres Price Index; PP, Paasche Price Index; FP, Fisher Price Index; Pre-, pre-"4+7" pol-
 icy, i.e. July 2018 to February 2019; Post-, post-"4+7" policy, i.e. March 2019 to December 2019; GR,
 growth rate; CP, centralized purchased; SD, standard deviation.

 3.2. ITS analysis
 3.2.1. Winning and non-winning products
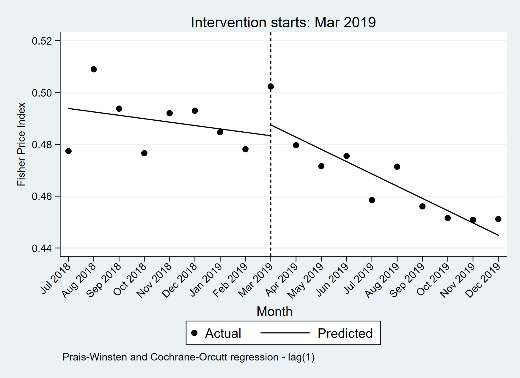
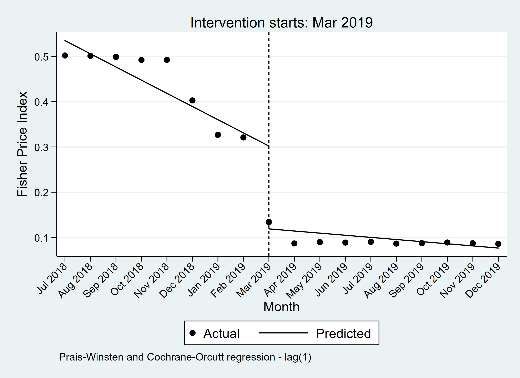
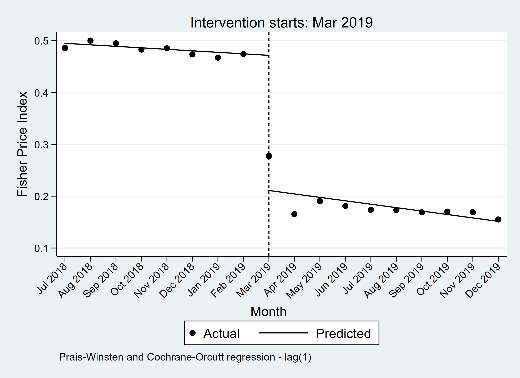
Preprints (www.preprints.org) | NOT PEER-REVIEWED | Posted: 6 April 2021 doi:10.20944/preprints202104.0157.v1

 The ITS results of winning and non-winning products are presented in Table 3. The
 FP of winning products significantly declined (-0.183 per month, 95% CI = -0.248 to -0.118,
 p-value < 0.001) in the start of the "4+7" policy implementation, while significant incre-
 ment (0.024 per month, 95% CI = 0.008 to 0.041, p-value = 0.007) in FP of winning products
 was found between the pre- and post-"4+7" policy slopes. In the start of the "4+7" policy
 implementation, significant decrease (-0.034 per month, 95% CI = -0.067 to -0.001, p-value
 = 0.046) was found in FP of non-winning products. However, the change in the pre- and
 post-"4+7" policy slopes had no significant difference (p-value = 0.262) (Figure 2).

 Table 3. ITS results of Fisher Price Index for winning and non-winning products.

 95% CI
 Item Coef. S.E t p-value
 Lower Upper
 Winning products
 Baseline level, β0 0.535 0.025 21.180 0.000 0.481 0.589
 Baseline trend, β1 -0.029 0.006 -5.240 0.000 -0.041 -0.017
 Level change, β2 -0.183 0.030 -6.050 0.000 -0.248 -0.118
 Trend change, β3 0.024 0.008 3.190 0.007 0.008 0.041
 Non-winning products
 Baseline level, β0 0.491 0.010 49.150 0.000 0.470 0.513
 Baseline trend, β1 -0.001 0.002 -0.500 0.628 -0.006 0.004
 Level change, β2 -0.034 0.015 -2.190 0.046 -0.067 -0.001
 Trend change, β3 -0.003 0.003 -1.170 0.262 -0.010 0.003

 (a) (b)
 Figure 2. The Fisher Price Index of winning and non-winning products in the pre- and post-"4+7" policy periods. (a)
 winning products, (b) non-winning products.

 3.2.2. CP and alternative drugs
 The ITS results of CP drugs and alternative drugs are presented in Table 4. The FP of
 CP drugs significantly declined (-0.347 per month, 95% CI = -0.395 to -0.299, p-value <
 0.001) in the start of the "4+7" policy implementation. However, no statistically significant
 difference was found in the trend change between the pre- and post-"4+7" policy periods
 (p-value = 0.761). Significant decline (-0.003 per month, 95% CI = -0.006 to -0.001, p-value =
 0.014) in FP of alternative drugs was found between the pre- and post-"4+7" policy slopes.
 For the overall of CP drugs and alternative drugs, the FP significantly decreased (-0.261
 per month, 95% CI = -0.298 to -0.223, p-value < 0.001) at the start of the "4+7" policy im-
 plementation, while the change in the pre- and post-"4+7" policy slopes had no significant
 difference (p-value = 0.268) (Figure 3).

 Table 4. ITS results of Fisher Price Index for centralized purchased drugs and alternative drugs.

 95% CI
 Item Coef. S.E t p-value
 Lower Lower
 CP drugs
Preprints (www.preprints.org) | NOT PEER-REVIEWED | Posted: 6 April 2021 doi:10.20944/preprints202104.0157.v1

 Baseline level, β0 0.498 0.015 33.670 0.000 0.466 0.530
 Baseline trend, β1 -0.005 0.004 -1.470 0.164 -0.013 0.002
 Level change, β2 -0.347 0.022 -15.480 0.000 -0.395 -0.299
 Trend change, β3 -0.001 0.004 -0.310 0.761 -0.011 0.008
 Alternatives
 Baseline level, β0 0.494 0.004 115.580 0.000 0.485 0.503
 Baseline trend, β1 -0.001 0.001 -1.270 0.225 -0.004 0.001
 Level change, β2 0.004 0.007 0.630 0.537 -0.010 0.018
 Trend change, β3 -0.003 0.001 -2.790 0.014 -0.006 -0.001
 Overall
 Baseline level, β0 0.495 0.011 44.240 0.000 0.471 0.519
 Baseline trend, β1 -0.003 0.003 -1.070 0.303 -0.009 0.003
 Level change, β2 -0.261 0.017 -15.020 0.000 -0.298 -0.223
 Trend change, β3 -0.004 0.003 -1.150 0.268 -0.011 0.003
 Note: CP, centralized purchased.

 (a) (b)

 (c)
 Figure 3. The Fisher Price Index of CP drugs and alternative drugs in the pre- and post-"4+7" policy periods. (a) CP drugs,
 (b) alternative drugs, (c) overall. Note: CP, centralized purchased.

 4. Discussion
 This study aims to analyze the impact of NCDP on the prices of policy-related drugs.
 Overall, we found that the price of winning products decreased markedly and the prices
 of non-winning products dropped slightly after the implementation of "4+7" policy, while
 the price change of alternative products had no statistical difference. For the overall
 drugs of CP and alternative, the comprehensive effect of “4+7” policy on price reduction
 was significant, but the long-term effect of the policy was not obvious.
 In the NCDP policy, 60%-70% of the market in pilot cities was assigned to conduct
 volume-based procurement, so as to relieve the artificially high drug prices by “group
 purchase” [27]. In this study, a notably direct effect of price reduction for winning
 products was observed, the FP decreased by 79.02% and showed significant difference
 between the pre- and post-”4+7” policy periods. Tan et al. [28] reported similar results
 that 25 winning drugs dropped by 51.88% in Guangzhou when compared with the
Preprints (www.preprints.org) | NOT PEER-REVIEWED | Posted: 6 April 2021 doi:10.20944/preprints202104.0157.v1

 pre-intervention period, among which the price of atorvaststin (10mg*7 tablets) dropped
 by 85.7%. “4+7” winning products covered original branded drugs and generic drugs
 that had passed consistency evaluation of quality and efficacy, which had large clinical
 demand and quality assurance. Thus, the decline in drug prices might effectively allevi-
 ate the medication burden of patients.
 According to the cross-price elasticity theory, in a group of drugs with substitution
 relationship, the percentage change in quantity demanded for one product in response to
 a percentage change in price of another product [14, 15]. With the announcement of "4+7"
 bid winning results, pharmaceutical enterprises related to winning products made ad-
 justments in pricing strategy and sales model [29]. It is reported that enterprises of
 non-winning products lowered the prices consciously to save the market [30]. In the
 present study, we found that the FP of non-winning products dropped by 11.96% after
 "4+7" policy in Shenzhen and showed statistically significant. Previous studies reported
 similar findings [18, 31]. Zhang & Wang [31] found that the price of non-winning anti-
 hypertensive drugs showed a gradient decline, with the fall ranging from 1% to 52%.
 Yang et al. [18] reported that the prices of three non-winning antidepressant drugs
 dropped by 12.67% on average. These findings indicated that the implementation of
 NCDP policy was conducive to improve market competitiveness and reshaping the
 competitive pattern of the pharmaceutical industry. However, ITS results of this study
 showed that there was no statistical difference in the changes of DPI slope of
 non-winning products between the pre- and post-”4+7” policy periods, indicating that
 the price reduction of non-winning products might just be a temporary response of
 pharmaceutical enterprises during the implementation of policy.
 In this study, the FP of alternative products fell slightly by 4.34% in Shenzhen, while
 ITS analysis showed no statistical difference. Chen et al. [17] and Yang et al. [18] reported
 consistent results as this study. On the one hand, the price of alternative drugs did not
 change significantly (such as price increase) during the implementation of “4+7” policy,
 indicating that the national monitoring did play an important role [32]. On the other
 hand, this study indicated that the effect of price reduction triggered by 25 CP drugs was
 limited, and could not make a further impact on the market pattern. Furthermore, this
 study also found that the DPI slope of alternative products dropped markedly after the
 implementation of “4+7” policy, indicating that the policy might help slow the growth of
 alternative drug prices and reduce the burden of patients.
 Several potential limitations should be mentioned regarding the present study.
 Firstly, this study designed a single-group ITS by using the drug purchasing data in
 Shenzhen, and potential confounding factors other than NCDP might not be controlled,
 so there may be some bias in the results. Secondly, only one of the 11 pilot cities was in-
 cluded in the study (i.e. Shenzhen City), the results of this study may not fully represent
 the overall implementation effect of NCDP policy in China, caution should be exercised
 in generalizing the findings.

 5. Conclusions
 This study analyzed the impact of NCDP on the price of policy-related drugs in
 Shenzhen. The FP of 25 winning products notably decreased by 79.02%. Under the NCDP
 policy, the market behavior of pharmaceutical enterprises of policy-related drugs
 changed. The FP of non-winning products dropped by 11.96% after the implementation of
 the policy, while the long-term trend of price reduction was not observed. In terms of
 alternative drugs, the price reduction at the start of the implementation of “4+7” policy
 had no statistical difference. However, a trend of price growth slowing down for alter-
 native drugs was observed in the post-”4+7” policy period. In the future, on the one
 hand, it is necessary to expand the scope of CP drugs, so as to trigger the linkage effect of
 price reduction in a larger scope and to a greater extent. On the other hand, it is essential
 to strengthen the continuous monitoring of changes in the price and consumption
 structure of policy-related drugs, ensuring the accessibility and rationality of medications
 for patients.
Preprints (www.preprints.org) | NOT PEER-REVIEWED | Posted: 6 April 2021 doi:10.20944/preprints202104.0157.v1

 Author Contributions: Conceptualization, Y.Y. and D.C.; methodology, N.W. and Y.Y.; software,
 Y.Y.; formal analysis, N.W. and Y.Y.; investigation, N.W., Y.Y., L.X. and Z.M.; resources, Z.M. and
 D.C.; data curation, Y.Y. and Z.M.; writing—original draft preparation, N.W., Y.Y. and L.X.; writ-
 ing—review and editing, N.W., Y.Y., L.X., Z.M. and D.C.; supervision, Z.M. and D.C.; project ad-
 ministration, D.C.; funding acquisition, Z.M. and D.C. All authors have read and agreed to the
 published version of the manuscript.
 Funding: This work was supported by the Global Health Institute, Wuhan University, China. The
 role of the funding body included designing the study, the analysis and interpretation of data, and
 writing the manuscript.
 Institutional Review Board Statement: Not applicable.
 Informed Consent Statement: Not applicable.
 Conflicts of Interest: The authors declare no conflict of interest.

 Appendix A

 Table A1. List of included drugs in this study.

 Drug Group Varieties
 irbesartan and hydrochlorothiazide, irbesartan, losartan, montmoril-
 lonite, entecavir, cefuroxime, pemetrexed, atorvastatin, imatinib,
 CP drugs olanzapine, escitalopram, fosinopril, enalapril, montelukast, rosu-
 vastatin, lisinopril, risperidone, paroxetine, gefitinib, levetiracetam,
 clopidogrel, dexmedetomidine, tenofovir, amlodipine, flurbiprofen
 adefovir, aspirin, oxcarbazepine, valproate, quetiapine, carbamaze-
 pine, captopril, lamivudine, risperidone, nilotinib, nitrendipine,
 cefprozil, cefaclor, cefixime, nifedipine, simvastatin, xuezhikang, ico-
 tinib, cefuroxime, chlorpromazine, haloperidol, fluoxetine, penflu-
 Alternative ridol, indomethacin, venlafaxine, perphenazine, sulpiride, cefalexin,
 drugs cefdinir, afatinib, telmisartan, fluvastatin, candesartan, perindopril,
 sertraline, tiapride, lamotrigine, felodipine, aripiprazole, amlodipine
 and atorvastatin, valsartan, ticagrelor, losartan potassium and hy-
 drochlorothiazide, valsartan and amlodipine, perindopril and inda-
 pamide
 Note. CP, centralized purchased.

 References
 1. Parkinson, B.; Sermet, C.; Clement, F.; Crausaz, S.; Godman, B.; Garner, S.; Choudhury, M.; Pearson, SA.; Viney, R.; Lop-
 ert, R. et al. Disinvestment and Value-Based Purchasing Strategies for Pharmaceuticals: An International Review. Phar-
 macoeconomics 2015; 33:905-24. doi: 10.1007/s40273-015-0293-8.
 2. Smith, C. Retail Prescription Drug Spending In The National Health Accounts. Health Affairs 2004; 23:160-7. doi:
 10.1377/hlthaff.23.1.160.
 3. The IQVIA Institute. Global Medicine Spending and Usage Trends Outlook to 2024; 2020. Available online:
 https://www.iqvia.com/insights/the-iqvia-institute/reports/global-medicine-spending-and-usage-trends (accessed on
 January 11, 2021).
 4. National Health Commission. 2018 Statistical Bulletin of China's Health Development; 2020. Available online:
 http://www.gov.cn/guoqing/2020-04/29/content_5507528.htm (accessed on December 25, 2020).
 5. Zhai, T.; Zhang, Y.; Wan, Q.; Chai, P.; Guo, F.; Li, Y.; Wang, R.; Chen, C.; Li, T.; Gao, R. The Results and Analysis of Na-
 tional Health Accounts in China in 2018. Chinese Health Economics 2020; 39:5-8. doi: 10.7664/CHE20200601.
 6. National Health Development Research Center of the National Health Commission. 2018 China Total Health Expenditure
 Research Report. Beijing: Institute of health and economy press, 2018.
Preprints (www.preprints.org) | NOT PEER-REVIEWED | Posted: 6 April 2021 doi:10.20944/preprints202104.0157.v1

 7. Dylst, P.; Vulto, A.; Simoens, S. Tendering for outpatient prescription pharmaceuticals: what can be learned from current
 practices in Europe? Health Policy 2011; 101:146-52. doi: 10.1016/j.healthpol.2011.03.004.
 8. Seidman, G.; Atun, R. Do changes to supply chains and procurement processes yield cost savings and improve availabil-
 ity of pharmaceuticals, vaccines or health products? A systematic review of evidence from low-income and mid-
 dle-income countries. Bmj Glob Health 2017; 2:e243. doi: 10.1136/bmjgh-2016-000243.
 9. Mao, Z.; Shen, X.; Wang, Q. Retrospective study on drug's centralized purchasing system of healthcare institutions in
 China. Chinese Journal of Health Policy 2014; 7:5-10. doi: 10.3969/j.issn.1674-2982.2014.10.002.
 10. Zhang, R.; Qiao, J.; Mao, Z.; Cui, D. A Review on the Current Situation of Centralized Drug Procurement in China’s
 Public Medical Institutions. Chinese Journal of Pharmacoepidemiology 2019; 28:199-204
 11. General Office of the State Council of the People's Republic of China. Pilot Program for National Centralized Drug Pro-
 curement and Use; 2019. Available online: http://www.gov.cn/zhengce/content/2019-01/17/content_5358604.htm (accessed
 on January 9, 2021).
 12. General Office of the State Council of the People's Republic of China. Opinions on promoting the normalization and in-
 stitutionalization of centralized drug procurement; 2021. Available online:
 http://www.gov.cn/zhengce/content/2021-01/28/content_5583305.htm (accessed on March 25, 2021).
 13. Shanghai Joint Procurement Office. Announcement of the results of the planned selection of centralized drug procure-
 ment in 4+7 cities; 2018. Available online: http://www.smpaa.cn/gjsdcg/2018/12/07/8531.shtml (accessed on December 25,
 2020).
 14. Hursh, S.; Bauman, R. The behavioral analysis of demand. In: Green L, Kagel J, ^editors. Advances in behavioral eco-
 nomics: Ablex, Norwood, NJ, 1987:117-65.
 15. Hursh, SR. Behavioral economics of drug self-administration: an introduction. Drug and Alcohol Dependence 1993;
 33:165-72. doi: https://doi.org/10.1016/0376-8716(93)90058-X.
 16. Wang, H.; Li, X.; Chen, J. Impact of "4+7" City Drug Centralized Procurement Program on the utilization of original and
 generic cardiovascular drugs in a tertiary hospital. Journal of Pharmaceutical Practice 2020; 38:373-8. doi:
 10.12206/j.issn.1006-0111.202001054.
 17. Chen, L.; Yang, Y.; Luo, M.; Hu, B.; Yin, S.; Mao, Z. The Impacts of National Centralized Drug Procurement Policy on
 Drug Utilization and Drug Expenditures: The Case of Shenzhen, China. Int J Environ Res Public Health 2020; 17. doi:
 10.3390/ijerph17249415.
 18. Yang, Q.; Guo, W.; Liu, S. Effects of procuring with target quantity on using antipsychotics at a hospital. Chinese Journal of
 Hospital Pharmacy 2020:1-6. doi: 10.13286/j.1001-5213.2021.04.13.
 19. Ye, S.; Kang, Q.; Gao, J.; Chen, Q.; Hu, S.; Cai, H.; Ding, R. Study of Drug Price Index in Evaluating Implementation Effect
 of "4+7" Drug Centralized Procurement Policy in Fujian. China Health Insurance 2020:35-9. doi:
 10.19546/j.issn.1674-3830.2020.8.008.
 20. Ma, F.; Wu, J. Methodological selection strategy analysis on medicine price index. Chinese Journal of Health Policy 2015;
 8:61-7. doi: 10.3969/j.issn.1674-2982.2015.07.010.
 21. Chen, B.; Hao, Y.; Dong, C.; Sun, L. A study on the application of drug price index in health insurance payment standard.
 Chinese Journal of Health Policy 2016; 9:38-42. doi: 10.3969/j.issn.1674-2982.2016.06.008.
 22. Chen, W.; Cheng, X. Discussion on the methodology of drug price index. Chinese Health Economics 1995:29-31
 23. WHO Collaborating Centre for Drug Statistics Methodology. Guidelines for ATC classification and DDD assignment
 2021; 2021. Available online: http://www.whocc.no (accessed on March 6, 2021).
 24. Jandoc, R.; Burden, AM.; Mamdani, M.; Lévesque, LE.; Cadarette, SM. Interrupted time series analysis in drug utilization
 research is increasing: systematic review and recommendations. Journal of Clinical Epidemiology 2015; 68:950-6. doi:
 10.1016/j.jclinepi.2014.12.018.
Preprints (www.preprints.org) | NOT PEER-REVIEWED | Posted: 6 April 2021 doi:10.20944/preprints202104.0157.v1

 25. Lagarde, M. How to do (or not to do) ... Assessing the impact of a policy change with routine longitudinal data. Health
 Policy and Planning 2011; 27:76-83. doi: 10.1093/heapol/czr004.
 26. Wagner, AK.; Soumerai, SB.; Zhang, F.; Ross-Degnan, D. Segmented regression analysis of interrupted time series studies
 in medication use research. J Clin Pharm Ther 2002; 27:299-309. doi: 10.1046/j.1365-2710.2002.00430.x.
 27. Chang, F. Analysis on the core elements of centralized drug procurement. Chinese Health Resources 2021:1-5. doi:
 10.13688/j.cnki.chr.2021.200774.
 28. Tan, Q.; Yang, S.; Li, W.; Zhang, W. Effects, Key issues and Countermeasures of "4+7" Drug Volume-Based Purchasing—
 Practice Based on Guangzhou. Health Economics Research 2020; 37:46-50. doi: 10.14055/j.cnki.33-1056/f.2020.04.027.
 29. Tan, Z.; Fan, S. Challenges and Countermeasures of Pharmaceutical Enterprises under the Background of Centralized
 Purchasing of Drugs . Health Economics Research 2019; 36:13-5. doi: 10.14055/j.cnki.33-1056/f.2019.08.004.
 30. Mao, Z.; Yang, Y.; Chen, L. Reform of Drug Supply and Guarantee System in China: Policy Measures and Effects. In:
 Wang C, Liang W, ^editors. Development Report on Health Reform in China (2020): Beijing: Social Sciences Academic
 Press, 2020:96-123.
 31. Zhang, Y.; Wang, M. Analysis of the influence of “4+7” on the use of ACEI antihypertensive drugs. Journal of Hunan Nor-
 mal University(Medical Sciences) 2021; 18:189-92
 32. Wang, Y.; Wu, Z. Keypoint Analysis of Monitoring Plan for Centralized Drug Purchase and Use Project Pilot Launched
 Organized by State. China Pharmacy 2019; 30:2317-22. doi: 10.6039/j.issn.1001-0408.2019.17.03.
You can also read