Influence of light intensity and photoperiod on energy efficiency of biomass and pigment production of Spirulina (Arthrospira platensis)
←
→
Page content transcription
If your browser does not render page correctly, please read the page content below

OCL 2021, 28, 37
© N.U.F. Niangoran et al., Published by EDP Sciences, 2021
https://doi.org/10.1051/ocl/2021025                                                                                                      OCL
                                                                                                                                          Oilseeds & fats Crops and Lipids

                                                                                                                                    Available online at:
                                                                                                                                    www.ocl-journal.org

    RESEARCH ARTICLE / ARTICLE                     DE RECHERCHE

Influence of light intensity and photoperiod on energy efficiency of
biomass and pigment production of Spirulina (Arthrospira
platensis)☆
N’goran Urbain Florent Niangoran1,2,*, David Buso1, Georges Zissis1 and Thomas Prudhomme3
1
  LAboratoire PLAsma et Conversion d’Energie (LAPLACE), UPS, Université de Toulouse, 118 route de Narbonne, 31062 Toulouse
Cedex 9, France
2
  Laboratoire de Physique Fondamentale et Appliquée (LPFA), Université Nangui Abrogoua, 02 BP 801, Abidjan 02, Côte d’Ivoire
3
  Biosentec, 48 Chemin des Palanques Sud, 31120 Portet-sur-Garonne, France

             Received 30 March 2021 – Accepted 21 June 2021

             Abstract – Biomass and photosynthetic pigments production of cyanobacteria, in particular Spirulina
             (Arthrospira platensis), depend on light intensity. Production cost of Spirulina cultivation in photobioreactor
             illuminated with LED is strongly related to light cost. This work is aimed to evaluate the effects of light intensity
             and photoperiod on the energy efficiency of biomass and pigment production of Spirulina platensis UTEX
             1926. Cultures illuminated with white light-emitting diodes (LED) were carried out in batch mode cultivation.
             Three lighting scenarios with different light intensities were tested: two with a constant light intensity at 80 and
             160 mmol · m2 · s1 and one with modulated light intensity. Concerning photoperiod, three cycles of light:dark
             (h:h) (24:00, 20:04 and 16:08) were studied under light intensity at 160 mmol · m2 · s1. Concerning Spirulina
             biomass and pigment production (phycocyanin, chlorophyll and carotenoids), it is found that the lower intensity
             tested allows a substantial increase of the process energy efficiency. Concerning the influence of the
             photoperiod, it has been found that the longer the off time is (up to 08 h 00 a day), the higher is the energy
             efficiency for Spirulina biomass as well as for pigmentary production.

             Keywords: LED lighting / photoperiod / Spirulina cultivation / phycocyanin / carotenoids

             Résumé – Influence de l’intensité lumineuse et de la photopériode sur l’efficacité énergétique de la
             biomasse et la production de pigments de Spiruline (Arthrospira platensis). La production de biomasse
             et de pigments photosynthétiques à partir des cyanobactéries, en particulier la Spiruline, dépend de l’intensité
             lumineuse. Le coût de production de la culture de la Spiruline dans un photobioréacteur éclairé par des LED est
             fortement lié au coût de la lumière. Ce travail vise à évaluer les effets de l’intensité de la lumière et de la
             photopériode sur l’efficacité énergétique de la biomasse et de la production de pigments de Spiruline platensis.
             Les cultures éclairées avec des diodes électroluminescentes blanches (LED) ont été réalisées en mode batch.
             Trois scénarios d’éclairage avec des intensités lumineuses différentes ont été testés : deux avec une intensité
             lumineuse constante à 80 et 160 mmol · m2 · s1 et un avec une intensité lumineuse modulée. Concernant la
             photopériode, trois cycles de lumière : obscurité (h:h) (24:00, 20:04 et 16:08) ont été étudiés sous une intensité
             lumineuse à 160 mmol · m2 · s1. Concernant la biomasse de Spiruline et la production de pigments
             (phycocyanine, chlorophylle et caroténoïdes), on constate que la plus faible intensité lumineuse testée permet
             d’augmenter considérablement l’efficacité énergétique du procédé. Concernant l’influence de la photopériode,
             il a été constaté que plus le temps de non-éclairage est long (jusqu’à 08 h 00 par jour), plus l’efficacité
             énergétique est élevée pour la biomasse de Spiruline ainsi que pour la production de pigments.

             Mots clés : éclairage LED / photopériode / Culture Spiruline / phycocyanine / caroténoïdes

☆
   Contribution to the Topical Issue “Green and white biotechnologies in the fields of lipids and oil- and protein crops / Biotechnologies vertes et
blanches dans les domaines des lipides et oléoprotéagineux”.
*Correspondence: niangoran@laplace.univ-tlse.fr; urbain_niangoran@yahoo.fr

This is an Open Access article distributed under the terms of the Creative Commons Attribution License (https://creativecommons.org/licenses/by/4.0), which permits
                           unrestricted use, distribution, and reproduction in any medium, provided the original work is properly cited.
N.U.F. Niangoran et al.: OCL 2021, 28, 37

                                                                    can provide a wider and cheaper range of high benefit products
                                                                    obtained from microalgae biomass. In this respect, LED
        Highlights                                                  lighting technologies are in vogue compared to conventional
    *   Energy efficiency of Spirulina platensis biomass and         technologies (halogen lamp, fluorescent lamp lamps, high-
        pigment production (carotenoids, chlorophyll and            pressure sodium lamp, etc.). The main reasons are its
        phycocyanin) is strongly related to light (including        monochromatic spectrum and dimmable intensity. These
        light intensity and photoperiod).                           characteristics of LEDs are their main assets compared to
    *   Energy savings is achieved while preserving high            other light sources. Indeed, these make it possible to evaluate
        production rate for both biomass and pigments by            efficiency of dimmed lighting for microalgae cultivation. In
        adjusting light level as cell concentration increases.      addition, cultures of microalgae cultivation are generally
                                                                    carried out under constant light intensity. Modulation of light
                                                                    intensity according to the cell density of Spirulina could be
                                                                    promising. Thus, this lighting technique could make it possible
1 Introduction                                                      to save electrical energy. Moreover, a long lifetime and a high
                                                                    electrical efficiency of LED minimize heat generation. Their
    Microalgae are potential sources of biomass production.         low heat production makes it possible to bring them closer to
They have many and various applications including food and          the crop, thus increasing the path of light. Finally, their small
feed, cosmetic and pharmaceutical industry. In addition, these      sizes allow them to be integrated practically in all growth
microorganisms are considered as a promising source of              systems, especially photobioreactors.
biofuels (Becker, 2007; Carvalho et al., 2011; Blanken et al.,           Several research works show the efficiency of LED
2013). Among the valuable microalgae, we can mention                lighting in microalgae culture including Spirulina (Schulze
Spirulina. Indeed, Spirulina can contain 60 to 70% of proteins      et al., 2014; Glemser et al., 2016). They also indicate that light
in dry weight. It is rich in vitamins, especially vitamins B12,     intensity, spectrum and photoperiod have considerable effects
provitamin A and minerals, in particular iron (Bezerra et al.,      on growth and biochemical composition (in particular pigment
2011). Incorporating Spirulina biomass into food helps to           contents) of Spirulina. Light intensity and spectrum are thus
increase its nutritional value (Koru, 2012). It is an important     key factors that can be tuned to match the whole or a particular
source of valuable pigments like chlorophyll a (Chl-a),             absorption band to act on quantity and/or quality production of
carotenoids and phycobiliproteins (especially phycocyanin           biomass and pigments. It is commonly accepted that red and
(Phy)) (Boussiba and Richmond, 1980). Phycocyanin is a very         white lights promote high quantities of biomass while high
important pigment because it may be used in many                    intensity light and blue light enhance phycocyanin production.
applications. In the food industry, it is used as a natural blue    Literature also mentions that green light is harmful for
food colouring. In biotechnology field, it serves as a               pigments production except phycocyanin. Moreover, for light
fluorescent marker. It has neuroprotective, anti-inflammatory         intensities lower than the saturation and photo-inhibition
and antioxidant properties (Bhat and Madyastha, 2000; Romay         lights, biomass quantity increases with light quantity (Pareek
et al., 2003). As for chlorophyll, in addition to its health        and Srivastava, 2001; Madhyastha and Vatsala, 2007;
benefits (antioxidant, anti-inflammatory, antimutagenic, and          Madhyastha et al., 2009; Chen et al., 2010; Kumari et al.,
antimicrobial properties) (Galasso et al., 2019), it is also used   2015; Tian et al., 2018). However, process energy efficiency is
as a colouring. Among the sources of chlorophyll production         still an issue and has not been extensively discussed yet. The
(plants, microalgae, etc.), Spirulina presents one of the highest   aim of this work is to investigate, in terms of energy efficiency
chlorophyll content (Koru, 2012). Finally, Spirulina also           and productivity, biomass production and photosynthetic
contains carotenoids (known for its antioxidant effects) with a     pigment contents in Spirulina platensis under different light
prominent amount of b-carotene (67 to 79% in carotenoids            intensities, including dimmed light conditions and different
pigment group). Consuming carotenoids in form of provitamin         photoperiods.
A or b-carotene improves the immune system and reduces the
risk of developing chronic degenerative diseases, cardiovas-
cular diseases and certain types of cancer (Rodríguez-              2 Materials and methods
Concepcíon et al., 2018).                                           2.1 Microorganism and culture conditions
    Microalgae can be cultured by different methods of
nutrient supply for their growth: autotrophic, heterotrophic,           Spirulina species used in this study was Arthrospira
mixotrophic and photoautotrophic (Chojnacka and Noworyta,           platensis (UTEX 1926) and was grown in Zarrouk medium
2004). The photoautotrophic or mixotrophic growth of                (Zarrouk, 1966). The strain culture was grown in cylindrical
microalgae requires CO2 and light for the realization of            tanks of 60 L at 28 °C with continuous illumination at
photosynthesis. Light energy can be provided by natural             200 mmol · m2 · s1 provided by warm white (3000 K) LED
lighting (sun) or artificial lighting (lamps). In controlled         tube lamp (MAS LEDtube HF 600 mm HE 8W 830 T5 from
growing environments such as indoor bioreactors, the use of         Philips). The light intensity corresponds to the photosynthetic
artificial light is obligatory. Artificial lighting generally gives   photon flux density (PPFD). PPFD is a light measuring system
the possibility of controlling light intensity and the lighting     that best responds to the study of light action in photosynthetic
time. Although artificial lighting can increase productivity, it     activity because it takes into account relative quantum
also generates additional costs. Thus, optimal use in terms of      efficiency (RQE) (McCree, 1971). Photometry is not suitable
photosynthesis, energy efficiency and spectral composition           because it is based on the sensitivity to light of human eye

                                                             Page 2 of 8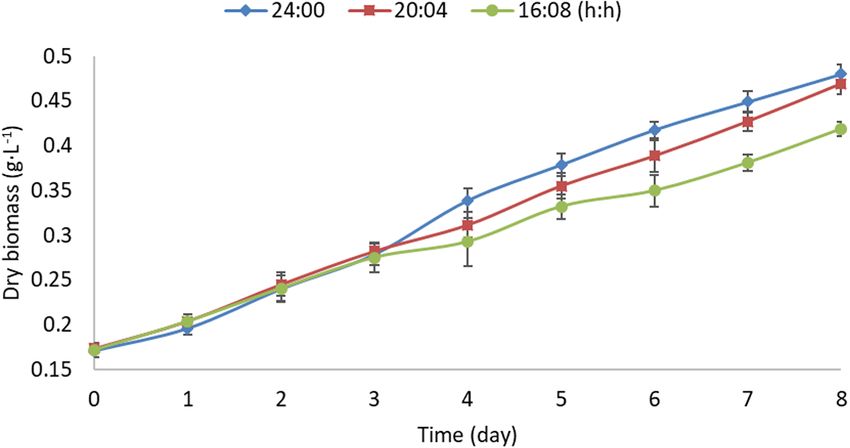
N.U.F. Niangoran et al.: OCL 2021, 28, 37

which differs from that of plants (Biggs, 1986). This lamp has                                DWn  DWw
been modified to be dimmable. Strain culture is agitated by a                             h¼             ·V;                    ð3Þ
                                                                                                T·Ee
circulating pump. For inoculation, we took a certain amount of
the strain culture, and filtered it by a 30 mm strainer, then       where DW0 and DWn are respectively the dry weights of
diluted the S. platensis with Zarrouk. Photoautotrophic            biomass on initial and nth day of cultivation, V (L) is volume
cultures were made in cylindrical tanks of 25 L in batch           of culture and Ee (kWh) is electrical energy consumed by
mode. In addition, they were illuminated with LED lamps            LEDs during cultivation time T(days).
(Maxline70 Warm white LED strip from lumitronix). The
value of photosynthetic photon flux density (PPFD) was              2.2.2 Pigments quantification
measured by the spectroradiometer Specbos 1201. Cultures
were agitated with circular pumps (LAGUNA pump with a                  Chlorophyll a and carotenoids were assayed using the
flow velocity of 5000 L/h). Thermostats (NICREW aquarium            method of Lichtenthaler (1987). The 1.8 mL of microalgae
heater 100 W) were used to keep the cultures at 28 °C.             solution was centrifuged at 10 000  g for 15 min. After
    Regarding the influence of light intensity modulation on        discarding the supernatant, 1.8 mL of 99.8% methanol solution
Spirulina growth and pigment contents, three lighting              was added to fresh biomass, mixed well and incubated at 4 °C
scenarios were tested:                                             for 24 h in darkness. Then, sample was exposed at room
 – scenario 1: constant light intensity at 80 mmol · m2 · s1;    temperature for 4 h in darkness. Finally, it was homogenized
 – scenario 2: constant light intensity at 160 mmol · m2 · s1;   during 2 min by ZX3 Vortex Agitator at 2000 tr/min. Then, it
 – scenario 3: modulated light intensity illumination              was centrifuged at 20 °C, 4000  g for 10 min before spectro-
    (80 mmol · m2 · s1 during two first days and                  photometric measuring. The Chl-a and carotenoids concentrations
    160 mmol · m2 · s1 afterwards).                              were calculated according to equations (4) and (5):

    Regarding the photoperiods, we examined three light:dark              Chl  a mg·L1 ¼ 16:72  A665  9:16  A652 ; ð4Þ
(h:h) cycles: 24:00, 20:04 and 16:08 under light intensity at
160 mmol · m2 · s1.

    Measurements were performed in triplicate and results           Carotenoid mg·L1 ¼ ð1000  A470  1:63  Chl  aÞ=221;
were expressed as mean ± 95% confidence interval, i.e.:
m ± ts/sqrt(n) where m is the mean of the n values (n = 3),                                                                    ð5Þ
s is the estimated standard deviation and t is given by the
Student–Fisher distribution for 95% of confidence interval and      where A665, A652 and A470 are the absorbance readings at 665,
a degree of freedom of n – 1.                                      652 and 470 nm.
                                                                       Phycocyanin was determined according to Bennett and
                                                                   Bogorad (1973). As for Chl-a and carotenoids, 1.8 mL of
2.2 Biomass analysis                                               microalgae cells was centrifuged at 10 000  g for 15 min.
                                                                   After discarding the supernatant, 1.8 mL of 1.5% CaCl2 (W/V)
    Spirulina platensis Biomass was determined by measuring
                                                                   solution was added to fresh biomass. Four freeze/thawing
the optical density (OD) at 600 nm using UV/Visible/IR
                                                                   cycles were performed on fresh biomass (incubation at 20 °C
spectrophotometer (Spectronic 20 GeneisSYS, Spectronic
                                                                   for 24 h in darkness followed by 4 h in darkness at room
Instruments, USA). Then a linear equation was established
                                                                   temperature). Finally, it was homogenized during 2 min by
between biomass dry weight (DW, g · L-1) and the optical
                                                                   ZX3 Vortex Agitator at 2000 tr/min and centrifuged at 20 °C,
density at 600 nm. It follows the same protocol as Lee et al.
                                                                   4000  g for 10 min before spectrophotometric measuring.
(2016).
                                                                   The Phy concentration was calculated according to
                                                                   equation (6):

2.2.1 Kinetic and others parameters                                         Phy g·L1 ¼ ðA615  0:474  A652 Þ=5:34;         ð6Þ
    Arthrospira platensis specific growth rate m (day1) is
calculated during the 8 days of cultivation according to           where A615 is the optical density at 615 nm.
equation (1) (Wang et al., 2007):                                     The calculated pigment contents are those of the eighth
                                                                   day.
                       lnðDW2 Þ  lnðDW1 Þ
                 m¼                        ;                ð1Þ
                            t2  t1                                3 Results and discussion
where DW2 and DW1 are the dry weights of biomass on days t2        3.1 Effect of modulated light intensity on Spirulina
and t1, respectively.                                              growth and pigment content
     We calculated biomass production P (mg · L1 · day1)         3.1.1 Biomass production
(Eq. (2)) (Wang et al., 2007) and energy efficiency ɳ
(g · day1 · kWh1) of electrical energy to biomass production         Light is the basic source of energy and an important factor
(Eq. (3)):                                                         of photosynthesis for the cellular multiplication of microalgae.
                                                                   In photoautotrophic regime, light is essential for microalgae
                              DWn  DWw0                           growth (Wahidin et al., 2013). In the present work, no light
                  P ¼ 1000·              ;                  ð2Þ
                                  T                                inhibition was found for the range of intensities tested.

                                                            Page 3 of 8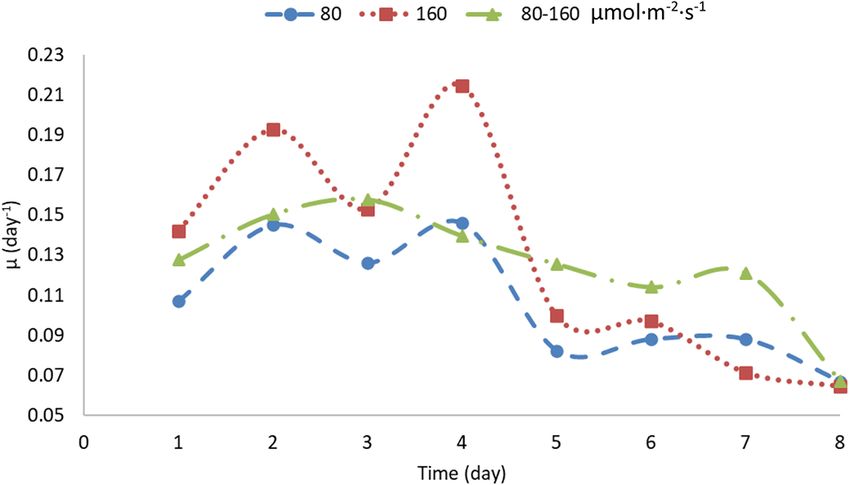
N.U.F. Niangoran et al.: OCL 2021, 28, 37

Fig. 1. Biomass produced of Arthrospira platensis growth according       Fig. 2. Growth rates of Arthrospira platensis growth according to the
to the three lighting scenarios.                                         three lighting scenarios.

It should also be noted that for each scenario, no lag phase has             These observations suggest that dynamically increasing
been observed. This is consistent with the fact that the lag             light intensity as cell concentration increases may be a
phase duration depends essentially on culture medium and not             promising option for energy savings. Indeed, this type of
on light conditions. According to the differences of the culture         lighting makes it possible to illuminate culture during first days
medium with the inoculum culture medium, this phase may be               with low light intensities without negatively impacting
observed.                                                                Spirulina growth. Also, it could make it possible to avoid
     Figures 1 and 2 illustrate observations of the cell growth of       using saturation light. With intensities of saturation lights,
Spirulina platensis for the three scenarios described above for          lighting is not optimal because their photosynthetic yields are
8 days of cultivation. The lowest biomass production                     identical (Qiang et al., 1998).
was obtained with scenario 1 (constant light intensity at                    Table 1 presents the average growth rate values, biomass
80 mmol · m2 · s1), while the highest was obtained in runs             productivities and energy efficiencies for different lighting
with scenario 2 (constant light intensity at 160 mmol · m2 · s1)       scenarios. Productivity and specific growth rate were maximal
and scenario 3 (modulated light intensity 80–160 mmol · m2 ·            for scenarios 2 and 3. Biomass productivities with scenarios 2
s1) (Fig. 1). This is in line with previous works where it was          and 3 are 35% higher than with scenario 1. However, the
demonstrated that specific growth rate of microalgae is                   highest energy efficiency is obtained for scenario 1. Actually,
proportional to light intensity, up to saturation levels (Qiang          there is a light intensity range (low PPFD range) for which
et al., 1998; Wang et al., 2007; Dubinsky, 2013; Rizzo et al.,           biomass productivity is proportional to light intensity
2015). For scenario 3, light intensity was changed from 80 to            (Chojnacka and Noworyta, 2004; Xue et al., 2011). We can
160 mmol · m2 · s1 after two days of cultivation to evaluate           assume here that at 160 mmol · m2 · s1, the light intensity is
how dynamic light intensity adjustment affects the Spirulina             near to or is a saturation intensity. Indeed, within the saturation
growth in terms of productivity and energy efficiencies. Indeed,          light range, photosynthetic activity is almost constant and a
up to days 2 a small growth gap between scenarios 1 and 2 can be         significant part of absorbed photons are not used (Qiang et al.,
observed and shows that it is not necessary to illuminate cultures       1998). Moreover, even if no photo-inhibition has been
at high light intensities at the beginning of cultivation.               observed at 160 mmol · m2 · s1, it is possible that this light
     It can be seen that the increase of light intensity does not have   intensity is high enough to create light stress at the start of
an immediate effect on Spirulina growth as there is no significant        culture according our inoculation concentration. This may
biomass increase up to day 4. These results suggest that there is a      cause a lower process energy efficiency. Indeed, an excess light
period of adaptation of cells to a change (especially an increase)       can occur when the ratio of PPFD to photosynthesis is high.
in light intensity (Danesi et al., 2004; Patel et al., 2019).            Thus, at a constant PPFD, this ratio is high at the beginning of
     It can also be observed that the growth rate in scenarios 1         the cultivation (low photosynthetic cell concentration) and
and 2 drops drastically down after four days of cultivation              decreases gradually for increasing cell concentration
while it decreases slowly and monotonically in scenario 3                (Demmig-Adams and Adams, 1992). Compared to scenario 2,
(Fig. 2). In scenarios 1 and 2, average growth rate between              the productivity obtained with scenario 3 is 5.93% lower but
days 1 and 4 passes respectively from 0.1311 and 0.1757 day1            energy efficiency is 7.92% higher. This result shows that
to 0.0814 and 0.0833 day1 between days 5 to 8 (drop of 38%              dynamically adjusting light intensity may be a good way to
and 52% respectively). For comparison in scenario 3 average              improve culture process efficiency while preserving high
growth rate passes from 0.1439 day1 to 0.1069 day1 (drop of            productivities. This principle has to be investigated in more
26%). The higher average growth rate between days 5 and 8                details and can be done for instance by continuously adjusting
explains that final dry biomass obtained with scenario 3 is only          the light intensity according to the optical density of the culture
4.18% lower than the one obtained with scenario 2.                       medium.

                                                                  Page 4 of 8
N.U.F. Niangoran et al.: OCL 2021, 28, 37
Table 1. Average growth rates, biomass productivities and energy efficiencies of three lighting scenarios.
Light intensity (mmol · m2 · s1) mav (day1) P (mg · L1 · day1) ɳ (g · day1 · kWh1)
80 0.1070 ± 0.0038 28.38 ± 0.82 1.48 ± 0.05
160 0.1295 ± 0.0008 38.63 ± 1.12 1.01 ± 0.03
80–160 0.1254 ± 0.0030 36.34 ± 0.20 1.09 ± 0.03
Fig. 4. Arthrospira platensis growth curves as a function of different
Fig. 3. Arthrospira platensis pigment content for three lighting photoperiods.
scenarios.
Table 2. Energy efficiencies of pigmentary production and light intensities.
Light intensity (mmol · m2 · s1) Energy efficiencies ɳ (mg · day1 · kWh1)
Chl-a Carotenoids Phy
80 1.27 ± 0.08 0.44 ± 0.03 8.254 ± 0.17
160 0.73 ± 0.04 0.24 ± 0.02 5.92 ± 0.32
80–160 0.83 ± 0.04 0.28 ± 0.03 5.86 ± 0.14
3.1.2 Pigment production photosynthetic activity because the capacity of absorption
To understand the relationships between pigment concen- and conversion of photons into chemical energy by chlorophyll
trations under different light intensities, chlorophyll, carote- remains, or even greatly increases. In addition, in the case of
noids and phycocyanin contents were measured and recorded, too strong and prolonged light intensity, photo-inhibition
as shown in Figure 2. We observed that light intensities have a causes destruction of photosynthetic pigments by photo-
more or less pronounced influence on the concentrations of the oxidation (Hendry et al., 1987; Alves et al., 2002). Finally, in
different pigments. some cases, the initiation of the xanthophylls cycle (pigment
For carotenoids and chlorophyll, the light intensity has a belonging to the carotenoids family) is then the main
limited effect. The lighting scenarios 1, 2 and 3 give protection which allows to dissipate the energy absorbed by
respectively 12.29, 11.48 and 12.09 mg · g1 of Chl content the chlorophylls at the PSII antenna in the form of heat.
per dry matter (Fig. 3). Concerning carotenoids concentration, Unlike the two previous pigments, effect of light intensity
the lighting scenario 1 provides slightly higher rates compared on phycocyanin concentration is more significant. Scenario 2
to scenarios 2 and 3 (respectively 13.52% and 9.02% more). It (constant light intensity at 160 mmol · m2 · s1) promotes a
is consistent with the results of Kumar et al. (2011). Other higher production of phycocyanin. The difference of
authors, such as Ravelonandro et al. (2008), Chen et al. (2010) phycocyanin content between scenarios 2 and 3 is 7.86 mg · g1
and Danesi et al. (2011), mentioned that they observed a (8.39%). This result is consistent with literature (Chen’v et al.,
decrease of chlorophyll and carotenoids concentration with an 1996; Chen et al., 2013) where it was observed that phycocyanin
increasing light intensity. Indeed, the increase of light intensity content increases with increasing light intensity.
induces a decrease in the photosystem concentration of the Energy efficiencies of the different scenarios are presented
thylakoid membrane and a decrease in the size of the in Table 2. We can observe that scenario 1 (i.e. constant
photosystem II (PSII). However, despite a decrease in the lighting intensity at 80 mmol · m2 · s1), gives the highest
chlorophyll content, we can observe an increase in energy efficiencies for pigments production. Overall, in terms
Page 5 of 8N.U.F. Niangoran et al.: OCL 2021, 28, 37
Table 3. Growth rates, biomass productivities and energy efficiencies following photoperiod.
Photoperiod (h:h) mmax (day1) P (g · L1 · day1) ɳ (g · day1 · kWh1)
24:00 0.1290 ± 0.0020 38.63 ± 1.13 1.01 ± 0.03
20:04 0.1244 ± 0.0025 36.96 ± 1.29 1.16 ± 0.04
16:08 0.1117 ± 0.0063 30.88 ± 1.47 1.21 ± 0.05
of chlorophyll a and carotenoids contents, the energy
efficiency is almost twice higher compared to other scenarios.
For phycocyanin scenario 1 is 1.4 times more efficient than
scenarios 2 and 3. There is no significant difference between
scenarios 2 and 3 in terms of energy efficiency for pigment
production.
3.2 Effect of photoperiod on Spirulina growth and
pigment content
3.2.1 Biomass production
Biomass concentration of S. platensis was evaluated for
different photoperiods during 8 days of cultivation for constant
light intensity at 160 mmol · m2 · s1 (Fig. 4). Maximum
biomass productivity i.e. 38.63 ± 1.13 g · L1 · day1 and Fig. 5. Arthrospira platensis pigment content for different photo-
minimum i.e. 30.88 ± 1.47 g · L1 · day1 were respectively period treatment.
observed at light/dark 24:00 and 16:08 (Tab. 3). We observed
that the higher the lighting time, the higher is the biomass
production (Fig. 4). However, photoperiod 24:00 gives the 3.2.2 Pigment production
lowest energy efficiency. Photoperiod 16:08 exhibits the
highest energy efficiency. As in this experiment light intensity The effect of three different photoperiods (24:0, 20:00 and
is the same, energy efficiency improvement comes from 16:08 light/dark) at light intensity 160 mmol · m2 · s1 on
duration of dark phase. Moreover, high photosynthetic pigment content of S. platensis for eight days of cultivation
efficiencies are achieved when light/dark cycle period period is presented in Figure 5. Minimum concentration
approaches turnover time of the photosynthetic unit (67.15 ± 2.91 mg · g1 of biomass dry weight) of phycocyanin
(Richmond et al., 2003; Amini Khoeyi et al., 2012; Liao was obtained for 20:04. Phycocyanin concentration is
et al., 2014). Photosynthesis is carried out in two stages: light improved by 39.95% with cycle 24:00 and by 32.12% with
reactions and dark reactions. In light reactions, cyanobacteria cycle 16:08. Lowest chlorophyll and carotenoids contents are
use light to break down water molecule. This reaction produces also obtained with the photoperiod 20:04. Maximum content of
chemical energy providing NADPH (nicotinamide adenine these two pigments are obtained with 16:08 light/dark cycles.
dinucleotide phosphate) and a highly energetic compound ATP These results are consistent with study of Pareek and
(adenine tri-phosphate). NADPH2 and TP are necessary, in Srivastava (2001) who observed the same behaviour. However,
particular, for the assimilation of inorganic nutrients. In dark differences between chlorophyll and carotenoids contents for
reactions or enzymatic reactions, cyanobacteria assimilate the photoperiods 24:0 and 16:08 light/dark are very small:
CO2 and produce carbohydrates, lipids (Wahidin et al., 2013). 0.13 mg · g1 for chlorophyll and 0.04 mg · g1 for carotenoids.
Thus, the dark reactions also occur during the lighting time Overall, a lighting time of 16 h is optimal for obtaining high
especially when the culture is constantly illuminated. Part of concentrations of photosynthetic pigments at high efficiency
the energy absorbed by the microalgae is therefore not used. (Tab. 4).
The dry biomass quantities after 8 days using photoperiods Table 4 shows energy efficiencies of pigment production as
24:00, 20:04 and 16:08 are 0.4800 ± 0.0110, 0.4690 ± 0.0115 a function of lighting time. We notice that lighting time of 16 h
and 0.4194 ± 0.0095 g · L1 respectively. It can be seen that allows to have the highest energy efficiency for all pigments.
biomass production from 24 and 20 h of lighting is almost
identical unlike a lighting time of 16 h. Similar results were 4 Conclusion
obtained in work on growth of Spirulina and other microalgae
(Pareek and Srivastava, 2001; Wahidin et al., 2013). In The effects of light intensity and photoperiod on biomass
addition, photoperiod 16:08 is respectively 1.20 and 1.04 times and pigment production of Spirulina platensis have been
more efficient than photoperiod 24:00 and 20:04. Besides, investigated. Absolute growth rates as well as energy
when the exposure time of Spirulina cultures is less than 16 h, efficiencies have been evaluated. While the highest produc-
the energy efficiency decreases and becomes almost constant tivity and specific growth rate is obtained for the highest light
after 16 h of lighting (Niangoran et al., 2018). Obtained results intensity (160 mmol · m2 · s1), the best energy efficiency is
show that the best compromise between biomass productivity obtained for the lowest light intensity (80 mmol · m2 · s1):
and energy efficiency for Spirulina growth is 20:04 h. this is true for biomass (energy efficiency is improved by 47%
Page 6 of 8N.U.F. Niangoran et al.: OCL 2021, 28, 37
Table 4. Energetic efficiencies of pigment production and photoperiod.
Photoperiod (h:h) Energy efficiencies ɳ (mg · day1 · kWh1)
Chl-a Carotenoids Phy
24:00 0.73 ± 0.05 0.23 ± 0.03 5.88 ± 0.10
20:04 0.59 ± 0.03 0.24 ± 0.03 4.93 ± 0.13
16:08 0.94 ± 0.03 0.31 ± 0.03 7.27 ± 0.20
while productivity is lowered by 28%) as well as for pigment Bhat VB, Madyastha KM. 2000. C-Phycocyanin: A potent peroxyl
production and more particularly for phycocyanin (energy radical scavenger in vivo and in vitro. Biochem Biophys Res
efficiency is increased by 39% while productivity is lowered Commun 275(1): 20–25.
by 16%). Biggs W. 1986. Radiation measurement. In: Gensler WG, ed.
It has also been shown that applying a light intensity step Advanced agricultural instrumentation. Dordrecht (Netherlands):
after two days of cultivation improves the process energy Springer, pp. 3–20.
efficiency while preserving high productivities for biomass. Blanken W, Cuaresma M, Wijffels RH, Janssen M. 2013. Cultivation
The positive effect of light intensity change on process energy of microalgae on artificial light comes at a cost. Algal Res 2(4):
333–340.
efficiency for pigments production is not as significant than for
Boussiba S, Richmond AE. 1980. C-phycocyanin as a storage protein
biomass production. Nevertheless the principle of dynamically
in the blue-green alga Spirulina platensis. Arch Microbiol 125
adjusting light intensity according for instance the optical (1-2): 143–147.
density of the culture medium is promising and has to be Carvalho AP, Silva SO, Baptista, JM, Malcata FX. 2011. Light
investigated in more details. requirements in microalgal photobioreactors: An overview of
Concerning photoperiod, results show that while biomass biophotonic aspects. Appl Microbiol Biotechnol 89(5): 1275–
productivity and growth rate decrease with the illumination 1288.
time, the process energy efficiency increases. As light intensity Chen HB, Wu JY, Wang CF, et al. 2010. Modelling on chlorophyll a
was constant during these experiments, energy efficiency and phycocyanin production by Spirulina platensis under various
improvement is attributed to biomass created during the dark light-emitting diodes. Biochem Eng J 53(1): 52–56.
phase. The best compromise between energy efficiency and Chen CY, Kao PC, Tsai CJ, Lee DJ, Chang JS. 2013. Engineering
productivity for biomass is obtained for a cycle of 20:04. For strategies for simultaneous enhancement of C-phycocyanin
pigment production and more particularly phycocyanin, 16:08 production and CO2 fixation with Spirulina platensis. Bioresour
cycle provides the best energy efficiency. Technol 145: 307–312.
Chen’v F, Zhang Y, Guo S. 1996. Growth and phycocyanin formation
Acknowledgements. The authors acknowledge the Occitanie of Spirulina platensis in photoheterotrophic culture. Biotechnol
Region for its financial support through its regional develop- Lett 18(5): 603–608.
ment fund FEDER/ERDF (GREENALG projects). Chojnacka K, Noworyta A. 2004. Evaluation of Spirulina sp. growth
in photoautotrophic, heterotrophic and mixotrophic cultures.
Conflicts of interest. The authors declare that they have no Enzyme Microb Technol 34(5): 461–465.
known competing financial interests or personal relation- Danesi EDG, Rangel-Yagui CO, Carvalho JCM, Sato S. 2004. Effect
ships that could have appeared to influence the work of reducing the light intensity on the growth and production of
reported in this paper. chlorophyll by Spirulina platensis. Biomass Bioenergy 26(4):
329–335.
Danesi EDG, Rangel-Yagui CO, Sato S, Carvalho JCM. 2011.
References Growth and content of Spirulina platensis biomass chlorophyll
cultivated at different values of light intensity and temperature
Alves PLDCA, Magalhães ACN, Barja PR. 2002. The phenomenon using different nitrogen sources. Braz J Microbiol 42(1): 362–
of photoinhibition of photosynthesis and its importance in 373.
reforestation. Bot Rev 68(2): 193–208. Demmig-Adams B, Adams WW. 1992. Photoprotection and other
Amini Khoeyi Z, Seyfabadi J, Ramezanpour Z. 2012. Effect of light responses of plants to high light stress. Ann Rev Plant Physiol
intensity and photoperiod on biomass and fatty acid composition Plant Mol Biol 43(1): 599–626.
of the microalgae, Chlorella vulgaris. Aquac Int 20(1): 41–49. Dubinsky Z. 2013. Photosynthesis. InTech. https://doi.org/10.5772/
Becker EW. 2007. Micro-algae as a source of protein. Biotechnol Adv 56742.
25(2): 207–220. Galasso C, Gentile A, Orefice I, et al. 2019. Microalgal derivatives as
Bennett A, Bogorad L. 1973 Complementary chromatic adaptation in potential nutraceutical and food supplements for human health:
a filamentous blue-green alga. J Cell Biol 58(2): 419–435. A focus on cancer prevention and interception. Nutrients 11(6):
Bezerra RP, Montoya EYO, Sato S, Perego P, de Carvalho JCM, 1226.
Converti A. 2011. Effects of light intensity and dilution rate on the Glemser M, Heining M, Schmidt J, et al. 2016. Application of light-
semicontinuous cultivation of Arthrospira (Spirulina) platensis. emitting diodes (LEDs) in cultivation of phototrophic microalgae:
A kinetic monod-type approach. Bioresour Technol 102(3): 3215– Current state and perspectives. Appl Microbiol Biotechnol 100(3):
3219. 1077–1088.
Page 7 of 8N.U.F. Niangoran et al.: OCL 2021, 28, 37
Hendry GAF, Houghton JD, Brown SB. 1987. The degradation of Qiang H, Zarmi Y, Richmond A. 1998. Combined effects of light
chlorophyll-a biological enigma. New Phytologist 107(2): 255– intensity, light-path and culture density on output rate of Spirulina
302. platensis (Cyanobacteria). Eur J Phycol 33(2): 165–171.
Koru E. 2012. Earth food Spirulina (Arthrospira): Production and Ravelonandro PH, Ratianarivo DH, Joannis-Cassan C, Isambert A,
quality standards. In: El-Samragy Y, ed. Food additive. InTech, Raherimandimby M. 2008. Influence of light quality and intensity
pp. 191–202. in the cultivation of Spirulina platensis from Toliara (Mada-
Kumar M, Kulshreshtha J, Singh GP. 2011. Growth and biopigment gascar) in a closed system. J Chem Technol Biotechnol 83(6):
accumulation of cyanobacterium Spirulina platensis at different light 842–848.
intensities and temperature. Braz J Microbiol 42(3): 1128–1135. Richmond A, Cheng-Wu Z, Zarmi Y. 2003. Efficient use of strong
Kumari A, Pathak AK, Guria C. 2015. Effect of light emitting diodes light for high photosynthetic productivity: Interrelationships
on the cultivation of Spirulina platensis using NPK-10:26:26 between the optical path, the optimal population density and cell-
complex fertilizer: Spirulina growth in NPK fertilizer & LED. growth inhibition. Biomol Eng 20(4-6): 229–236.
Phycolog Res 63(4): 274–283. Rizzo RF, dos Santos BDNC, de Castro GFPDS, et al. 2015.
Lee SH, Lee JE, Kim Y, Lee SY. 2016. The production of high purity Production of phycobiliproteins by Arthrospira platensis under
phycocyanin by Spirulina platensis using light-emitting diodes different lightconditions for application in food products. Food
based two-stage cultivation. Appl Biochem Biotechnol 178(2): Sci Technol (Campinas) 35(2): 247–252.
382–395. Rodríguez-Concepcíon M, Avalos J, Bonet ML, et al. 2018. A global
Liao Q, Li L, Chen R, Zhu X. 2014. A novel photobioreactor perspective on carotenoids: Metabolism, biotechnology, and
generating the light/dark cycle to improve microalgae cultivation. benefits for nutrition and health. Progr Lipid Res 70: 62–93.
Bioresour Technol 161: 186–191. Romay C, Gonzalez R, Ledon N, Remirez D, Rimbau V. 2003. C-
Lichtenthaler HK. 1987. Chlorophylls and carotenoids: Pigments of Phycocyanin: A Biliprotein with Antioxidant, Anti-Inflammatory
photosynthetic biomembranes. Meth Enzymol 148: 350–382. and Neuroprotective Effects. Curr Protein Peptide Sci 4(3): 207–
Madhyastha HK, Vatsala TM. 2007. Pigment production in Spirulina 216.
fussiformis in different photophysical conditions. Biomol Eng 24 Schulze PSC, Barreira LA, Pereira HGC, Perales JA, Varela JCS.
(3): 301–305. 2014. Light emitting diodes (LEDs) applied to microalgal
Madhyastha HK, Sivashankari S, Vatsala TM. 2009. C-phycocyanin production. Trends Biotechnol 32(8): 422–430.
from Spirulina fussiformis exposed to blue light demonstrates Tian F, Buso D, Wang T, Lopes M, Niangoran U, Zissis G. 2018.
higher efficacy of in vitro antioxidant activity. Biochem Eng J 43 Effect of Red and Blue LEDs on the production of phycocyanin
(2): 221–224. by Spirulina platensis based on photosynthetically active
McCree KJ. 1971. The action spectrum, absorptance and quantum radiation. J Sci Technol Light 41(0): 148–152.
yield of photosynthesis in crop plants. Agric Meteorol 9: 191–216. Wahidin S, Idris A, Shaleh SRM. 2013. The influence of light
Niangoran U, Tian F, Canale L, Haba CT, Buso D, Zissis G. 2018. intensity and photoperiod on the growth and lipid content of
Study of the LEDs spectrums influence on the Spirulina platensis microalgae Nannochloropsis sp. Bioresour Technol 129: 7–11.
growth in batch culture. In: 2018 IEEE International Conference Wang CY, Fu CC, Liu YC. 2007. Effects of using light-emitting
on Environment and Electrical Engineering and 2018 IEEE diodes on the cultivation of Spirulina platensis. Biochem Eng J 37
Industrial and Commercial Power Systems Europe (EEEIC/ (1): 21–25.
I&CPS Europe), pp. 1–4. Xue S, Su Z, Cong W. 2011. Growth of Spirulina platensis enhanced
Pareek A, Srivastava P. 2001. Optimum photoperiod for the growth of under intermittent illumination. J Biotechnol 151(3): 271–277.
Spirulina platensis. J Phytol Res 14(2): 219–220. Zarrouk C. 1966. Contribution à l’étude d’une cyanophycée Influence
Patel AK, Jae MJ, Min EH, Sang JS. 2019. Effect of light conditions de divers facteurs physiques et chimiques sur la croissance et la
on mixotrophic cultivation of green microalgae. Bioresour photosynthèse de Spirulina maxima (Setch et Gardner) Geitler.
Technol 282: 245–253. Université de Paris.
Cite this article as: Niangoran NUF, Buso D, Zissis G, Prudhomme T. 2021. Influence of light intensity and photoperiod on energy efficiency
of biomass and pigment production of Spirulina (Arthrospira platensis). OCL 28: 37.
Page 8 of 8You can also read