Influential Factors Affecting Protective Coping Behaviors of Flood Disaster: A Case Study in Shenzhen, China - MDPI
←
→
Page content transcription
If your browser does not render page correctly, please read the page content below
International Journal of
           Environmental Research
           and Public Health

Article
Influential Factors Affecting Protective Coping
Behaviors of Flood Disaster: A Case Study in
Shenzhen, China
Weiwei Cao 1 , Yi Yang 2, *, Jing Huang 1, *, Dianchen Sun 1 and Gaofeng Liu 1
 1    Institute of Management Science, Business School, Hohai University, Nanjing 211100, China;
      cww@hhu.edu.cn (W.C.); dcsun@hhu.edu.cn (D.S.); gaofengliu@hhu.edu.cn (G.L.)
 2    Teachers College, Columbia University, New York, NY 10012, USA
 *    Correspondence: yi.y@columbia.edu (Y.Y.); j_huang@hhu.edu.cn (J.H.)

 Received: 21 July 2020; Accepted: 13 August 2020; Published: 16 August 2020

 Abstract: As the risk of urban flooding increases worldwide, floods seriously endanger the safety
 of people’s lives and property. Understanding the protective coping behaviors of the public in
 flood disasters is crucial to the implementation of effective flood mitigation measures and flood risk
 management. In this study, influential factors affecting protective coping behaviors in the face of flood
 disasters were identified, and the effects of these factors were discussed as well. Shenzhen City in
 China was selected as the study area, in which a questionnaire survey of 339 respondents was carried
 out in three flood-prone districts. Correlation analysis was conducted to preselect potential influential
 factors. Then, two linear regression models were established to identify main influential factors and
 to explore the interaction effects of these factors. The results indicated that age, monthly income, flood
 experience, trust in government and insurance willingness were main influential factors of protective
 coping behaviors. Trust in government had the highest positive correlation coefficient, while monthly
 income and age were negatively associated with protective coping behaviors. The interaction between
 insurance willingness and monthly income jointly affected protective coping behaviors of the public.
 The findings of this study could help authorities better understand the public’s intention to cope with
 flood and design effective risk reduction measures, not only for Shenzhen, but also for many other
 similar cities that facing with the same situation.

 Keywords: protective coping behaviors; flood disaster; influential factors; questionnaire survey

1. Introduction
     Currently, the combined impact of various factors, such as abnormal climate and rapid urban
expansion, is increasing the risk of flood disasters faced by cities [1], which seriously endangers the
safety of people’s lives and property [2]. In recent years, the scale of forced evacuation due to flooding
has shown a fast-growing trend worldwide. For example, in February 2020, the storm Ciara swept
across Europe, causing a short period of traffic disruption, and approximately 14,000 households and
companies were affected in Ireland alone. In China, the consequences of flood disasters are even more
severe, due to the immature emergency management system. Flood disasters will cause numerous
casualties and huge property damage without proper protective coping behaviors. Protective coping
behavior is defined as the adjustment process that negative impacts of flood can be mitigated or
avoided, according to the definition of the Intergovernmental Panel on Climate Change (IPCC) [3].
Understanding protective coping behaviors of the public and developing effective methods to motivate
individuals and households to actively cope with flood disasters are of critical importance in flood
risk management.

Int. J. Environ. Res. Public Health 2020, 17, 5945; doi:10.3390/ijerph17165945     www.mdpi.com/journal/ijerph
Int. J. Environ. Res. Public Health 2020, 17, 5945                                                   2 of 15

      Studies about protective coping behaviors in flood disasters began in the 1970s. The research
conducted by Huerta and Horton [4], which intended to explain the discrepancy in flood coping
behaviors between old and young people, is considered as an early start to explore factors affecting
people’s protective coping behaviors and has influenced subsequent studies. Reviewing relevant
literatures, it can be found that studies on disaster coping behaviors mainly focused on the
following aspects:

1.    Studying the protective coping behaviors of different subjects. To date, the research subjects
      of protective coping behaviors include ordinary people [5,6], farmers [7,8], students [9,10] and
      tourists [11,12].
2.    Identifying influential factors of protective coping behaviors. Many influential factors have
      been explored and analyzed, including sociodemographic factors (such as gender, age, income,
      education level, etc.), geographic location, previous flood experience, risk perception, trust in
      government, worry, knowledge of flood. Among sociodemographic factors, age, income and
      education level are considered to be closely related to protective coping behaviors of the public,
      and most research results indicate positive relationships [13,14]. Females, as a vulnerable group,
      are more inclined to take protective measures to deal with flood disasters compared to males,
      according to Cvetković’s [15] study in Serbia. In terms of geographic location, residents living
      close to flood risk sources are found to have higher intentions to cope with floods [16,17]. When
      it comes to previous flood experience, personal experience of disasters enhances the general
      understanding of flood risks [18], and helps victims of floods perceive more severe consequences
      of future flood disasters, thus leads to stronger intentions to take protective actions [19,20].
      Due to the development of theoretical framework, such as protection motivation theory, the
      impact of risk perception on coping behaviors is also widely recognized, and this effect is usually
      considered to be positive [3,21]. The trust in government, is another crucial influential factor
      because it determines the effectiveness of the government’s risk communication and emergency
      management [22]. Worry is the most common emotion of the public in the face of floods, which
      can increase people’s intention to cope with flood risks [23,24]. With respect to the knowledge of
      flood, published literatures [25] believe that it is closely related to protective coping behaviors,
      more specifically, more knowledge leads to stronger willingness to cope. In summary, current
      literatures are devoted to exploring the influential factors of protective coping behaviors, but the
      results vary from study-to-study.
3.    Studying and expanding the analytical framework of coping behaviors, such as protection
      motivation theory [26,27], protective action decision model [28,29], flood-risk precautionary
      behavior [30], etc. For example, the frame of protection motivation theory includes flood
      experience, barriers and socio-economic factors as additional factors to explain their influence
      on coping behaviors [31]. Papagiannaki et al. [30] extend current knowledge of the drivers
      of flood coping behaviors and predicted flood preparedness intention by proposing flood-risk
      precautionary behavior theory.

     Current studies have explored numerous influencing factors of protective coping behaviors. Some
factors are found to have direct effects, but the indirect impact of factors is often ignored. A great
number of factors that indirectly affect protective coping behaviors are excluded in most studies.
Moreover, studies on protective coping behaviors have a strong regionality, which produce results
with local characteristics. Although many influential factors are found to have close relationships with
protective coping behaviors, the influence degree of these factors differ a lot due to the variety of study
areas and objects. Although structural nonstructural flood control measures are developed in China, it
lacks the understanding of flood coping behaviors of the general public, thus the actual effect of the
nonstructural measures is attenuated.
     In order to discover the factors influencing the public’s protective intention to cope with flood
disasters and how these factors influence coping behaviors in highly developed cities in China, a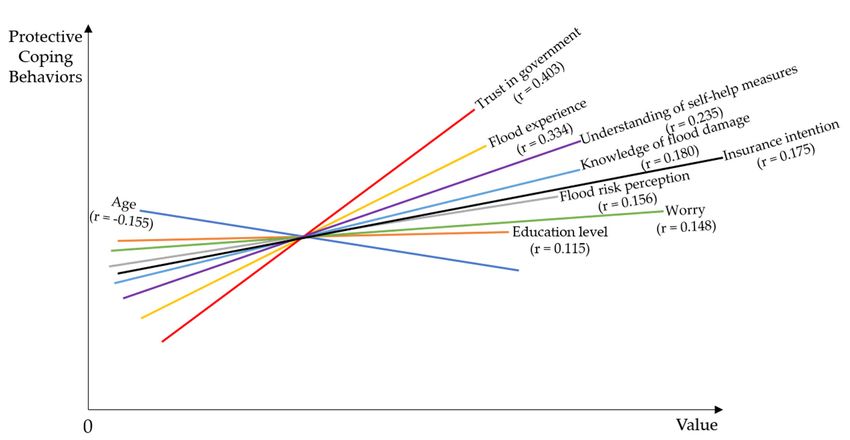
Int. J. Environ. Res. Public Health 2020, 17, 5945 3 of 15
structured survey study was carried out in five flood-prone communities in three districts in Shenzhen.
The data were collected from the proposed Likert-scale questionnaire. Given the importance of
Int. J. Environ. Res. Public Health 2020, 17, x 3 of 15
protective coping behaviors research in disaster emergency management, this study aims to identify
main
aimsinfluential
to identify factors of protective
main influential coping
factors behaviors
of protective and
coping determine
behaviors andtodetermine
which extent these
to which factors
extent
impact the coping behaviors. This study will help government guide residents
these factors impact the coping behaviors. This study will help government guide residents in in Shenzhen to form
a Shenzhen
more proactive to formflood
a more response
proactive attitude, which can
flood response be potentially
attitude, which canapplied to other
be potentially citiesto
applied which
other are
similar to Shenzhen.
cities which are similar to Shenzhen.
2.2.Materials
Materialsand
andMethods
Methods
2.1.
2.1.Study
StudyArea
Area
The
Thestudy
studywaswasconducted
conducted in in Shenzhen
Shenzhenbecause
becauseititsuffers
suffersfrom
from severe
severe flood
flood almost
almost everyevery year,
year,
leading to huge economic losses and widespread impacts. Meanwhile, Shenzhen
leading to huge economic losses and widespread impacts. Meanwhile, Shenzhen is a typical large- is a typical large-scale
and well-developed
scale and well-developedcity in China, which
city in is faced
China, whichwithiscontradictions between urbanbetween
faced with contradictions development urbanand
environmental
development protection. The damage
and environmental caused by
protection. Theurban expansion
damage causedto by
local ecological
urban environment
expansion to localhas
ecological
increased theenvironment
frequency and has severity
increasedofthe frequency
natural and in
disasters severity of natural
Shenzhen, disasters
including floodindisasters.
Shenzhen,
including flood disasters.
Shenzhen—located in the southern region of Guangdong Province, China (as shown in Figure 1)
and onShenzhen—located
the eastern shore of in the southern
Pearl Riverregion of Guangdong
Delta—is a typical Province, China (as city.
coastal developed shown in Figure
It lies between
1131)◦and on the
430 –114 ◦ 38eastern shore of the
0 east longitude andPearl
22◦River
240 –22Delta—is
◦ 520 northa typical coastal
latitude, withdeveloped
a total areacity. It lies between
of 1996.85 km2 . The
113°43′–114°38′
local climate typeeast longitude and
is subtropical 22°24′–22°52′
maritime climate,north
withlatitude,
an annual with a total temperature
average area of 1996.85 of km
22.4. ◦The
2
C and
anlocal climate
annual type is
average subtropical
sunshine timemaritime
of 2009.8climate,
h. Thewith an annual
annual averageistemperature
precipitation over 1900 mm. of 22.4 In°C and
addition,
it an annual
suffers average
from sunshinecyclones
4–5 tropical time of 2009.8 h. Theon
(typhoons) annual
average precipitation
each year.is Shenzhen
over 1900 mm. In addition,
governs 9 districts
it suffers from 4–5 tropical cyclones (typhoons) on average each year. Shenzhen governs 9 districts
including a new district and has a total resident population of 13.025 million according to the census
including a new district and has a total resident population of 13.025 million according to the census
in 2018. Shenzhen is the first Special Economic Zone in China which was established in 1980, and at
in 2018. Shenzhen is the first Special Economic Zone in China which was established in 1980, and at
present it is the core city of the Guangdong–Hong Kong–Macao Greater Bay Area (GBA). Therefore,
present it is the core city of the Guangdong–Hong Kong–Macao Greater Bay Area (GBA). Therefore,
Shenzhen is regarded as one of the national economic centers of China and the regional GDP in 2019
Shenzhen is regarded as one of the national economic centers of China and the regional GDP in 2019
has reached 26,972 billion RMB, far exceeding other cities.
has reached 26,972 billion RMB, far exceeding other cities.
Figure1.1.Distribution
Figure Distribution of research
researchdistricts
districtsininShenzhen,
Shenzhen,Guangdong
GuangdongProvince, China.
Province, China.
Shenzhenisisprone
Shenzhen prone to
to floods.
floods. Due
Due to to its
its coastal
coastallocation
locationandandsubtropical
subtropicalmaritime
maritime climate, the the
climate,
frequencyand
frequency andthethe intensity
intensity of precipitation
of precipitation in the
in the citycity is relatively
is relatively high,high, leading
leading to risk
to high highofrisk of
flooding.
flooding. Moreover,
Moreover, Shenzhen Shenzhen is hit by typhoons
is hit by typhoons frequently frequently in the summer,
in the summer, exacerbating
exacerbating the risk
the flood flood[32].
Inrisk
the [32]. In the
history history of Shenzhen,
of Shenzhen, a great deal a great deal flood
of severe of severe flood has
disasters disasters has occurred.
occurred. In 2019,
In 2019, the the
occurrence
occurrence of short-term heavy rainfall resulted in a sudden flood disaster in
of short-term heavy rainfall resulted in a sudden flood disaster in Shenzhen, causing 7 deaths andShenzhen, causing 7 4
deaths and 4 missing people according to the data from Shenzhen Emergency Management
Department. In 2008, a wide-range, intense and long-lasting abnormal precipitation took place,
causing severe urban flooding, which affected millions of people and resulted in 8 deaths and 6Int. J. Environ. Res. Public Health 2020, 17, 5945 4 of 15
missing people according to the data from Shenzhen Emergency Management Department. In 2008, a
wide-range, intense and long-lasting abnormal precipitation took place, causing severe urban flooding,
which affected millions of people and resulted in 8 deaths and 6 missing people. This flood event
caused more than 140 waterlogging points in the city and brought about direct economic losses of
about 1.2 billion RMB [33]. In 1998, Shenzhen experienced a severe once-in-a-century rainstorm, and
the precipitation reached 285–292 mm in 6 h, resulting in a direct economic loss of 180 million RMB [34].
According to local statistics, it can be found that almost every ten years, a severe flood disaster appears
in Shenzhen. As Cui [35] predicted using artificial intelligence algorithm, the economic losses caused
by floods in Shenzhen will exceed 257 million RMB by 2020 and 309 million RMB by 2028. Therefore,
there is no doubt that flood risk in Shenzhen is extremely high.
The waterlogging monitoring system for urban water accumulation in Shenzhen is complete, so it
is easy to know which areas are vulnerable to waterlogging and flooding. Based on the historical data
of waterlogging spots, three districts (Xixiang District, Shatou District, Nanwan District) of Shenzhen
under the serious threat of flooding, were chosen to be sampling sites for the survey study. Compared
with the other two districts, Nanwan District is more prone to floods, as its low-lying terrain forms
waterlogging immediately after short-term heavy rainfalls. Five low-rise communities were selected
near easily flooded areas because high-rise residential buildings are less affected by flood disasters.
2.2. Questionnaire Design
The purpose of this survey was to understand the public’s willingness to respond to flood disasters
and to explore potential factors that affect the protective coping behaviors. The questionnaire consisted
of 6 sections (as shown in Table 1): sociodemographic factors, risk perception, risk knowledge, risk
attitudes, coping capacity and coping behaviors. There were 4 sociodemographic items, gender [15],
age [36], education level [37] and monthly income [38], which mainly measured the influence of
sociodemographic factors on protective coping behaviors. The second section investigated the public’s
perception of flood risk [39] and local flooding likelihood [40]. The risk knowledge section, which
contained flood experience [41,42] and knowledge of flood damage, aimed to assess the empirical
knowledge of the respondents and to investigate their understanding of devastating floods. The next
section included trust in government [30,43] and worry [23,30], in order to comprehend the respondents’
attitude toward disaster prevention of the government and their concerns about floods. The coping
capacity section evaluated the coping ability of respondents, including insurance willingness [44] and
familiarity of self-help measures [45]. The last section intended to measure the public’s willingness to
take protective actions.
Table 1. Definition of measurement and influential factors of protective coping behaviors.
Section Variables Detail
Gender
Age The basic social background characteristics of
Sociodemographic factors
Education level respondents
Monthly income
Flood risk perception
Risk perception Respondents’ perception of flood risk
Perception of local flooding likelihood
Flood experience Respondents’ empirical knowledge and
Risk knowledge
Knowledge of flood damage understanding of the destructiveness of flood
Trust in government Respondents’ trust in the government’s disaster
Risk attitudes
Worry prevention and their concern about floods
Insurance willingness
Coping capacity Evaluation of respondents’ coping ability
Familiarity of self-help measures
Coping behaviors Protective coping behaviors Respondents’ willingness to take protective actions
The structured questionnaire took the form of a 5-point Likert scale to facilitate the quantification of
the data. The Likert scale is widely used in the field of psychology and social science to measure opinionsInt. J. Environ. Res. Public Health 2020, 17, 5945 5 of 15
or attitudes of respondents [46]. In order to eliminate misunderstandings about the questions, a small
group of people with different education background were selected to fill out the questionnaire before the
formal survey, and the items of the survey were modified to be more easily understood by respondents
based on their feedback on the questions. Additionally, the reliability of the questionnaire was
preliminarily tested during the pilot study, in order to ensure the overall reliability of the questionnaire.
2.3. Data Collection
Data were collected using a face-to-face questionnaire survey conducted from 6th July to 12th July
2019. The questionnaires were mainly distributed by graduate students who had basic knowledge of
natural-disaster emergency management and the background of questionnaire design and collection.
In order to ensure the number of valid questionnaires, the distribution process was led by community
managers. However, the collection process adhered to the principle of voluntariness. To avoid distortion
of the questionnaire data, this study did not force any respondents to fill out the questionnaire in order.
Respondents had the right to refuse to participate or withdraw from the survey at any time. Moreover, a
souvenir was given to each respondent after completing the questionnaire as an encouragement to their
participation. The number of samples selected in each district was in accordance with the population
distribution of the three target districts (the ratio of Xixiang District, Shatou District and Nanwan
District is approximately 1:1:2). Eventually, a total of 400 questionnaires were distributed in the study
area and 339 (84.75%) valid questionnaires were obtained excluding unqualified questionnaires.
2.4. Statistical Analysis Method
The process of the statistical analysis in this study can be considered as a three-stage approach.
First of all, descriptive statistics were calculated to summarize the general background characteristics of
the respondents (including gender, age, education level, income) and to analyze the basic distribution
of the data.
Next, correlation analysis was conducted to identify whether the hypothesized influence factors
had a significant impact on protective coping behaviors. The correlation coefficients of these influential
factors were calculated through Equations (1) and (2), in order to examine their degrees of influence on
protective coping behaviors.
Cov = E[XY] − E[X]E[Y] (1)
Cov(X, Y)
R(X, Y) = p (2)
Var[X] · Var[Y]
In Equation (1), E[X], E[Y] and E[XY] stand for the expected values of X, Y and the product of X
and Y, respectively. In Equation (2), Cov(X, Y) denotes the covariance of X and Y, while Var[X] and
Var[Y] represent the variances of X and Y, respectively.
Finally, regression analysis was conducted to determine whether there was a linear relationship
between the influential factors and the protective coping behaviors. The factors of the multiple
regression models were selected based on the findings of the correlation analysis. Two regression
models were established and compared in order to identify main influential factors as well as
interaction terms.
Both the correlation analysis and regression analysis were conducted using a significance level of
0.05, in other words, factors were considered to have an impact on protective coping behaviors when
the p-values of these factors were less than 0.05 [38,47]. All data in this study were analyzed using
SPSS statistics software (Version 22.0, SPSS, Inc., Chicago, IL, USA).Int. J. Environ. Res. Public Health 2020, 17, 5945 6 of 15
3. Results
3.1. Characteristics of Respondents
A total of 339 valid questionnaires were obtained in this study. According to the reliability
test of the questionnaire data, the Cronbach’s alpha coefficient reached 0.811, which indicated good
consistency of the scale [48]. Table 2 showed the sociodemographic attributes of the respondents in
Shenzhen on four basic aspects: gender, age, education level and monthly income.
Table 2. Sociodemographic attributes of respondents.
Variable Shenzhen (Total) Xixiang District Shatou District Nanwan District
Gender n (%)
Male 172 (50.74%) 44 (49.44%) 37 (51.39%) 91 (51.12%)
Female 167 (49.26%) 45 (50.56%) 35 (48.51%) 87 (48.88%)
Age n (%)Int. J. Environ. Res. Public Health 2020, 17, 5945 7 of 15
Table 3. Comparison of protective coping behavior intention between different districts.
District Mean N Std. Deviation Difference from Mean
Xixiang 3.640 89 1.359 −0.110
Shatou 3.710 72 1.168 −0.050
Nanwan 3.850 178 1.176 0.090
Total 3.760 339 1.225 -
As shown in Table 3, the overall mean score of the 339 respondents’ intentions to take protective
coping behaviors in Shenzhen was 3.76 (SD = 1.225) on a scale of 1–5. This means that respondents in
Shenzhen had a slightly higher than medium level of coping behavior intention during flood disasters,
which further indicated a greater risk of potential flood loss in Shenzhen. Nanwan District had the
highest level of coping behavior intention, with mean of 3.85 (SD = 1.176), exceeding the grand mean,
which could be explained by being one of the most severe flood-prone areas in Shenzhen. On the
contrary, the levels of coping behavior intention of Xixiang District and Shatou District were lower
than average, with mean of 3.71 (SD = 1.168) and 3.64 (SD = 1.359), respectively. However, it was
found that the p-values of the pairwise comparisons were all greater than 0.05 (Xixiang District and
Shatou District: t(336) = −0.350, p = 0.727; Xixiang District and Nanwan District: t(336) = −1.307, p
= 0.192; Shatou District and Nanwan District: t(336) = −0.818, p = 0.414), which indicated that the
differences of the levels of protective coping behaviors among the three districts was insignificant.
3.3. Correlation between Factors
The purpose of the correlation analysis between each influential factors and protective coping
behaviors was twofold: (a) to verify whether the influential factors in Table 1 were associated
with protective coping behaviors; (b) to find out how these factors were correlated with protective
coping behaviors.
As shown in Table 4, gender, perception of local flooding likelihood and monthly income proved
to be unrelated to protective coping behaviors, because the p-values of these factors were all greater
than 0.05 and the correlation coefficients were all less than 0.1. Correlation analysis failed to provide
evidence for the impact of the gender and perception of local flooding likelihood on protective coping
behaviors of the public. Moreover, monthly income was also considered to be independent from
protective coping behaviors through the correlation analysis. This result was similar to the findings
of Meyer et al. [38], which discovered that there was no significant correlation between income and
evacuation intention.
Age, education level, flood risk perception, flood experience, knowledge of flood damage, trust in
government, worry, insurance willingness, familiarity of self-help measures passed the correlation test,
which indicated that changes in these factors will affect protective coping behaviors when people are
faced with flood disasters. Among these factors, only age was negatively correlated with protective
coping behaviors—that was, the willingness to cope protectively diminished as people got older.
Except for age, all the other factors were positively correlated with protective coping behaviors.Int. J. Environ. Res. Public Health 2020, 17, 5945 8 of 15
Table 4. Results of correlation analysis between influential factors and protective coping behaviors.
PCB Gen Age EL MI FRP PLFL FE KFD TG Wor IW FSM
PCB 1
Gen 0.055 1
Age −0.155 ** −0.070 1
EL 0.115 ** −0.007 −0.299 ** 1
MI −0.015 −0.050 −0.031 0.122 * 1
FRP 0.156 ** −0.127 * 0.009 0.227 ** 0.072 1
PLFL −0.069 0.063 0.070 0.069 −0.029 0.145 ** 1
FE 0.334 ** 0.045 −0.119 * 0.158 ** 0.101 0.305 ** 0.071 1
KFD 0.180 ** −0.065 0.036 0.121 * 0.068 0.386 ** 0.074 0.384 ** 1
TG 0.403 ** −0.029 −0.054 0.045 0.038 0.195 ** −0.072 0.321 ** 0.259 ** 1
Wor 0.148 ** 0.117 * 0.117 * 0.038 0.089 0.043 0.131 * 0.155 ** 0.160 ** 0.126 * 1
IW 0.175 ** 0.027 −0.215 ** 0.329 ** 0.143 ** 0.202 ** −0.006 0.247 ** 0.177 ** 0.198 ** 0.163 ** 1
FSM 0.235 ** −0.053 0.060 0.068 0.034 0.465 ** 0.146 ** 0.371 ** 0.545 ** 0.293 ** 0.129 * 0.094 1
Note: PCB—protective coping behaviors; Gen—gender; EL—education level; MI—monthly income; FRP—flood risk perception; PLFL—perception of local flooding likelihood; FE—flood
experience; KFD—knowledge of flood damage; TG—trust in government; Wor—worry; IW—insurance willingness; FSM—familiarity of self-help measures. ** represents that the
correlation is significant at the 0.01 level (2-tailed); * represents that the correlation is significant at the 0.05 level (2-tailed).Age, education level, flood risk perception, flood experience, knowledge of flood damage, trust
in government, worry, insurance willingness, familiarity of self-help measures passed the correlation
test, which indicated that changes in these factors will affect protective coping behaviors when people
are faced with flood disasters. Among these factors, only age was negatively correlated with
Int. J. Environ. Res. Public Health 2020, 17, 5945 9 of 15
protective coping behaviors—that was, the willingness to cope protectively diminished as people got
older. Except for age, all the other factors were positively correlated with protective coping behaviors.
Figure 22intuitively
intuitively showed
showed the correlations
the correlations betweenbetween eachand
each factor factor and protective
protective coping
coping behaviors,
behaviors,
from which from which
we could we ranking
tell the could tellof thethedegree
ranking of the degree
of correlation. of correlation.
In terms In terms
of the correlation of the
degree,
correlation
five degree,
factors that hadthe
the five factors
greatest that had
influences onthe greatestcoping
protective influences on protective
behaviors coping
were: trust behaviors
in government
(r = 0.403),
were: trust in government
flood experience = 0.334),
(r =(r0.403), flood experience
familiarity of (r = 0.334),measures
self-help familiarity = 0.235),
(r of self-help measures of
knowledge (r
= 0.235),
flood damage (r = 0.180),
knowledge of flood damagewillingness
insurance = 0.175). willingness
(r = 0.180),(rinsurance (r = 0.175).
The correlation The correlation
coefficients of trust in
coefficients ofand
government trust in government
flood experience were and flood experience
greater than 0.3,were greaterthat
indicating than 0.3,were
they indicating
the key that they
factors
were the coping
affecting key factors affecting
behaviors coping
of the behaviors
public. of the public.
Additionally, Additionally,
the impact the impact
of other factors of other coping
on protective factors
on protective
behaviors wascoping behaviors The
not neglectable. wascorrelations
not neglectable.
with The correlations
familiarity with familiarity
of self-help measures, of self-help
knowledge
measures,
of knowledge
flood damage, of flood
insurance damage,flood
willingness, insurance willingness,
risk perception, flood
worry andrisk perception,
education level worry and
were 0.235,
education
0.180, 0.175,level
0.156,were
0.1480.235, 0.180,respectively.
and 0.115, 0.175, 0.156,A 0.148
weak and 0.115, between
correlation respectively.
floodArisk
weak correlation
perception and
between flood
protective copingriskbehaviors
perception was and protective
found in thiscoping
study. behaviors was found in this study.
Figure 2. Schematic diagram of correlation between factors.
3.4. Influential Factors
3.4. Influential Factors of
of Protective
Protective Coping
Coping Behaviors
Behaviors
(1)
(1) Linear
Linear regression
regression model
model
Regression
Regression analysis was carried
analysis was carried outout to
to explore
explore thethe linear
linear relationships
relationships between
between the the influential
influential
factors
factors and protective coping behaviors of the residents in Shenzhen. Initially, a multiple regression
and protective coping behaviors of the residents in Shenzhen. Initially, a multiple regression
model
model which
which contained
contained 99 influential
influential factors
factors waswas established
established withwith aa significance
significance level
level of
of 0.05.
0.05.
Factors
Factors thatthatpassed
passed thethe
correlation test (age,
correlation test education level, flood
(age, education riskflood
level, perception, flood experience,
risk perception, flood
knowledge of flood damage, trust in government, worry, insurance
experience, knowledge of flood damage, trust in government, worry, insurance willingness willingness and familiarityand of
self-help
familiarity measures)
of self-helpweremeasures)
consideredwere to be closely
consideredrelated
to to beprotective coping to
closely related behaviors.
protective Therefore,
coping
all these factors were included in the initial multiple linear regression model.
behaviors. Therefore, all these factors were included in the initial multiple linear regression model. The results showed
that this model
The results showed was that
significant
this model(F(9,was = 11.459, p(F(9,
329)significant = 0.000)
329) =to11.459,
predictp =protective coping behaviors.
0.000) to predict protective
The adjusted R-square was 0.218, which means 21.8% variation in the dependent
coping behaviors. The adjusted R-square was 0.218, which means 21.8% variation in the dependent variable (protective
coping
variablebehaviors)
(protectivecould
copingbe behaviors)
explained by the regression.
could be explained by the regression.
As
As shown
shownin inTable
Table5,5,age
age = 0.010),
(p (p flood
= 0.010), experience
flood experience(p =(p0.002) and trust
= 0.002) in government
and trust in government(p = 0.000)
(p =
were regarded as main influential factors of protective coping behaviors in
0.000) were regarded as main influential factors of protective coping behaviors in this model, becausethis model, because the
significance level of these three factors were all less than 0.05. However, the
the significance level of these three factors were all less than 0.05. However, the other variables other variables (education,
flood risk perception,
(education, flood risk knowledge
perception, of flood damage,
knowledge worry,
of flood insurance
damage, willingness
worry, insuranceand familiarity
willingness of
and
self-help measures) were insignificant in predicting protective coping behaviors. Nevertheless, the
influence of these factors on protective coping behaviors was still worth discussing.Int. J. Environ. Res. Public Health 2020, 17, 5945 10 of 15
Table 5. Coefficients of the linear regression model.
Regression Model B Std. Error t p-Value
Constant 1.569 0.382 4.108 0.000 **
Age −0.162 0.063 −2.583 0.010 **
Education level 0.031 0.081 0.386 0.700
Flood risk perception 0.003 0.062 0.044 0.965
Flood experience 0.172 0.055 3.123 0.002 **
Knowledge of flood damage −0.034 0.067 −0.515 0.607
Trust in government 0.330 0.057 5.788 0.000 **
Worry 0.084 0.048 1.742 0.082
Insurance willingness 0.014 0.046 0.310 0.756
Familiarity of self-help measures 0.093 0.065 1.433 0.153
Note: ** represents that the correlation is significant at the 0.01 level.
The regression coefficient (B) measured the linear effect level of independent variables on coping
behaviors. The regression coefficients of trust in government, 0.330, was the highest in this model,
followed by flood experience, which was 0.172. The regression coefficient of age was negative (B =
−0.162), which was consistent with the results from the correlation analysis. Among the insignificant
factors, the regression coefficients of worry (B = 0.084) and familiarity of self-help measures (B = 0.093)
were nonignorable.
To summarize, through the multiple linear regression model, three main influential factors of
protective coping behaviors, age, flood experience and trust in government, were identified. Therefore,
when studying coping behaviors of the public, these three factors should be taken into account. Even
though the other factors were found to be insignificant in this linear regression, it did not mean that
they had no effect on coping behaviors. In the next section, the interaction effects of these variables
were studied, instead of simply excluding them from the linear model.
(2) Linear regression model with interaction
Although the linear regression model in Section 3.3 only identified three major influential factors
of protective coping behaviors, this model ignored the interaction effects of these factors. It did not
necessarily suggest that insignificant variables should be eliminated from the linear model, and they
might potentially interact with other variables to jointly influence coping behaviors. Therefore, this
study attempted to explore all possible linear models with interactions. An interaction term was the
product of two different variables, and only the interaction between monthly income and insurance
willingness were presented.
Compared to the initial linear regression model above, the new model considering interaction
effect improved the goodness of fit (adjusted R-square = 0.2261), indicating 0.81% more of the variability
in the protective coping behaviors could be explained by including the interaction between monthly
income and insurance willingness in the model. As shown in Table 6, the interaction between monthly
income and insurance willingness was significant (p = 0.027). This indicated that monthly income and
insurance willingness jointly affected the protective coping behaviors, even though neither of them
was significant in the previous model. This finding agreed with the significant correlation coefficient
between monthly income and insurance willingness (as shown in Table 4) which suggested that these
two factors were closely associated.Int. J. Environ. Res. Public Health 2020, 17, x 11 of 15
Int. J. Environ. Res. Public Health 2020, 17, 5945 11 of 15
Table 6. Coefficients of Model with interactive variables.
Model with Interactive Variables B Std. Error t p-Value
Table 6. Coefficients of Model with interactive variables.
Constant 2.535 0.417 6.081 0.000 **
Model with Interactive Variables B Std. Error t p-Value
Age −0.157 0.059 −2.653 0.008 **
Constant 2.535 0.417 6.081 0.000 **
Trust in government 0.360 0.056 6.499 0.000 **
Age −0.157 0.059 −2.653 0.008 **
Trust Flood experience
in government 0.360 0.205 0.051
0.056 4.044
6.499 0.000 ** **
0.000
Flood experience 0.205 0.051 4.044 0.000 **
Monthly income −0.438 0.174 −2.512 0.012 *
Monthly income −0.438 0.174 −2.512 0.012 *
Insurance
Insurance willingness
willingness −0.142−0.142 0.091
0.091 −1.562
−1.562 0.119
0.119
Monthly income * insurance willingness
Monthly income * insurance willingness 0.109 0.109 0.049
0.049 2.221
2.221 0.027 * *
0.027
Note: ** represents that the correlation is significant at the 0.01 level; * represents that the correlation is significant at
Note: ** represents that the correlation is significant at the 0.01 level; * represents that the correlation
the 0.05 level.
is significant at the 0.05 level.
In order
In order totofurther explore
further the interaction
explore effect between
the interaction monthlymonthly
effect between income and insurance
income and willingness,
insurance
willingness, other factors in the model, age, trust in government and flood experience, were fixedThe
other factors in the model, age, trust in government and flood experience, were fixed as constant. as
values ofThe
constant. age values
(mode of = 2),
agetrust in government
(mode = 2), trust in(mode = 3), flood
government (modeexperience
= 3), flood(mode = 5) were
experience (mode set to be
= 5)
their modes. As demonstrated in Figure 3, when the monthly income of the respondents
were set to be their modes. As demonstrated in Figure 3, when the monthly income of the respondents was less than
5000less
was RMB,
thantheir
5000intentions
RMB, theirtointentions
cope protectively decreased as
to cope protectively their insurance
decreased willingness
as their insurance increased.
willingness
On the contrary, when monthly income was more than 5000 RMB, there was
increased. On the contrary, when monthly income was more than 5000 RMB, there was a positive a positive relationship
between protective
relationship betweencoping behaviors
protective copingand insurance
behaviors and willingness. The higherThe
insurance willingness. thehigher
income thelevel was,
income
the greater
level thegreater
was, the positive effect
the of insurance
positive effect ofintention
insuranceonintention
protectiveoncoping behaviors.
protective copingInbehaviors.
other words, In
the willingness to take coping behaviors of high-income individuals was
other words, the willingness to take coping behaviors of high-income individuals was stronger stronger when theywhenhad
higher
they hadinsurance willingness,
higher insurance while that
willingness, whileof low-income peoplepeople
that of low-income was stronger when when
was stronger they had
theylower
had
insurance
lower willingness.
insurance willingness.
Theinteraction
Figure3.3. The
Figure interactioneffect
effect of
of monthly
monthly income
income and
and insurance
insurance willingness. Note: yyrepresents
willingness. Note: represents
protectivecoping
protective behaviors,xxrepresents
copingbehaviors, representsinsurance
insurancewillingness.
willingness.
4. Discussion
4. Discussion
This study aimed to explore which factors have significant impact on protective coping behaviors.
This study aimed to explore which factors have significant impact on protective coping
Age, education level, flood risk perception, flood experience, knowledge of flood damage, trust in
behaviors. Age, education level, flood risk perception, flood experience, knowledge of flood damage,
government, worry, insurance willingness, and familiarity of self-help measures were found to be
trust in government, worry, insurance willingness, and familiarity of self-help measures were found
correlated with protective coping behaviors of the residents in Shenzhen. In addition, we also foundInt. J. Environ. Res. Public Health 2020, 17, 5945 12 of 15
out that main influential factors, such as age, trust in government and flood experience, had a strong
linear relationship with coping behaviors, which was consistent with most findings from studies in
other countries, for instance, Thailand, New Zealand, etc. [49–51].
More important, factors that were not highly correlated with protective coping behaviors might
also affect coping behaviors. For example, monthly income and insurance willingness were found to be
insignificant in the initial regression model, but after including the interaction term of these two factors
in the second regression model, their impact on protective coping behaviors became significant. This
could be explained by similar studies, which had found that monthly income and insurance willingness
were regarded as nonnegligible factors of coping behaviors [47,52]. Therefore, when screening factors,
correlation analysis or simple linear analysis were not sufficient to determine the potential influence of
factors. In other words, the factors could not be excluded only based on the results of these analyses.
The interaction effects of factors needed to be further taken into account.
The structural equation model (SEM) is a common tool in other studies to explore the complicated
relationships among factors. For example, a similar study conducted by Huang et al. [53], established
a SEM to explore the relationship between influential factors and protective coping behaviors. Huang’
study found that protective coping behaviors of the public were indirectly affected by sociodemographic
factors like age and monthly income, which suggested that sociodemographic factors might interact
with other influential factors on protective coping behaviors. This study proposed another approach
to explore the interaction effects between variables using linear regression, and similar results were
discovered. Monthly income—as one of the typical sociodemographic factors—jointly affected the
protective coping behaviors with insurance willingness. On top of this, the potential interaction of
the effects of other factors on protective coping behaviors could be further investigated using the
proposed method.
In this study, only three flood-prone districts in Shenzhen were selected. Therefore, these findings
only represented the protective coping behaviors of people under serious threats of flooding. In the
future, more samples will be selected from the overall population in order to reach more general
conclusions. The questionnaire survey was carried out anonymously to ensure the objectivity of
the results. However, some illiterate participants finished the questionnaires with the assistance
of our volunteers, thus they might feel uncomfortable sharing their true opinions, especially
government-related questions, leading to biased ratings of these items. Furthermore, because there is
no standardized questionnaire of protective coping behaviors, this study may have omissions in the
selection of influencing factors. A standardized questionnaire should to be developed and validated in
future studies. Nonetheless, findings of this research could help decision-makers in the government
to formulate effective communication strategies and flood risk reduction policies. In the future, we
will include more samples and explore the coping behaviors of the public in depth from a social point
of view.
5. Conclusions
In summary, five flood-prone communities from three districts in Shenzhen were investigated
and more than 300 valid questionnaires were analyzed. First, the overall level of protective coping
behaviors of respondents in the three districts was analyzed. Then, the correlation analysis and
regression analysis were conducted to determine which factors influence protective coping behaviors
of the public in Shenzhen. The key findings of this study are:
1. Respondents’ protective coping behaviors in Shenzhen were above the medium level with overall
mean of 3.76 (on a scale from 1 to 5). More specifically, Nanwan District had the highest level
of protective coping behaviors, with mean of 3.85, and Xixiang District had the lowest level of
protective coping behaviors, with mean of 3.64;
2. Age, flood experience, trust in government, monthly income and insurance willingness were
found to be closely associated with protective coping behaviors in Shenzhen. Trust in government
(B = 0.360) had the greatest positive impact, followed by flood experience (B = 0.205). AgeInt. J. Environ. Res. Public Health 2020, 17, 5945 13 of 15
(B = −0.157) and monthly income (B = −0.438) were negatively associated with protective
coping behaviors;
3. Monthly income and insurance intention had insignificant direct effect on protective coping
behaviors. However, the interaction effect of these two factors on protective coping behaviors was
significant, which indicated that insurance willingness and monthly income (B = 0.109) jointly
affect the protective coping behaviors.
This study concluded that age, flood experience, trust in government, monthly income and
insurance willingness were the main influential factors of protective coping behaviors of residents in
Shenzhen. We conducted a 3-step approach to explore the interaction between variables using linear
model and explored the interaction of monthly income and insurance willingness. These findings
can help authorities better understand the public’s intention to cope with flood disasters and design
effective risk reduction measures, not only for Shenzhen, but also for many similar cities in China faced
with the same situation and dilemma.
Author Contributions: Conceptualization, Y.Y. and J.H.; formal analysis, W.C. and Y.Y.; funding acquisition, J.H.
and G.L.; investigation, W.C., J.H. and D.S.; methodology, W.C. and Y.Y.; project administration, J.H. and G.L.;
resources, D.S.; supervision, J.H.; writing—original draft, W.C.; writing—review & editing, W.C., Y.Y. and J.H. All
authors have read and agree to the published version of the manuscript.
Funding: This research was funded by National Key Research and Development Program of China (No.
2017YFC1502603) and National Natural Science Foundation of China (No. 71601070).
Acknowledgments: We would like to express our gratitude to the Shenzhen City District office and street office for
the authorization and support to conduct the study. Finally, we are grateful all the investigators and respondents
who participated in the survey.
Conflicts of Interest: The authors declare no conflict of interest.
References
1. Lee, E.H.; Kim, J.H. Development of resilience index based on flooding damage in urban areas. Water 2017,
9, 428. [CrossRef]
2. Wang, W.W.; Wang, Q.; Lin, H.; Gong, D.J.; Zhang, S.W. Summarization and prospection for the studies on
China’s urban water logging. Urban Probl. 2015, 10, 24–28.
3. Bubeck, P.; Botzen, W.J.W.; Kreibich, H.; Aerts, J.C.J.H. Detailed insights into the influence of flood-coping
appraisals on mitigation behaviour. Glob. Environ. Chang. 2013, 23, 1327–1338. [CrossRef]
4. Huerta, F.; Horton, R. Coping behavior of elderly flood victims. Gerontologist 1978, 18, 541–546. [CrossRef]
5. Abbas, A.; Amjath-Babu, T.S.; Kächele, H.; Usman, M.; Amjed Iqbal, M.; Arshad, M.; Adnan Shahid, M.;
Müller, K. Sustainable survival under climatic extremes: Linking flood risk mitigation and coping with flood
damages in rural Pakistan. Environ. Sci. Pollut. Res. 2018, 25, 32491–32505. [CrossRef]
6. De Dominicis, S.; Crano, W.D.; Cancellieri, U.G.; Mosco, B.; Bonnes, M.; Hohman, Z.; Bonaiuto, M. Vested
interest and environmental risk communication: Improving willingness to cope with impending disasters. J.
Appl. Soc. Psychol. 2014, 44, 364–374. [CrossRef]
7. Nazir, A.; Li, G.; Sheikh, M.J.; Zhou, X.; Humayoon, A.; Rizwan, M.; Akhtar, S. Farmers’ Perceptions of Risk
Sources and Risk Coping Strategies in Pakistan. J. Anim. Plant Sci. 2018, 28, 889–906.
8. Singh, O.; Singh, H. The response of farmers to the flood hazard under rice–wheat ecosystem in Somb basin
of Haryana, India: An empirical study. Nat. Hazards 2015, 75, 795–811. [CrossRef]
9. Seyle, D.C.; Widyatmoko, C.S.; Silver, R.C. Coping with natural disasters in Yogyakarta, Indonesia: A study
of elementary school teachers. Sch. Psychol. Int. 2013, 34, 387–404. [CrossRef]
10. Li, J.Y. Evaluation on public risk perception: A case study on college students. J. Nat. Disaster 2005, 14,
153–156.
11. Wu, L.; Zhang, J.; Lu, Q.; Rahman, A.B.M.S. Tourist adaptation behavior in response to climate disasters in
Bangladesh. J. Sustain. Tour. 2017, 25, 217–233. [CrossRef]
12. Kajan, E.; Saarinen, J. Tourism, climate change and adaptation: A review. Curr. Issues Tour. 2013, 16, 167–195.
[CrossRef]Int. J. Environ. Res. Public Health 2020, 17, 5945 14 of 15
13. Tongtham, A.; Kerdmongkol, P.; Amnatsatsue, K.; Jirapongsuwan, A.; Nanthamongkolchai, S. Flood
preparedness behavior among older people with chronic diseases in a flood prone area of Thailand. E. Asian
J. Trop. Med. 2019, 50, 786–792.
14. Ajibade, I.; Armah, F.A.; Kuuire, V.Z.; Luginaah, I.; McBean, G.; Tenkorang, E.Y. Assessing the bio-psychosocial
correlates of flood impacts in coastal areas of Lagos, Nigeria. J. Environ. Plan. Manag. 2015, 58, 445–463.
[CrossRef]
15. Cvetković, V.; Roder, G.; Öcal, A.; Tarolli, P.; Dragićević, S. The Role of Gender in Preparedness and Response
Behaviors towards Flood Risk in Serbia. Int. J. Environ. Res. Public Health 2018, 15, 2761. [CrossRef]
16. Botzen, W.J.W.; Aerts, J.C.J.H.; van den Bergh, J.C.J.M. Willingness of homeowners to mitigate climate risk
through insurance. Ecol. Econ. 2009, 68, 2265–2277. [CrossRef]
17. Tonn, G.; Guikema, S.; Zaitchik, B. Simulating Behavioral Influences on Community Flood Risk under Future
Climate Scenarios. Risk Anal. 2020, 40, 884–898. [CrossRef] [PubMed]
18. Pagneux, E.; Gisladottir, G.; Jonsdottir, S. Public perception of flood hazard and flood risk in Iceland: A case
study in a watershed prone to ice-jam floods. Nat. Hazards 2011, 58, 269–287. [CrossRef]
19. Zaalberg, R.; Midden, C.; Meijnders, A.; McCalley, T. Prevention, Adaptation, and Threat Denial: Flooding
Experiences in the Netherlands. Risk Anal. 2009, 29, 1759–1778. [CrossRef]
20. Poussin, J.K.; Botzen, W.J.W.; Aerts, J.C.J.H. Factors of influence on flood damage mitigation behaviour by
households. Environ. Sci. Policy 2014, 40, 69–77. [CrossRef]
21. De Dominicis, S.; Fornara, F.; Ganucci Cancellieri, U.; Twigger-Ross, C.; Bonaiuto, M. We are at risk, and
so what? Place attachment, environmental risk perceptions and preventive coping behaviours. J. Environ.
Psychol. 2015, 43, 66–78. [CrossRef]
22. Terpstra, T. Emotions, Trust, and Perceived Risk: Affective and Cognitive Routes to Flood Preparedness
Behavior. Risk Anal. 2011, 31, 1658–1675. [CrossRef] [PubMed]
23. Haney, T.J. Move out or dig in? Risk awareness and mobility plans in disaster-affected communities. J.
Contingencies Crisis Manag. 2019, 27, 224–236. [CrossRef]
24. Aspinwall, L.G.; Sechrist, G.B.; Jones, P.R. Expect the best and prepare for the worst: Anticipatory coping
and preparations for Y2K. Motiv. Emot. 2005, 29, 357–388. [CrossRef]
25. Samah, A.A.; Zaremohzzabieh, Z.; Shaffril, H.A.M.; D’Silva, J.L.; Kamarudin, S. Researching natural disaster
preparedness through health behavioral change models. Am. J. Disaster Med. 2019, 14, 51–63.
26. Dittrich, R.; Wreford, A.; Butler, A.; Moran, D. The impact of flood action groups on the uptake of flood
management measures. Clim. Chang. 2016, 138, 471–489. [CrossRef]
27. Schlef, K.E.; Kaboré, L.; Karambiri, H.; Yang, Y.C.E.; Brown, C.M. Relating perceptions of flood risk and
coping ability to mitigation behavior in West Africa: Case study of Burkina Faso. Environ. Sci. Policy 2018,
89, 254–265. [CrossRef]
28. Liu, Y.; Ouyang, Z.; Cheng, P. Predicting consumers’ adoption of electric vehicles during the city smog crisis:
An application of the protective action decision model. J. Environ. Psychol. 2019, 64, 30–38. [CrossRef]
29. Strahan, K.; Watson, S.J. The protective action decision model: When householders choose their protective
response to wildfire. J. Risk Res. 2019, 22, 1602–1623. [CrossRef]
30. Papagiannaki, K.; Kotroni, V.; Lagouvardos, K.; Papagiannakis, G. How awareness and confidence affect
flood-risk precautionary behavior of Greek citizens: The role of perceptual and emotional mechanisms. Nat.
Hazards Earth Syst. Sci. 2019, 19, 1329–1346. [CrossRef]
31. Twerefou, D.K.; Adu-Danso, E.; Abbey, E.; Dovie, B.D. Choice of household adaptation strategies to flood
risk management in Accra, Ghana. City Environ. Interact. 2019, 3, 100023. [CrossRef]
32. Zhou, L.; Wu, X.; Ji, Z.; Gao, G. Characteristic analysis of rainstorm-induced catastrophe and the
countermeasures of flood hazard mitigation about Shenzhen city. Geomat. Nat. Hazards Risk 2017, 8,
1886–1897. [CrossRef]
33. Ding, N.; Yu, F.; Liu, J.; Wang, T.; Hua, P.; Gao, Y. Variation trends of precipitation in Shenzhen from 1961 to
2011. J. Water Resour. Water Eng. 2017, 28, 61–64.
34. Chen, Z.; Wang, H.; Zhang, X. Research on a new-generation of rainstorm intensity formula for Shenzhen
City. J. Nat. Disasters 2007, 16, 29–34.
35. Cui, P.; Guan, Y.; Zhu, Y. Flood Loss Prediction of Coastal City Based on GM-ANN. In Proceedings of the
International Conference on Grey Systems and Intelligent Services (GSIS), Stockholm, Sweden, 8–11 August
2017; pp. 187–190.Int. J. Environ. Res. Public Health 2020, 17, 5945 15 of 15
36. Tanner, A.; Árvai, J. Perceptions of Risk and Vulnerability Following Exposure to a Major Natural Disaster:
The Calgary Flood of 2013. Risk Anal. 2018, 38, 548–561. [CrossRef] [PubMed]
37. Lindell, M.K.; Arlikatti, S.; Huang, S. Immediate behavioral response to the 17 June 2013 flash floods in
Uttarakhand, North India. Int. J. Disaster Risk Reduct. 2019, 34, 129–146. [CrossRef]
38. Meyer, M.A.; Mitchell, B.; Purdum, J.C.; Breen, K.; Iles, R.L. Previous hurricane evacuation decisions and
future evacuation intentions among residents of southeast Louisiana. Int. J. Disaster Risk Reduct. 2018, 31,
1231–1244. [CrossRef]
39. Lemée, C.; Fleury-Bahi, G.; Navarro, O. Impact of Place Identity, Self-Efficacy and Anxiety State on the
Relationship Between Coastal Flooding Risk Perception and the Willingness to Cope. Front. Psychol. 2019,
10, 499. [CrossRef]
40. Babcicky, P.; Seebauer, S. Unpacking Protection Motivation Theory: Evidence for a separate protective and
non-protective route in private flood mitigation behavior. J. Risk Res. 2019, 22, 1503–1521. [CrossRef]
41. Bubeck, P.; Botzen, W.J.W.; Laudan, J.; Aerts, J.C.J.H.; Thieken, A.H. Insights into Flood-Coping Appraisals of
Protection Motivation Theory: Empirical Evidence from Germany and France. Risk Anal. 2018, 38, 1239–1257.
[CrossRef]
42. Zaalberg, R.; Midden, C.J.H. Living Behind Dikes: Mimicking Flooding Experiences. Risk Anal. 2013, 33,
866–876. [CrossRef] [PubMed]
43. Botzen, W.J.W.; Kunreuther, H.; Czajkowski, J.; de Moel, H. Adoption of Individual Flood Damage Mitigation
Measures in New York City: An Extension of Protection Motivation Theory. Risk Anal. 2019, 39, 2143–2159.
[CrossRef] [PubMed]
44. Peng, L.; Tan, J.; Lin, L.; Xu, D. Understanding sustainable disaster mitigation of stakeholder engagement:
Risk perception, trust in public institutions, and disaster insurance. Sustain. Dev. 2019, 27, 885–897.
[CrossRef]
45. Fox-Rogers, L.; Devitt, C.; O’Neill, E.; Brereton, F.; Clinch, J.P. Is there really “nothing you can do”? Pathways
to enhanced flood-risk preparedness. J. Hydrol. 2016, 543, 330–343. [CrossRef]
46. Dittrich, R.; Francis, B.; Hatzinger, R.; Katzenbeisser, W. A paired comparison approach for the analysis of
sets of Likert-scale responses. Stat. Model. Int. J. 2016, 7, 3–28. [CrossRef]
47. van Valkengoed, A.M.; Steg, L. Meta-analyses of factors motivating climate change adaptation behaviour.
Nat. Clim. Chang. 2019, 9, 158–163. [CrossRef]
48. Agbo, A.A. Cronbach’s Alpha: Review of Limitations and Associated Recommendations. J. Psychol. Afr.
2010, 20, 233–239. [CrossRef]
49. Arunrat, N.; Wang, C.; Pumijumnong, N.; Sereenonchai, S.; Cai, W. Farmers’ intention and decision to adapt
to climate change: A case study in the Yom and Nan basins, Phichit province of Thailand. J. Clean. Prod.
2017, 143, 672–685. [CrossRef]
50. Viglione, A.; Di Baldassarre, G.; Brandimarte, L.; Kuil, L.; Carr, G.; Salinas, J.L.; Scolobig, A.; Blöschl, G.
Insights from socio-hydrology modelling on dealing with flood risk—Roles of collective memory, risk-taking
attitude and trust. J. Hydrol. 2014, 518, 71–82. [CrossRef]
51. Lawrence, J.; Quade, D.; Becker, J. Integrating the effects of flood experience on risk perception with responses
to changing climate risk. Nat. Hazards 2014, 74, 1773–1794. [CrossRef]
52. Lee, Y.; Tung, C.; Lin, S. Attitudes to climate change, perceptions of disaster risk, and mitigation and
adaptation behavior in Yunlin County, Taiwan. Environ. Sci. Pollut. Res. Int. 2019, 26, 30603–30613.
[CrossRef] [PubMed]
53. Huang, J.; Cao, W.; Wang, H.; Wang, Z. Affect Path to Flood Protective Coping Behaviors Using SEM Based
on a Survey in Shenzhen, China. Int. J. Environ. Res. Public Health 2020, 17, 940. [CrossRef] [PubMed]
© 2020 by the authors. Licensee MDPI, Basel, Switzerland. This article is an open access
article distributed under the terms and conditions of the Creative Commons Attribution
(CC BY) license (http://creativecommons.org/licenses/by/4.0/).You can also read