Information visualization in context of modern education megatrends
←
→
Page content transcription
If your browser does not render page correctly, please read the page content below
E3S Web of Conferences 284, 09011 (2021)                                   https://doi.org/10.1051/e3sconf/202128409011
TPACEE-2021

         Information visualization in context of modern
         education megatrends
         Nadezhda Izotova1, Marina Klimenko1, and Elena Nikolaenko1,*
         1
         Bryansk State University, 14, Bezhitskya Str., 241036, Bryansk, Russia

                       Abstract. In light of technological advancement and formation of new
                       visual culture, there arises a vital problem of visual presentation of
                       information for solving new problems and performing a wider range of
                       functions in education. In this regard, visualization should be considered in
                       context of such megatrends as the Prosumer concept, knowledge
                       management, the use of platform services to present information as a single
                       unity. Cognitive visualization as the basis for visual presentation of
                       educational information is represented by five main tendencies which
                       students should take into consideration creating infographics:
                       concentration and generalization of knowledge, expansion of the
                       orientation and presentation functions of visual aids, algorithmization of
                       educational and cognitive actions by visual means, and multicode
                       presentation of information. Experimental training resulted in establishing
                       connections between these megatrends and the cognitive visualization
                       tendencies; besides it revealed that concentration of knowledge and
                       multicode presentation of information were the most difficult information
                       visualization operations for the students when using platform services for
                       creating visual content.

         1 Introduction
              Technological progress and the formation of visual culture inevitably makes impact on
         the set of requirements for the modern education system. The information saturation of the
         modern educational space and its active digitalizationat present require rethinking all
         structural components of education process. In this case, modern megatrends are used as an
         undoubtful benchmark, which determine the vector of the development of teaching tools
         and methods, and also regulate the restructuring of all teaching aids in a new context,
         endowing them with new tasks and functions.
              The need for more compact and effective teaching tools is becoming one of the most
         important tasks for society which needs to systematize and optimize the assimilation of
         knowledge (Kurilkina 2014). For further accumulation, assimilation, storage, processing
         and transmission of information there are required new, compact, mobile means of
         reflecting the objective world in the person’s mind. Visualization is one of these tools.
              Visualization of information plays an important role in educational process of any level;
         it is based on specific preparation of teaching aids and materials before presenting them to

         *
             Corresponding author: vicpost@inbox.ru

   © The Authors, published by EDP Sciences. This is an open access article distributed under the terms of the Creative
   Commons Attribution License 4.0 (http://creativecommons.org/licenses/by/4.0/).
E3S Web of Conferences 284, 09011 (2021)                            https://doi.org/10.1051/e3sconf/202128409011
TPACEE-2021

         students. The interest in visualization is conditioned by the course of humankind
         development itself, the increasing flow of information to process which traditional means
         and methods are unsuitable and too complex. The visualization principle, or "the golden
         rule of didactics", has been known since the time of Jan Amos Komenský who declared that
         everything is arranged from above for harmony, so that everything which is higher can be
         represented by that which lower, that which is absent – by that which is present, the
         invisible – by the visible (Komenský 2000,p.300).Later the visualization principle in
         pedagogical science was developed in the works of Johann Heinrich Pestalozzi and
         Konstantin D. Ushinsky. In the Russian teaching methodology one of the vivid examples of
         the use of visualization is the use of “supportive”reference signals developed by Viktor F.
         Shatalov.
             Visualization is understood as any way of ensuring observability of reality, and by the
         result of visualization or a visual model - any visually perceived structure that imitates the
         essence of the object of cognition (Izhdeneva 2015, p. 112). Visualization is treated as the
         transfer in the process of cognitive activity, from the inner plane to the outer plane, of
         mental images the form of which is spontaneously determined by the mechanism of
         associative projection (Schema Theory of R.S. Anderson and F. Bartlett, Frame Semantics
         of Charles J. Fillmore, M. Minsky, etc.). At the same time, visual information undergoes
         various transformations caused by psychological mechanisms of sensation, perception,
         representation, awareness and understanding.
             The printed text as a source of information is built on the principles of disengaging the
         content from reality, it is characterized by such features as linearity, consistency,
         objectivity, rationality. These features form a way of thinking similar in its structure
         somewhat similar to some extent to the structure of a printed text (Akhmetova 2009, p. 48-
         52). Meanwhile, visual images in photography, cinema, radio, television create structures
         that are significantly different from the structure of printed text. These visual structures
         create models of recognition, make focus on imagery, emotionality and irrationality.The
         psychological processes of sensation, perception, representation, awareness, understanding
         lie between the visual model and the visual object (Beresteneva, 17). Thus, visualization is
         a general name for the methods of presenting numerical information or a physical
         phenomenon in a form convenient for visual observation and analysis.
             Recently considerable attention has been paid to cognitive visualization - a more
         complex phenomenon since it is not just the illustration of the subject under study but also
         its subsequent transformation and rethinking. Under cognitive-visual technology of
         presenting information, O.A. Kondratenko understands "a system of logically built and
         sequential actions aimed at visual transformation of educational material, the purpose of
         which is to increase the efficiency of work with educational information by activating
         cognitive processes" (Kondratenko 2013, p. 86). O.O.Knyazeva argues that cognitive-visual
         approach “allows to take into account individual characteristics of students and contributes
         to the development of their visual thinking” (Knyazeva 2003, p. 10). The essence and
         difference between cognitive visualization and the visualization principle is the shift of
         emphasis from the illustrative function in educating to the development of cognitive
         abilities and critical thinking. Thus, we can conclude that it is necessary to ensure
         suchconditions of learning which focus on using potentials of students' visual thinking.
             We can also say that visualization is an intermediate link between educational material
         and learning outcomes. It is a kind of cognitive-evaluative mechanism that allows you “to
         condense" the process of cognition, to remove minor details from it and thus, improve and
         optimize it.The main functions of visualization in educational process are 1) ensuring
         synthesis of knowledge; 2) visual and indirect presentation of studied phenomenon in areas
         where visual perception is difficult or impossible; 3) increasing students’ motivation to
         learn, since learning process itself becomes more diverse and interesting. From the didactic

                                                       2
E3S Web of Conferences 284, 09011 (2021) https://doi.org/10.1051/e3sconf/202128409011
TPACEE-2021
point of view, the use of visualization tools can perform general and specific functions in
education (Makarova 2009, p. 13).
Among specific functions we can find motivating, clarifying, organizing, regulatory,
operational, explaining, empirical, ideographic, interpreting and heuristic functions. To
common functions belonginformativeness, integrity, instrumentality, adaptability andbeing
compensatory in nature(Makarova 2009, p. 13).
At the same time, changes in higher education, the inevitable consequence of which are
reforms in the field of the content of general scientific and professional training, the
creation of new models of education process, significantly expand the functionality of
visualization tools. New tasks and functions of these tools appear in the context of the
implementation of the so-called megatrends in education which reflect the ongoing
changes in the structure and approaches to the organization of education. We claim that
they determine the vectors and direction of the further development of means of visual
presentation of information.
Thus, the idea of visualization of educational information goes beyond the framework
of its traditional interpretation functioning as a tool for the implementation of modern
megatrends in education.
The overall aim of this research is to establish the relationship between visualization of
educational information with modern trends in education by analyzing ways and methods
of implementing strategies of cognitive visualization of information by students when
designing infographics.
2 Materials and methods
To achieve the research goal - analyzing the relationship with modern megatrends in
education –careful analysis of literature on research problems was carried out; ways and
means of implementing these trends in the visual presentation of information in educational
process were identified (on the basis of infographics). The theoretical methods which were
applied, like analysis, synthesis, systemic research method, modeling, made it possible to
identify a set of main trends that could potentially influence the use of visual means of
presenting information. The analysis of research works on the problems of cognitive
visualization made it possible to single out a set of basic trends in cognitive visualization
involved in the creation of visualized educational content - infographic texts. To confirm
the relationship and analyze it, we organized pilot training in which students were offered
to independently create the means of visual presentation of information (infographics) using
cognitive visualization techniques based on platform services. The participants of this
experiment were 27 students of language educational program specialization of the first and
second years of study (language proficiency level B2-B2 +) of Bryansk State University
named after academician I.G. Petrovsky. The pilot training has three stages.
Preparatory stage. The teacher presents a problem for which visual content is to be
developed, describes the specifics of this problem and clarifies the content, i.e., a set of
content elements that should be reflected in the infographics they will create. The problem
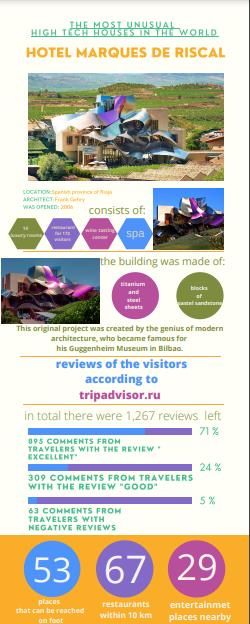
“HIGH-TECH HOUSES” was proposed as a thematic basis for the experiment. Further on,
the participants were given a detailed instruction made by the teacher beforehand. The
sample of the instruction is given in Table 1.
3E3S Web of Conferences 284, 09011 (2021) https://doi.org/10.1051/e3sconf/202128409011
TPACEE-2021
Table 1. Instructions for designing infographics “HIGH-TECH HOUSES”.
Comments/
Project “HIGH-TECHHOUSES”
Time
TASK Creating an infographic
Collect information on the topic
STEP 1
Make a hotlist on the topic
Choose 2-3 unusual houses (description/photo from
STEP 2
the outside and inside (if possible)
Specify the location of the houses (country, city,
region, district)
Name their creators/designers
STEP 3 Provide the description of their peculiarities (size,
shape, decoration, materials they are made of etc.)
Present statistics concerning their popularity
(number of visitors, ticket price etc.)
Use the site
(https://piktochart.com/
/https://www.canva.com//https://wordwall.net/
STEP 4
/https://www.renderforest.com/
Choose the template, structurize the information you
have collected according to the template
Edit your infographic by adding images, statistics
STEP 5
and text
Main stage. At the main stage the students developed infographics following the
instructions and then presented the results on one of the selected platform services. A group
of teachers (5 persons) made expert assessment of this created content following the criteria
given in Table 2.
The given criteria reflect the requirements for visual content that can become
educational, provided that each of the indicators is well achieved. The following assessment
scale was used: 0 - does not correspond, 1 - weakly corresponds, 2 - generally corresponds,
3 - fully corresponds (the maximum value is 21 points). The suitability of infographics for
use as educational content was considered possible under the conditions: 1) the absence of
zero indicators, 2) if the average indicator is 12 points or more.
Table 2. Analysis of the final visual product.
Principle of
visual content Comments on the final product
formation
Infographics is chosen as eye-catching visual content which contains a
Conformation
minimum amount of text
Information provided is not distorted. All aspects of the problem are
Authenticity
considered
The image is of good quality, image resolution – 800x2000, with crisp,
Quality
sharp details, SVG format
Completeness There aresome extra clarifying data in form of color-scheme
Consistency The material is logically presented
Information is easy to perceive because of simple visual objects of the
Simplicity
infographics
Information is given in a concise way. No overloading with a large
Optimality
amount of information
Final stage. At this stage the participants were asked to evaluate their experience of
creating infographics, considering also the implementation of cognitive visualization trends.
The participants completed a Vizualization Questionnaire, which included questions about
4E3S Web of Conferences 284, 09011 (2021) https://doi.org/10.1051/e3sconf/202128409011
TPACEE-2021
the process of creating-infographics experience. In accordance with the general purpose of
the study, the following research question was formulated: To what extent was it difficult to
develop strategies of creating infographics. The main questions are given in Table 3.
Table 3. Questionnaire on students’ experience of designing infographics.
Question Possible answers
Did you like this form of working with
Yes / No / Don’t know
information?
How difficult was it for you to search and select
1(easy)/2(average difficult) /3(difficult)
the information for the Internet project?
How difficult was it for you to generalize
information andsingle out key characteristics of 1 (easy) / 2 (averagedifficult) / 3 (difficult)
objects under study from the data you found?
How difficult was it for you to select a template
1 (easy) / 2 (averagedifficult) / 3 (difficult)
for presenting the data you found in the project?
How difficult was it for you to present the material
1 (easy) / 2 (averagedifficult) / 3 (difficult)
in a structured way?
How difficult was it for you to choose the form of
presenting your information (image, figure, 1 (easy) / 2 (averagedifficult) / 3 (difficult)
diagram, sign, etc.)?
1.according to the template
2.created a mental image of the object and
Working on the structure of the document / object,
then transferred it to the template
you organized the information
3. acted chaotically, without taking into
account the material that was collected
The results of the research made it possible to analyze the experience of using trends of
cognitive visualization in the context of the implementation of megatrends in teaching
foreign language in higher education institutions.
3 Results
3.1 Modern trends of education in visualizing information
The analysis of research works on the problems of the development of modern education let
us single out a set of megatrends that affect such a component of educational process as
information visualization. The main megatrends that influence the development and use of
visual teaching aids, in our opinion, are the following:
1) the emergence of the concept of "prosumer” which implies that the modern
student acts as a consumer and a producer all at once, hence it is necessary not only to use
visualization tools in educational process so as to demonstrate education content but also to
involve students in producing this education content by means of creating visualization
tools by themselves,
2) knowledge management which includes gathering, structurizing, updating
information, and by students themselves too, so as to continually replenish the information
base with visual teaching aids thus contributing to its continued functioning,
3) the use of platform services as the basis for the integration of various services and
educational products that make it possible to present information visually asonesingle unity.
Below is a detailed description of these megatrends.
5E3S Web of Conferences 284, 09011 (2021) https://doi.org/10.1051/e3sconf/202128409011
TPACEE-2021
3.1.1 ‘Prosumerism’ in Education
The term ‘Prosumerism’ was first coined by Alvin Toffler in his book ‘The Third Wave’ to
denote people who produce some of the goods and services they then consume
themselves—for example by making their own clothes, building their own cars, or
cultivating vegetables for their kitchen (Toffler, 1980). Toffler envisaged a time when
consumers would increasingly play a role as co-collaborators in production and supply
chains, with the capacity to alter the design and the attributes of a product they wanted.
In the Higher Education sector, prosumerism has been associated with the shift towards
‘learner-centred’ teaching and learning activities, with the emphasis on student engagement
and the co-production of knowledge. The argument is that greater student engagement in
the teaching and learning process, and greater co-ownership of learning content, has a
beneficial effect on learning outcomes (Bryson & Han, 2007; Barklay, 2010). A typical
approach applied across a spectrum of learning settings, including higher education, is the
application of a ‘blended learning’ pedagogy, combining face to face teaching with a wide
range of digital tools, with different tools being applied for different pedagogic purposes.
For example, ‘mind-mapping’ tools aim to support students to link concepts and visualize
them; simulations are applied to help students develop problem-solving and ‘trouble-
shooting’ skills; wikis are applied to support collaborative learning and student blogs to
disseminate the content created by students in their assignments.
Thus, acquiring knowledge and skills to create their own content connected with
information visualization is sure to enable students to solve many-fold tasks and carry out
numerous assignments becoming creative, collaborative participants of the learning
process. Content Creation—requires them to use digitaltechnologies to support learners to
express themselves through digital means and to modify and create digital content in
different formats (Caena&Redecker, 2019).
In this respect, analysis of scientific studies and research results on visualization
highlights and puts forward infographics as an educational tool of the greatest potential for
the implementation of the megatrend consisting in the independent creation by the student
of educational content with its subsequent use for organizing his own activities, improving
various speaking skills and building interaction with other participants of educational
process.
3.1.2 Management of Knowledge
Ourpresent-day knowledge society is based on increasing competition of individuals
possessing not only knowledge but also constantly acquiring new knowledge and capableof
creating this knowledge (Zhilina 2012, p. 186-187).
Today’s society is fast-paced and it requires each individual to constantly master new
knowledge which leads to increasing information load on every student and makes
important not only the skills of searching for knowledge but also its updating and
determining its priority. At the same time, knowledge creation skills such as skills in
design, research and information analysis, are important asnever before (Zhilina 2012, p.
186-187). And hence the same important are the skills of presenting the results of
information processing in form suitable for its subsequent assimilation and analysis.
Among knowledge use skills we can find skills of solving problems, creating new products
and disseminating knowledge. All the above mentioned skills should be defined as
"knowledge management" skills, or, if to say more precisely, knowledge self-management
skills (Zhilina 2012, p. 186-187).
6E3S Web of Conferences 284, 09011 (2021) https://doi.org/10.1051/e3sconf/202128409011
TPACEE-2021
In this regard, an important skill is presentation of information under study in visual
form with the purpose of its subsequent use as educational content not only by students who
created it but also by all other students.
3.1.3 Using platform services as the basis for the integration of various services
and educational products that make it possible to present information visually as
one single unity
When we speak about students’ independent creation of educational content the following
problem comes to the fore: how to choose the most optimal service for creating various
kinds of infographic texts, with a sufficient set of tools for editing and subsequent
presentation.
In this situation, the role of the teacher is to introduce tostudents various services by
providing them with links and a brief description of the options these services offer to
create visual content within the framework of the problem under study.
3.2 Cognitive visualization tendencies
In this research we consider cognitive visualization as a technique of forming and
improving knowledge management skills for each individual student. In the process of
visualization, a person who makes knowledge "visible" mobilizes resources of figurative,
logical and complex thinking, as well as aesthetic, cultural and artistic potential as well as
other important personal qualities (Manko, 2009). The main goal of cognitive visualization
is the development of methods and means of purposeful creation of mental images in the
process of educational and cognitive activity and the presentation of these images in form
accessible for perception. In this case, the product of cognitive visualization is a mental
image formed by man’s consciousness that determines the object (phenomenon) under
study and is represented in the external plane of education process (Manko, 2009).
We argue that infographics as a graphical way of presenting information can be treated
as a material product of cognitive visualization.
The process of creating a mental image as the basis of infographics is based on five
tendenciesof cognitive visualization, each of which reflects the essence of the student's
educational actions and is represented by certain visual knowledge representation
technologies (Manko, 2009).
Following Natalia N. Manko’s theory, we also consider these tendencies as a
methodological basis for organizing students’ activities of creating infographics.
1. Concentration of knowledge involves an increase of density and richness of
information mastered by the student. This tendency manifests itself in the technologies of
compression and consolidation of the material which students study to create infographics.
This tendency is responsible for the formation of basic knowledge that ensures that a
generalized and figuratively structured idea about the object under study is complete.
2. Generalization of knowledgeis the presentation of the essential conceptual semantic
core of the concept under study, refined from details, trite descriptions, etc. This tendency
is based on technologies that contribute to the optimization of methods for processing large
amounts of information in a short time. In particular, it deals with meaning generalizations,
i.e., highlighting the most general concepts associated with the object (phenomenon) under
study.
3. Expansion of the orientation and presentation functions of visual aids (visual
support tendency)is the location of important educational material in a logical sequence
using “supportive” reference signals and keywords.
7E3S Web of Conferences 284, 09011 (2021) https://doi.org/10.1051/e3sconf/202128409011
TPACEE-2021
4. Algorithmization of educational and cognitive actions by visual meansis a stage-
by-stage formation of knowledge general images by means of analyzing, singling out
elements and their relationships.
5. Multicode presentation of information is the simultaneous use of different forms of
naming information using various verbal, visual, multimedia, digital material codes, like an
object, image, word, abbreviation, symbol, picture, drawing, graphics, pictogram, number,
model.
3.3 Description of the experience of creating infographics based on cognitive
visualization tendencies
Based on the results of trial training, the students created infographics in accordance with
all the requirements. They created 27 infographic teaching aids on the problem“HIGH-
TECH HOUSES”. The examples of students’ works are shown in Figures 1.
Fig. 1. The example of student’s work.
The assessment of the created products showed that 14.8% (4 out of 27) of the works
did not score the required number of points and thus do not satisfy the requirements to be
used as educational content (they scored zero or their point total was no more than 11). At
8E3S Web of Conferences 284, 09011 (2021) https://doi.org/10.1051/e3sconf/202128409011
TPACEE-2021
the same time the experts considered 23 works (85.2%) satisfying the requirement to be
included in education process as teaching materials in accordance with the selected criteria.
The questionnaire resultson the students’ use of cognitive visualization tendencies as a
basis for development of knowledge management skills when creating infographics are
given in Table 4.
Table 4. Questionnaire results on students’ experience of designing infographics.
Question Yes Don’t know No
Did you like this form of working with 92.6 % 2.4%
-
information? (25) (2)
average
easy difficult
difficult
How difficult was it for you to search and
22.2% 63% 14.8%
select the information for the Internet
(6) (17) (4)
project?
How difficult was it for you to generalize
information andsingle out key 55.6% 33.3% 11.1%
characteristics of objects under study (15) (9) (3)
from the data you found?
How difficult was it for you to select a
66.6% 22.2% 11.1%
template for presenting the data you
(18) (6) (3)
found in the project?
How difficult was it for you to present the 44.45% 44.45% 11.1%
material in a structured way? (12) (12) (3)
How difficult was it for you to choose the
37.05% 44.45% 18.5%
form of presenting your information
(10) (12) (10)
(image. figure. diagram. sign. etc.)?
It is obvious that designing infographics provokes the interest of the majority of the
students. Among the cognitive visualization tendencies which are reflected in the students’
actions the most difficult was multicode naming of information (10 out of 27)since many
students failed to select correctly a system of images to represent information or
experienced difficulties in selecting one of these forms.
Less difficult it was to work with knowledge concentration, generalization and
algorithmization realized by visual means - only11,1% of the participants found it not easy.
The easiest for the students wasvisual support tendencies since the participants relied
mainly on ready-made templates of platform services they used - 66.6% (18 out of 27) built
the logics of presenting structural links on the basis of a template.
4 Discussion
Infographics has the greatest potential for the implementation of the megatrend of
independent creation of educational content with its subsequent use for organizing personal
activities, improving various speaking skills and organizing interaction with other
participants of education process.
In relation to language teaching, infographics is defined as a visual aid, a means of
teaching, a way of teaching, a principle of teaching, etc. Anna E. Basyrova claims that
infographics is such a kind of information presentation that can be both a means and a way
of teaching at once.The researcher uses this term speaking about "a way of presenting
information, information, data or knowledge using a combination of verbal and illustrative
components, designed for fast and concise presentation of a problem under study, and also
designed to improve the perception of information and to encourage the student to read it";
9E3S Web of Conferences 284, 09011 (2021) https://doi.org/10.1051/e3sconf/202128409011
TPACEE-2021
and also puts forward the term "infographic text" considering infographics to be a kind of
creolized texts (Basyrova 2016, p.24).
Discussing the problem of infographics as one of the actively used visual types of
content, Olga V. Khomenko speculates what characteristics objects should have to make
information accessible for perceiving: information value, accessibility of presented
material, relevance of the information and simple form of its presentation (Khomenko
2018,p.96). Studying samples of infographics, the researcher singled out several
characteristics of high-quality visualization - integrity, simplicity, visual expression,
information value, relevance and interestingness.
Elements of infographics have great potential when used for teaching vocabulary in
foreign language classroom, expanding students’ vocabulary and developing speaking and
writing skills.
Thus, in foreign language classroom, infographics is aimed at solving the following
tasks:
1) providing more information other than textbook,
2) explaining concept or presenting process,
3) drawing analogies and making comparisons,
4) being an intermediary in sharing data,
5)provingprovocative ideas for organizing and conducting discussions, debates, brain
storming.
The independent creation of infographics by students as an element of the knowledge
management system involves the use of all five tendencies ofinformation cognitive
visualization and can be presented as a process that includes three stages: preparatory, main
and final. The content of each stage and its correlation with cognitive visualization
tendencies are presented in Table 5.
Table 5. Stages of students' creating infographics.
Visual
Visualization
Stage Content presentation
tendency
technologies
- first acquaintance with the
concept/phenomenon
- search for information compression
Concentration of
Preparatory - identification of basic
knowledge
knowledge that most fully consolidtion
characterizes the concept
/phenomenon
- singling out the most general
meaning
concepts associated with the
generalization
object/phenomenon under study Generalization of
images
- choosing the logics of locating knowledge
logical
studied phenomena,
constructs
Main characteristics and actions
- selecting factual material for its Expansion of the
presentation in infographics orientation and
framestructuring
- building visual support presentation functions
visual support
- choosing a template for of visual aids (visual
infographics support tendency)
- forming a general image of an
object/phenomenon based on Algorithmization of
analysis, selection of elements educational and data
Final
and their relations cognitive actions by arrangement
- arranging the structural visual means
elements of the template in
10E3S Web of Conferences 284, 09011 (2021) https://doi.org/10.1051/e3sconf/202128409011
TPACEE-2021
necessary sequence according to
the logics of the presentation of
the created mental image of the
object/phenomenon
- choosing forms of naming multicode
sign and
information for each structural presentation of
semantic coding
element of the mental image information
Creating infographics involves the use of appropriate platform services. As part of the
given research, we have studied and analyzed several online infographics creating services
of various kinds as a type of visual content. The brief information about them is given in
Table 6.
Table 6. Overview of infographicscreation services.
Name of service Brief description Link
Online editor
Offers the user great opportunities for
developing and presenting information in
infographic format.
The user can choose a necessary template
from 400 professionally designed
https://piktochart.com/
Pictochart templates of infographics, posters, reports
and presentations in the library editor, or
can start his project.
Has a library of 4,000 icons and images,
editable frames whichallow to
combineeasily a text with visuals and
photographs.
Freegraphics editor.
Good for design novices as well as
https://www.canva.com/
Canva professionals. Allows you to quickly and
easily make creative videos, presentations
and other visuals.
Can be used to create both interactive and
printed materials. Many templates are
available in both online and print
versions.
Can be used on different gadgets - a
computer, tablet, phone, or whiteboard.
https://wordwall.net/
Wordwall Can be shown by students themselves, or
by students under the supervision of a
teacher.
Printed materials can be printed out or
downloaded as a PDF file. They can be
used as additional material for interactive
means or as independent assignments.
The platform for free creation of videos,
animation videos, product or service
commercials, kinetic typography projects,
animation logos, etc.
Offers ready-made templates which https://www.renderforest.com/
Renderforest
greatly simplifies your work, but at the
same time does not deprive it of
uniqueness.
Has about 400 templates for commercials,
slideshows, presentations and animated
11E3S Web of Conferences 284, 09011 (2021) https://doi.org/10.1051/e3sconf/202128409011
TPACEE-2021
logos.
Has a large library - about 200,000 stock
videos, dozens of unique commercial
soundtracks. A simple online video editor
and voice-over tool. Import of your
pictures, audio and video.
Thus, the creation of infographics involves the students' developing knowledge
management skills based on gathering, structuring and arrangement of information while
creating a visual product. This process involves the use of the main tendenciesof visual
representation of knowledge: generalization and concentration of knowledge, creation of a
logical and semantic support, knowledge algorithmization and informationmulticode
presentation.
5 Conclusion
Visual presentation of information is an integral part of education process. It is the correctly
selected visual content which determines the level of perception, memorization and
subsequent reproduction of information within the framework of material under study.
In the situation when a student performs both as a consumer and a creator of educational
content, managing at the same time the created visual information resource, improving and
transforming it in accordance with changing goals, objectives and conditions based on the
use of various platform services, the use of infographics as an educational tool allows
systematically and in a stage-by-stage way to implement the main megatrends in education.
Infographics as one of the methods of cognitive visualization makes it possible, first, to
independently create visual content using a system of precisely formulated sequential
educational actions - of concentrating and generalizing knowledge, structuring educational
material, algorithmisizing educational and cognitive actions and multicode presentation of
information (as a simultaneous use of different forms of information presentation).
Secondly, because of the necessity to use various tools when creating this content, it is
required to search for platform services thus resulting instudents’ working with a variety of
services to create different kinds of infographic materials. this also implements the
megatrend of the integration of various services and educational productsallowing you to
present information visually as a single unity.
References
1. L.V. Akhmetova, Vestnik TSPU 7, 48–52 (2009)
2. A.E. Basyrova, Materials of the IV International Scientific and Methodological
conference (Voronezh, Nauchnayakniga, 2016)
3. O.G. Beresteneva, Cognitive graphics in social and psychological research (2013)
http://cyberleninka.ru/article/n/kognitivnaya-grafika-v-sotsialno-psihologicheskih-
issledovaniyah
4. C. Bryson, L. Hand, Innovations in Education and Teaching International 44(4), 349–
362 (2007) http://dx.doi.org/10.1080/14703290701602748
5. F. Caena, C. Redecker, European Journal of Education, Research and Policy 54, 356–
369 (2019)
6. A.I. Zhilina, Regional education of XXI century: problems and perspectives 4, 184-192
(2012)
7. I.V. Izhdeneva, Vestnik KSPU named after V.P. Astafiev 1(31), 53–157 (2015)
12E3S Web of Conferences 284, 09011 (2021) https://doi.org/10.1051/e3sconf/202128409011
TPACEE-2021
8. O.O. Knyazeva, Implementation of the cognitive-visual approach in teaching high
school students the basics of mathematical analysis: dissertation, PhD in pedagogic
sciences (Omsk, 2003)
9. J.A. Komenský, Selected pedagogical writings (Moscow, 2000)
10. O.O. Kondratenko, Theory and practice of social development 6, 84–88 (2013)
11. V.N. Kurilkina, Vestnik of M.K. Ammosov North-Eastern Federal University 1, 73–77
(2014)
12. E.A. Makarova, Visualization as a way of structuring knowledge and forming mental
space (Taganrog, Taganrog Institute of Management and Economics, 2009)
13. N.N. Manko, Izvestia of Ural Branch of the Russian Academy of Sciences 8(65), 10-30
(2009)
14. O.V. Khomenko, Educational technologies and society 1, 264-270 (2018)
15. A. Toffler, The third wave: The classic study of tomorrow (New York, NY, Bantam,
Google Scholar, 1980)
13You can also read