Informing Packaging Design Decisions at Toyota Motor Sales Using Life Cycle Assessment
←
→
Page content transcription
If your browser does not render page correctly, please read the page content below
Informing Packaging Design Decisions at Toyota Motor Sales
                        Using Life Cycle Assessment

              (Manuscript submitted to the Journal of Industrial Ecology)

1. SUMMARY

The environmental impacts of packaging manifest themselves at all life-cycle stages.
From raw material acquisition, to package manufacture, distribution, recycling and land-
filling, packaging systems deplete natural resources, consume energy, produce
hazardous waste and emit pollutants. Additionally, each of these stages carries a
financial cost. Driven by a desire to minimize financial costs and environmental burdens
associated with the packaging of accessory and service parts, Toyota Motor Sales
commissioned the Donald Bren School of Environmental Science and Management to
build a life-cycle-assessment-based decision support tool to assist the packaging
decision-making process. The Environmental Packaging Impact Calculator (EPIC)
provides full Life Cycle Assessment (LCA) and Life Cycle Costing (LCC) results that allow
packaging designers to compare options in daily decision-making and choose
environmentally preferable packaging systems. EPIC’s heavy parameterization allows
users to run a virtually limitless number of LCAs and LCCs using a single model. This
parameterization also allows results to be calculated from minimal user inputs in a
matter of minutes, requiring no pre-existing knowledge of LCA theory or methodology.
Finally, EPIC distills LCA results into management actionable metrics, and provides the
information early in the design process, when managers can affect downstream impacts
by designing smarter packaging systems.

2. INTRODUCTION

Companies looking to improve the environmental performance of their products and
supply chains must first generate the necessary information, and then move it into the
hands of individuals in a position to affect change. Toyota Motor Sales (TMS) faced this
predicament while trying to reduce the environmental burdens generated by packaging
for their service parts and accessories. TMS packaging design engineers and logistics
managers are in a position to decrease these environmental burdens through better
design and shipping systems. However, they currently lack the information required to
quantitatively assess and compare the impacts of packaging options and the expertise
necessary to conduct the assessments and interpret the results.

In 2007 TMS commissioned the Donald Bren School of Environmental Science and
Management to develop a tool that will allow TMS packaging engineers and logistics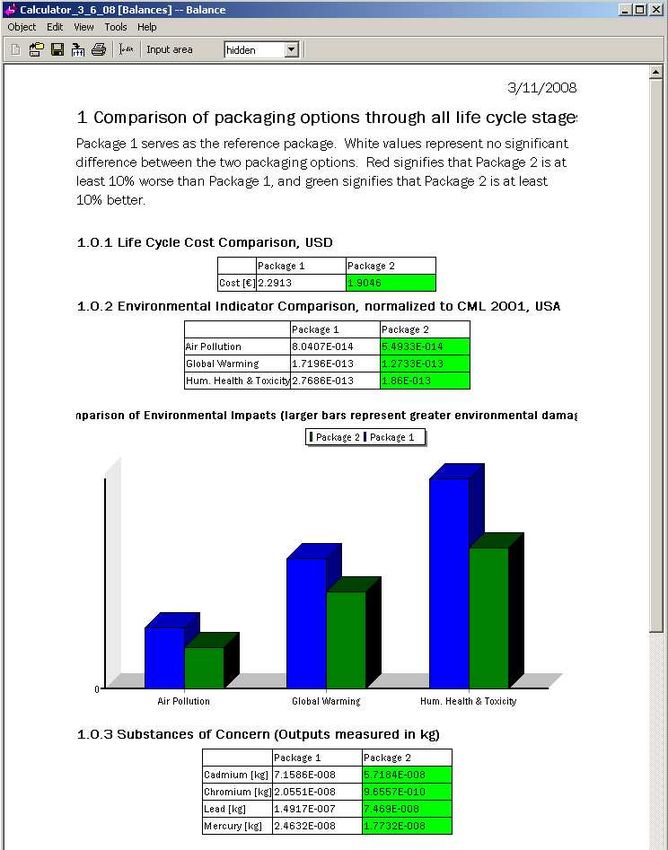
Informing Packaging Design Decisions at TMS using LCA
                                                           Corti, Early, Kidman, Lee, Geyer, McMullan

managers to perform complete Life Cycle Assessments (LCA) of packaging systems in a
format and time frame that facilitates informed decision making during package design.

The recently completed Environmental Packaging Impact Calculator (EPIC) will support
the packaging design decision-making process by providing real-time results of the life
cycle environmental impacts and financial costs of proposed packaging options. Based
on a highly parameterized model of the TMS packaging life cycle, EPIC users are able to
input minimal data for packaging specifics, and immediately receive results for
environmental performance and cost. EPIC is not a streamlined LCA; rather, EPIC
performs full LCA and Life Cycle Costing (LCC), and translates the results into a format
that allows packaging design engineers to incorporate findings into the packaging design
process.

This article describes the development and intended implementation of the EPIC tool. It
briefly presents background on the use and limitations of LCA in the packaging sector
and TMS’ environmental efforts regarding accessory and service part packaging to date.
It outlines the scope and creation of the EPIC tool based on highly parameterized, TMS-
specific data, and demonstrates how TMS plans to use EPIC in its packaging supply
chain.

3. BACKGROUND

3.1. Toyota Motor Sales (TMS)
TMS is the sales and distribution company for Toyota in the United States. In addition to
sales, marketing, and vehicle distribution, TMS is responsible for shipping accessories to
TMS-operated installation facilities, and service parts to independently operated
dealerships for vehicle maintenance and repair. The packaging used to protect these
parts during transport is designed primarily by packaging engineers at suppliers, but is
reviewed and directed by TMS packaging engineers. Both groups of packaging
engineers collaborate to address issues with new and existing packaging.

Across TMS, the parts distribution operation (distributors of service parts) accounts for
approximately 70% of all solid waste created, and a large contributor to that waste is
packaging. For the TMS vehicle distribution centers (installers of accessory parts), total
waste generation is smaller, but packaging accounts for an even higher proportion of
waste generation. For the past five years, TMS has been focused on downstream waste
management, achieving an average recycling rate of 90% at both parts distribution and
vehicle distribution operations. There have also been several initiatives to reduce
packaging purchasing through the use of returnable shipping modules (displacing
expendable wood pallets and cardboard). TMS recognizes that packaging design affects
a number of operations at TMS both environmentally and financially. However,

                                      Page 2 of 21
Informing Packaging Design Decisions at TMS using LCA
Corti, Early, Kidman, Lee, Geyer, McMullan
adjustments have been driven by problem-solving, rather than a systematic approach of
bringing information about those impacts back to the packaging engineers.
Several programs at TMS led to the desire for an LCA-based tool for packaging design.
The first is the TMS Five Year Environmental Action Plan, which has targets for both
reducing packaging and increasing recycling at TMS distribution centers. Initially,
environmentally related efforts in packaging were initiated to meet these waste
reduction and recycling goals, such as substituting materials that were difficult to
recycle with ones that are easier (e.g. substituting cardboard build-ups for expanded
polystyrene). But there was also a qualitative understanding that there were other
additional environmental benefits (e.g. from reduced primary material production) and
the possibility for trade-offs (e.g. return transportation of durable returnable shipping
modules) from these changes. As packaging changes became more sophisticated and
complicated, a method of evaluating all of the impacts was needed to determine if there
was a net environmental benefit from the change.
A more recent driver for EPIC is a global initiative to track and reduce packaging and
wrapping materials. The major Toyota companies in North America, Europe, and Asia
are collaborating to reduce and harmonize packaging for all markets. This project
focuses on both purchasing reductions and end-of-life management of packaging
materials. TMS is piloting the use of LCA as a tool for addressing the goals of this global
project.
Financially, there was also a recognition that packaging design affected downstream
TMS costs (such as logistics, inventory, and waste management), but there existed no
systematic way of passing that information back upstream (across several company
divisions) to the packaging designer, where the costs are most easily addressed.
A TMS team, therefore, approached the Bren School of Environmental Science and
Management at UC Santa Barbara with the proposal to develop a tool that:
• Assesses the life cycle environmental impacts of packaging in the TMS supply
chain
• Assesses the life cycle costs of packaging to TMS operations
• Uses TMS-specific data
• Is usable by packaging engineers with little environmental or LCA experience
• Can be shared with supplier packaging engineers without revealing TMS’
proprietary data
3.2. Life Cycle Assessment of Packaging
From the very beginning, the evaluation of product packaging played a major role in the
development and application of life cycle assessment. According to Huang (2004)
“[m]ore than 40% of LCA studies published between 1970 and 1992 are estimated to be
Page 3 of 21Informing Packaging Design Decisions at TMS using LCA
Corti, Early, Kidman, Lee, Geyer, McMullan
concerned with packaging materials.” Several milestones in methodology development
and data collection, from Coca Cola’s Resource and Environmental Profile Analyses
(REPA) in 1969 to the life cycle inventories of the Swiss and German EPAs in the 1990s,
were motivated by and concerned with the environmental impacts of packaging (Klöpfer
2006, BUWAL 1996, UBA 1995). While the scope of contemporary LCAs includes all
imaginable kinds of products and services, the interest in packaging is undiminished,
which can be attributed to the judgment that packaging is “one of the most severely
polluting activities” (Sonneveld 2000).
Even though packaging remains a necessity for containing, protecting, storing, and
sometimes even selling products, there is a growing consensus that due to the severity
of the environmental burdens packaging generates, “[a] packaging system not only
needs to fulfill technical, economical and social requirements but also to minimize the
impact on the environment” (Sonneveld 2000). Today, it is common sense that the
sheer volume of packaging waste is but one aspect of the problem, which has to be
assessed in the context of the environmental impacts from material production,
package manufacturing, distribution logistics and end-of-life management activities. This
is why LCA is the ideal methodology to identify and evaluate the trade-offs between life
cycle stages and environmental concerns.
Nonetheless, LCA remains under-utilized because of the large time and resource
investments required to collect and analyze data, and because of the complexity of LCA
methodology itself (Cooper and Fava 2006). Firms look for clear, cost-effective and
timely approaches when making decisions about packaging management, and
traditional LCA appears poorly suited for this task (Lee and Xu 2005). A comprehensive
LCA can take months to prepare, cost thousands of dollars, and provide data on only
one product rather than the suite of options that are of interest to decision-makers.
Nevertheless, examples of companies using LCA to improve packaging design do exist.
McDonald’s used comprehensive LCA to help managers make environmentally-informed
decisions regarding packaging options in the 1990s. McDonald’s collaborated with the
Environmental Defense Fund (EDF) to assess the environmental and cost tradeoffs of
packaging options for their sandwiches (Svoboda, 1995). McDonald’s was particularly
interested in assessing their clamshell polystyrene packaging, due to intense public
criticism of McDonald’s use of polystyrene (Svoboda, 1995). Franklin Associates Ltd.
performed a comprehensive LCA on the various packaging materials available to
McDonald’s, including polystyrene, paper, paperboard, and quilt wrap (Svoboda, 1995).
While the joint task force of McDonald’s and EDF successfully achieved their goals of
comparing possible packaging options, they did not obtain a decision support tool for
continuous improvement that would enable them to conduct LCAs for future packaging
decisions. McDonald’s management would have to rehire consultants to conduct LCAs
for any future decisions regarding packaging alternatives, costing them significant time
and resources for each LCA.
Page 4 of 21Informing Packaging Design Decisions at TMS using LCA
Corti, Early, Kidman, Lee, Geyer, McMullan
Not surprisingly, companies frequently opt to use simplified assessment tools that offer
quick, approximate results with minimal time and effort required. For example, Wal-
Mart Stores recently implemented a packaging scorecard to reduce packaging impacts
across its global supply chain, helping Wal-Mart and its suppliers improve packaging and
conserve resources (Wal-Mart 2006). The packaging scorecard allows suppliers to input
information and measure their performance against other suppliers based on the “7 R’s
of Packaging”: Remove, Reduce, Reuse, Recycle, Renew, Revenue, and Read (Wal-Mart,
2006). Suppliers receive an overall score relative to other suppliers, as well as relative
scores in each category (Wal-Mart, 2006).
Georgia-Pacific has developed the Packaging Systems Optimization (PSO) tool, which the
company offers as a consulting service to their clients (Georgia Pacific, 2007). With a
goal of effectively pulling together the economic and sustainability goals of client
companies, PSO uses an LCA-like “systems approach” to measure the environmental
impacts and costs throughout clients’ supply chains. PSO shows both attainment of
sustainability goals and cost savings “gained by designing, distributing, and selling
packages that meet sustainability objectives” (Georgia Pacific, 2007).
While both the Wal-Mart scorecard and Georgia-Pacific PSO provide valuable insight,
they also exhibit significant limitations. Wal-Mart’s scorecard is limited in that it
provides no quantification of results and no assurance that environmental
improvements will be achieved. The system is essentially a ‘best practices’ summary,
incapable of capturing trade-offs between environmental impacts at various lifecycle
stages or differentiating between material choices. It is also narrowly limited to
packaging decisions, and provides no guidance on logistics issues, such as altering
shipping routes. Additionally, Wal-Mart’s scorecard must allow greater marketing
discretion, because the tool assesses primary packaging. With primary packaging,
package design decisions must be consider the value added of marketing and aesthetic
design features, which are difficult to measure and largely subjective. Consequently,
decisions at this scale must not be too narrowly constrained by any model. These
constraints prevent Wal-mart’s tool from providing quantification of results.
Georgia-Pacific’s PSO tool provides greater lifecycle and logistics support than the
scorecard, but is provided as a consulting tool to its clients, rather than as an internal
decision-support tool. While large decisions clearly warrant extensive analyses such as
those supported by PSO, it is the small decisions which are too often overlooked, but
which taken together can have profound impacts.
EPIC’s goal is to combine the ease of use of the Wal-Mart scorecard with the robust and
comprehensive LCA analysis of Georgia-Pacific’s PSO. EPIC allows the user to measure
and aggregate environmental impacts and breaks down the impacts by use phase and
impact category. As such, EPIC is able to function as an internal decision-support tool
Page 5 of 21Informing Packaging Design Decisions at TMS using LCA
Corti, Early, Kidman, Lee, Geyer, McMullan
aimed at the day-to-day small decisions TMS managers encounter. In particular, the
EPIC tool focuses on secondary packaging—that which protects a product during
transport but plays no role in the marketing of the product. As such, the only variables
that are necessary to consider are the cost, and whether the package fulfills its duty to
protect the product.
Like PSO, EPIC does not force the user to make decisions based on environmental
considerations alone. Rather, EPIC provides full costing and environmental impacts of
packaging options, and displays results as a clear comparison. If there is a discrepancy
between the cost and environmental performance, the user can make the final decision
after weighing the tradeoffs.
4. SCOPE OF THE EPIC TOOL
In order to reconcile the requirements of TMS with the demands of life cycle
assessment, the Environmental Packaging Impact Calculator (EPIC) was designed to
produce full LCA results from limited user input and expertise. EPIC was crafted with
the explicit goal of creating a simple, user-friendly interface operable by packaging
engineers wholly unfamiliar with LCA theory and practice. In just minutes, EPIC
quantifies and assesses the life cycle environmental impacts and financial costs of
packaging systems at TMS. As such, EPIC can be used as a decision support tool for
packaging engineers to use ‘on-the-fly’ early in the packaging design process. While the
EPIC interface was designed to be user-friendly, the tool rests on a fully articulated LCA
model of the TMS packaging system built in PE International’s GaBi 4 software package.
EPIC thus generates robust scientific analysis and translates it into management-
actionable measures.
Given the specialized role of packaging design engineers at TMS and its suppliers, their
knowledge of the entire TMS packaging system is inherently limited. They are
responsible for package design elements such as material choice and package
dimensions, but exert no further control over the rest of the packaging life cycle.
Packaging engineers cannot be expected to have in-depth knowledge of the entire
logistics network, end-of-life processing, or characteristics of individual facilities
throughout the supply chain.
Through parameterization, EPIC is able to predict all of these logistic and end-of-life
management values based on the information that packaging engineers do know, and
then calculate full LCA results. Therefore, EPIC was built to function entirely from what
limited information packaging engineers have available. This includes:
• number of parts per package
Page 6 of 21Informing Packaging Design Decisions at TMS using LCA
Corti, Early, Kidman, Lee, Geyer, McMullan
• weight of the part being packaged
• weight of materials used for the packaging
• purchase price of the packaging
• type of shipping module
• number of packages that fit in each module
• shipping route: standard or direct
• starting TMS parts center
• distance from supplier to starting parts center
• type of part: accessory or service
• destination of the accessory part
• distance from supplier to the destination facility
Using these inputs, EPIC calculates cradle to grave LCA results for the entire life-cycle of
the packaging system, including phases well beyond package engineers’ purview.
Specifically, the EPIC system boundary encompasses all life cycle stages required to
fulfill an ISO 14040 compliant LCA. Although TMS is not directly responsible for raw
material extraction and other related activities, these have been included within a
cradle-to-gate approach at the production phase. In sum, the boundaries include all
elementary and intermediate flows at each stage in
Figure 1:
Page 7 of 21Informing Packaging Design Decisions at TMS using LCA
Corti, Early, Kidman, Lee, Geyer, McMullan
Figure 1. The EPIC system boundary
After extensive deliberation and consultation with TMS, the one life cycle phase that is
omitted from EPIC is the inventory stage. Inventory activities, such as energy required
to power the storage facility or move parts within the facility were not incorporated
because they were not predicted to have a significant effect on the results of the
comparison between packages. For example, if Package A required significantly less
storage space than Package B, then the TMS storage facility would still require the same
amount of energy to light and cool the space. Additionally, the difference in cost of
labor during the inventory phase between two packages was considered negligible;
therefore, it was not included into the model. Lastly, decisions about the expansion of
facilities, due to an increasing amount of inventory, for example, do not influence
packaging design. TMS will not make a decision on a package design in order to avoid
having to expand their storage facilities to accommodate their growing inventory. Thus,
the environmental impacts associated with expanding the facilities—whether they are
positive or negative—are not accounted for in this model.
The functional unit of the model is defined as the transportation and protection of one
part from supplier to final destination. The reference flow, therefore, is all of the
packaging necessary and logistics components used to achieve the functional unit.
Because most TMS suppliers ship parts to multiple final destinations, EPIC calculates
values such as distance and recycling based on a weighted average of characteristics at
the specific final destination facilities for a given product.
Traditional LCAs are built for a single static product system, and the reference flow can
be calculated and hard-wired into the model. However, EPIC is designed to run a
virtually limitless number of LCAs based on varying packaging systems; the individual
components of the reference flow, therefore, have to be adjustable in EPIC as well. To
achieve this flexibility, EPIC was built on a highly parameterized platform. Based on only
the data supplied by packaging design engineers, EPIC calculates the functional unit and
reference flow through a cascading series of referential parameters.
5. INVENTORY MODELING
EPIC’s major strength is its ability to minimize user effort by automatically adjusting
dozens of parameters, values and settings based on a few user inputs. The LCA model
underlying the EPIC interface includes options for all packaging materials, shipping
modules, and transportation routes and modes used by TMS. When an EPIC user inputs
values for the relevant parameters, only the necessary portions of the underlying model
are activated. For example, the user may input that a particular package requires 2 kg
of corrugated cardboard and 0.2 kg of high density polyethylene (HDPE). These two
Page 8 of 21Informing Packaging Design Decisions at TMS using LCA
Corti, Early, Kidman, Lee, Geyer, McMullan
materials and their accompanying impacts will be activated, while all other materials
remain set to zero.
To achieve this flexibility, EPIC contains two kinds of parameters. The first category is
‘Free Parameters,’ which represent user-defined inputs. Some free parameters include
the weights of various packaging materials, the facility to which a packaged part is first
sent, the type of shipping module used, and the percentage of parts to each facility.
The second category of parameters, ‘Fixed Parameters,’ is pre-programmed into EPIC’s
underlying model. Fixed Parameters can either be constant information (e.g., the
number of shipping modules that fit on a truck), or dependent functions formed from
other parameters (dependent fixed parameters). Examples of fixed parameters
include:
• weight of each module (constant)
• number of each module that fit on a truck (constant)
• % of non-recycled waste that is incinerated (dependent)
• cost of transportation (train and truck) (dependent)
• cost of modules (constant)
• cost of end-of-life processes (dependent)
• types of materials recycled, incinerated, and landfilled at each facility (constant)
EPIC’s dependent fixed parameters are analogous to Excel equations that reference
other cells. Dependent fixed parameters have pre-set data that is activated, de-
activated or scaled by other parameters. For example, the percent of soft plastic in the
packaging system that will be recycled is the sum percent of parts going to facilities that
recycle soft plastic. Similarly, the distance a package is transported is calculated as a
weighted average of the distances to the facilities to which that part travels. In this
case, rather than a simple sum of percentages, it is the sum of each percentage,
multiplied by the distance to that facility, with unused facilities registering as zero.
All data for free and fixed parameters is based on information obtained directly from
TMS. Free parameters are input by the EPIC user. Constant and dependent fixed
parameters have been programmed into EPIC using data gathered from site visits,
database review, system analysis and interviews with TMS environmental, packaging,
and logistics managers.
The ultimate purpose of parameterization is to activate and scale the relevant processes
and materials involved in the life cycle of a single package. Figure 2 shows an example
of how these parameters interact to make EPIC run. Steel used to make shipping
modules, a ‘Process Flow,’ is specifically what generates environmental impacts. The
actual amount of steel required to achieve the functional unit (‘Mod_Steel_Use’) is a
Page 9 of 21Informing Packaging Design Decisions at TMS using LCA
Corti, Early, Kidman, Lee, Geyer, McMullan
function of numerous parameters, both free and fixed. The EPIC user enters the free
parameters, ‘MU_Module’ and ‘Parts_Per_Module,’ activating the kind of shipping
module used (MU) and how many packaged parts fit in that module. These free
parameters trigger the constant fixed parameter, ‘MU_Module_Weight,’ adding in the
weight of that module. This figure is then divided by the parts per module as input by
the user, to arrive at the amount of that particular module necessary to transport one
part. Finally, to determine the amount of module produced and disposed of for this
single trip, ‘Mod_Steel_Use’ divides the amount of module necessary to transport one
part by the lifetime uses of an MU module (in this case, the lifetime uses of an MU
module is 120). This amount is linked to the Process Flow, informing the quantity flow
of a cradle-to-gate ‘steel’ process in the model.
Figure 2. Parameters underlying steel use for shipping modules.
The individual inventory processes used in EPIC are contained within the GaBi 4
software package and accompanying data sets, used to create EPIC’s underlying model.
PE International, the company that manufactures GaBi 4, is an industry leader in life
cycle assessment, and all processes contained in GaBi 4 are fully vetted through external
review and analysis. The processes chosen for EPIC were selected because they most
accurately represent the specific materials, trucks, and processes used in the TMS
packaging system. Geographic location and age of the data also contributed to selection
when multiple options for a single process or material were available. When GaBi 4 did
not contain cradle-to-gate inventory data appropriate to the TMS system, plans
capturing the requisite processes and inventories were built in GaBi 4 and nested within
the larger model. In one case, the process for a particular material—lumber— was not
available in GaBi 4, so the process inventory for ‘rough, dry lumber’ was imported from
U.S. LCI Database (NREL, 2008) an outside life cycle inventory database (i.e. not GaBi 4).
Page 10 of 21Informing Packaging Design Decisions at TMS using LCA
Corti, Early, Kidman, Lee, Geyer, McMullan
All together, EPIC contains complete inventory data for the following material and
process classes:
• Cradle-to-gate process inventories for all materials used in packaging
• Cradle-to-gate process inventories for all materials and processes used to make
shipping modules and pallets
• Inventories for truck and train transportation processes
• Recycling, incineration, and land-filling process inventories specific to each
packaging material
• Inventories for all production processes assumed to be displaced by recycled or
incinerated materials
By linking the inputs from packaging engineers to the parameterized inventory model,
EPIC is able to calculate a full life cycle inventory of the specified packaging system.
6. IMPACT ASSESSMENT
Just as EPIC was built to simplify the user input requirements, EPIC also distills pertinent
results into outputs usable by managers. This process, illustrated in Figure 3, required
that inventories first be analyzed according to normalized environmental impact
indicators. EPIC uses the CML 2001 suite of environmental impact indicators.
Figure 3. Distillation of Life Cycle Inventory Results into TMS Areas of Concern
However, even the CML 2001 impact indicator results were determined to be too
scientifically abstract for the day-to-day decisions that packaging engineers face.
Consequently, it was decided that the impact indicator results and several inventory
results (lead, mercury, hexavalent chromium, cadmium, net resource consumption and
net energy consumption) would be further distilled into TMS’ five major areas of
environmental concern, as identified in TMS’ Environmental Action Plan and 2006 North
American Environmental Report (Toyota, 2006) (Table 1).
Page 11 of 21Informing Packaging Design Decisions at TMS using LCA
Corti, Early, Kidman, Lee, Geyer, McMullan
Table 1: Assignment of LCA Impact Categories to TMS Areas of Environmental Concern
Impact Indicator Categories, and Inventory Flows TMS Area of Concern
CML 2001, Global Warming Potential Climate Change
CML 2001, Abiotic Depletion
Net Energy Consumption Resource Depletion
Net Resource Consumption
CML 2001, Human Toxicity Potential
CML 2001, Terrestric Ecotoxicity Potential
Human Health and Toxicity
CML 2001, Freshwater Aquatic Ecotoxicity Potential
CML 2001, Marine Aquatic Ecotoxicity Potential
CML 2001, Acidification Potential
CML 2001, Photochemical Ozone Creation Potential Air Pollution
CML 2001, Ozone Layer Depletion Potential
Lead, Mercury, Cadmium, Hexavalent Chromium Substances of Concern
Based on requests from TMS Environmental Management, the impact indicator
categories that comprise each area of concern are given equal weight. For example,
the EPIC score for ‘Climate Change’ is comprised entirely of normalized CML 2001,
Global Warming Potential results; whereas the score for ‘Air Pollution’ is comprised of
equal parts normalized CML 2001 Acidification Potential, normalized CML 2001
Photochemical Ozone Creation Potential, and normalized CML 2001 Ozone Layer
Depletion Potential.
The assignment of impact categories into TMS areas of environmental concern
inherently moves the LCA results away from purely scientific and towards value-based
assessments. According to ISO 14044, weighting is optional, and “weighting steps are
based on value-choices and are not scientifically based” (ISO 14044, 2006). If weighting
is used in LCAs, the data and indicator results (pre-weighting) should be provided along
with the weighted results, so the audience can understand the methods behind the
valuation (ISO 14044, 2006). TMS deemed weighting a necessary step in order to allow
non-experts to interpret LCA results with the purpose of informing decisions. Further,
by allowing environmental managers to hard-wire educated valuation into EPIC, TMS is
able to ensure that valuation is codified company-wide and determined by those with
an environmental background.
7. EPIC INTERFACE
The EPIC interface, which was created using PE International’s I-Reports, sits on top of
the underlying TMS packaging system model. Obscuring the view of the actual model, it
nonetheless draws its results directly from the model. Consequently, the simplified EPIC
interface does not present the results of a streamlined LCA, but rather provides full LCA
and LCC results.
Page 12 of 21Informing Packaging Design Decisions at TMS using LCA
Corti, Early, Kidman, Lee, Geyer, McMullan
In order to act as a decision support tool, EPIC calculates side-by-side results of two
packaging systems. As a comparative tool, EPIC easily allows variation in material
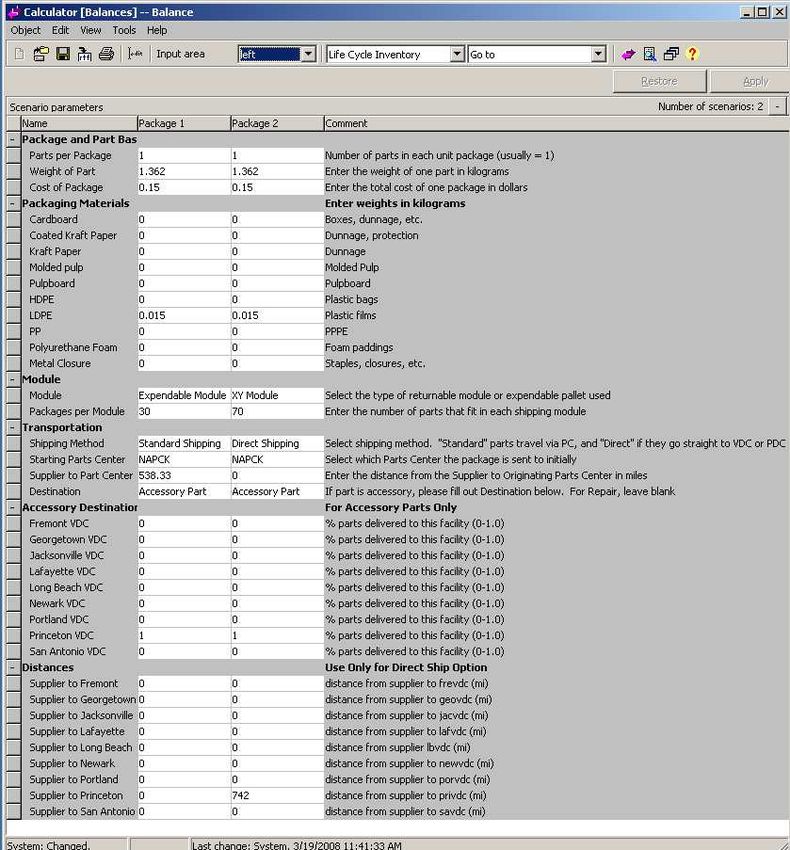
choice, shipping routes, and shipping modules. To operate EPIC, the user enters free
parameter data for the two packaging systems. Figure 4 shows an example of how the
questionnaire appears. The data inputs required by EPIC intentionally mimic the data
TMS management requires from packaging engineers prior to finalizing a package
design, and, therefore, require no additional research from engineers.
Figure 4. Screenshot of EPIC user input screen
Page 13 of 21Informing Packaging Design Decisions at TMS using LCA
Corti, Early, Kidman, Lee, Geyer, McMullan
Running a comparison between two packaging models through the EPIC tool takes
under five minutes.
Because of the simplicity of the graphs, a rough interpretation of the results can take as
little as a few seconds. Once the data has been input, user hits he ‘Apply’ button and is
immediately provided the option of viewing the results of the comparison in four
different formats: Life Cycle Results, Life Cycle Stage Results, Life Cycle Inventory and
Life Cycle Impact Assessment. Each page gives progressively more detailed information
about the environmental impacts and financial costs associated with the packaging
design choices.
The Lift Cycle Results page gives the most basic and easily understandable results for
both the LCA and LCC (see Figure 5), and will be referenced most commonly used by
EPIC users. The results are divided into the following sections:
• Life Cycle Cost Comparison (USD): a table showing the total cost of the two
packaging options over the course of their lifetimes, including materials,
manufacturing, transportation, logistics, and end-of-life.
• Environmental Indicator Comparison: a table and histogram showing the
environmental harm the two packaging options cause with respect to three of
TMS’ targeted environmental areas of concern: Air Pollution, Global Warming
and Human Health and Toxicity. Results are normalized to U.S. data.
• Substances of Concern: a table and histogram showing the impacts of the
packaging options on TMS’ four substances of concern: cadmium, hexavalent
chromium, lead, and mercury (measured in kilograms).
To facilitate analysis, EPIC displays color coded results. Green signifies that Package 2
results are at least 10% better than Package 1 results; red signifies that Package 2 results
are at least 10% worse. If the difference is less than 10% in either direction the results
are not highlighted, though values are still displayed.
Page 14 of 21Informing Packaging Design Decisions at TMS using LCA
Corti, Early, Kidman, Lee, Geyer, McMullan
Figure 5. Life Cycle Results page, which shows the results for Life Cycle Costing, Air Pollution, Global
Warming, Health and Human Toxicity, and Substances of Concern.
In addition to providing aggregated scores for each TMS Area of Concern, EPIC also
provides results differentiated by life-cycle stage: package and module manufacture,
Page 15 of 21Informing Packaging Design Decisions at TMS using LCA
Corti, Early, Kidman, Lee, Geyer, McMullan
transportation, and end-of-life. Packaging engineers and logistics managers can
determine which life-cycle stage contributes the most to environmental or cost burdens,
and make strategic changes that maximize improvements while reducing effort and
cost.
Additionally, EPIC provides a full Life Cycle Inventory and Life Cycle Impact Assessment.
These sets of results will likely not be used by packaging engineers, but provide the
capacity for TMS environmental managers to conduct ISO 14040/14044 compliant LCAs.
As with any tool, there is a possibility that user error could occur. To ensure the
robustness of EPIC, a sensitivity analysis of the model’s parameters was conducted. The
analysis assessed impact on final LCA results in the CML suite of indicators that result
from minor errors in user input values (package material weights and percent of parts to
each final location). For one case study a Monte Carlo analysis using GaBi4’s sensitivity
analysis feature was performed. The bounds of uncertainty were defined as plus or
minus ten percent for those parameters that may see higher rates of user error, and
1000 iterations were run. The results, shown in Figure 6, indicate that the model is not
sensitive to minor user input errors for any particular parameter. Qualitatively, the
results did not change for any environmental impact category evaluated.
4.00E-13
Old Packaging
3.50E-13 New Packaging
3.00E-13
2.50E-13
2.00E-13
1.50E-13
1.00E-13
5.00E-14
0.00E+00
CML2001, Abiotic CML2001, CML2001, CML2001, CML2001, Global CML2001, Human CML2001, Human CML2001, Ozone CML2001, CML2001, CML2001,
Depletion (ADP) Acidification Eutrophication Freshw ater Warming Potential Toxicity Potential Toxicity Potential Layer Depletion Photochem. Radioactive Terrestric
Potential (AP) Potential (EP) Aquatic (GWP 100 years) (HTP inf.) (HTP inf.) Potential (ODP, Ozone Creation Radiation (RAD) Ecotoxicity
Ecotoxicity Pot. steady state) Potential (POCP) Potential (TETP
(FAETP inf.) inf.)
Figure 6. Sensitivity analysis of user input parameters
Page 16 of 21Informing Packaging Design Decisions at TMS using LCA
Corti, Early, Kidman, Lee, Geyer, McMullan
In addition to providing visual simplicity, the EPIC interface also protects TMS’
proprietary information. EPIC is built to keep all proprietary data hidden from the user
in a virtual ‘black box.’ The model, calculations, and data itself are concealed within the
software, allowing the tool to safely reflect proprietary TMS information while
simultaneously protecting it. As a result, EPIC can be shared with independent partners
and any other TMS affiliated packaging engineers that design package systems.
8. IMPLEMENTATION
Currently, suppliers submit packaging designs and a packaging information sheet to the
TMS packaging group for review and information sharing. The information sheet lists
several details about the packaging, but contains no environmental or life cycle
assessment. The TMS packaging group then reviews the packaging design and suggests
adjustments or alternatives as necessary. .
TMS plans to implement the EPIC Tool on two levels within existing procedures. The
first is to distribute the EPIC tool with the existing Supplier Guidebook. To harmonize
the procedures, the packaging information sheet that independent suppliers normally
fill out will be reformatted to mimic the input to the EPIC Tool. The EPIC results from
final packaging design and alternative designs will be submitted with the packaging
information sheet. The second level is use of the EPIC tool by the TMS packaging
engineers, logistics managers, and environmental managers, for internal planning and
evaluation of packaging changes and options, as well as communicating the benefits and
changes from packaging improvements. This will add environmental considerations
alongside other packaging considerations in an existing framework.
9. CASE STUDY
To reduce environmental impacts and life cycle costs, TMS changed the shipping route
and module used to ship Sequoia model floor mats in 2007. EPIC has been used to
determine whether the new Sequoia floor mat packaging system did, indeed, lead to
reduced environmental impacts and costs.
Previously, floor mats were individually packaged in low density polyethylene plastic
bags, and shipped in expendable shipping modules made of cardboard, wood, and nails,
through the standard TMS supply chain route (supplier to national parts center to
vehicle distribution center.) After the change, floor mats continue to be individually
packed in the low density polyethylene bags, but are now shipped in reusable shipping
modules made of high density polyethylene plastic, along a direct shipping route
(supplier to vehicle distribution center.) The modules are then shipped back to the
supplier after use.
Page 17 of 21Informing Packaging Design Decisions at TMS using LCA
Corti, Early, Kidman, Lee, Geyer, McMullan
Given these circumstances, the following user inputs (‘independent parameters’) were
entered into EPIC (Table 2):
Table 2. EPIC data inputs for the change in Sequoia model floor mat packaging.
Package 1 Package 2
Package and Part Basics
Parts per Package 1 1
Weight of Part (kg) 1.362 1.362
Cost of Package ($) $0.15 $0.15
Packaging Materials
LDPE (kg) 0.15 0.15
Module
Module Expendable Module XY Module (Plastic)
Packages per Module 30 70
Transportation
Shipping Method Standard Shipping Direct Shipping
National Parts Center (if standard ship) NAPCK n/a
Supplier to Part Center distance (if standard 538.33 n/a
ship)
Destination Accessory Part Accessory Part
Accessory Destination
Princeton VDC (%) 100% 100%
Distances (if direct ship)
Supplier to Princeton (miles) n/a 741.61
The independent parameters input in Table 2 trigger dependent and constant
parameters built into EPIC’s underlying TMS supply chain model. ‘Expendable Module,’
activates underlying parameters specifying that expendable modules cost $20, and are
used once and then recycled. ‘XY Module’ (plastic) activates relevant background data
that plastic module are used two to three times per month, have a life expectancy of
five years, and cost $160. Each of these costs is scaled according to the number of parts
in that module and the number of trips each module completes in its life. Further,
logistic parameters are activated, such as those indicating that a filled standard TMS
truck (53’) holds 120 expendable modules or 78 plastic returnable modules. End-of-life
parameters are also calculated, including one specifying that the vehicle distribution
center to which all floor mats are shipped, Princeton VDC, recycles 100% of wood
pallets, paper, low and high density polyethylene plastics, and landfills all remaining
waste.
EPIC results confirm that the new packaging system does reduce environmental burdens
in all five ‘Areas of Concern,’ including an 88% reduction in lead use, 89% reduction in
mercury, and an 80% decrease in human health and toxicity potential. The new
Page 18 of 21Informing Packaging Design Decisions at TMS using LCA
Corti, Early, Kidman, Lee, Geyer, McMullan
packaging system also generates a cost savings of $0.72 per floor mat. Table 3 provides
a comprehensive list of LCA and LCC results.
Table 3. LCC and LCA results for the change in Sequoia model floor mat packaging. LCA Results for the 3
Areas of Concern have been normalized to U.S. Data.
Percent
Package 1 Package 2 improvement
Life Cycle Cost
Cost [$] $1.29 $0.58 55%
LCA: 3 Areas of Concern
Air Pollution 2.07E-14 1.18E-14 43%
Global Warming 5.01E-14 2.93E-14 41%
Hum. Health & Toxicity 7.08E-14 1.44E-14 80%
Natural Resource Depletion
Resource Use (kg) 3.41E+00 1.58E+00 54%
Substances of Concern
Cadmium [kg] 2.53E-08 1.25E-08 51%
Chromium [kg] 2.07E-09 2.88E-09 -39%
Lead [kg] 1.63E-07 1.93E-08 88%
Mercury [kg] 6.05E-09 6.60E-10 89%
Analysis of Life Cycle Stage results show improvements in almost all life cycle stages.
Among the notable Life Cycle Impact Assessment results, EPIC shows that the new
packaging system results in a decrease in carbon dioxide equivalent (CO2eq) of 0.6 kg,
per floormat set. Given that TMS sold over 9 million vehicles in 2007, if a similar gain
could be made for each vehicle, this decrease would be estimated to lead to overall
reductions of over 5,000 metric tons of CO2eq.
10. CONCLUSION
EPIC’s highly parameterized format allows packaging design engineers at Toyota Motor
Sales to run full Life Cycle Assessments and Life Cycle Costing for a virtually limitless
number of packaging options. Its simple, easy to use interface reduces the chance for
user error, and improves the flow of environmental information through the TMS
packaging supply chain such that packaging design engineers will be able to actively
base design decisions on robust scientific information. TMS views implementation of
EPIC as an important step in establishing a quantitative component in their efforts to
green their supply chain, as well as a unique opportunity to integrate science with
progressive management strategies.
11. REFERENCES
Page 19 of 21Informing Packaging Design Decisions at TMS using LCA
Corti, Early, Kidman, Lee, Geyer, McMullan
1. Associaton Francaise de Normalisation. 2006. ISO 14044: Environmental
management – Life cycle assessment – Requirements and guidelines
2. Cooper, Joyce Smith and James A. Fava. Fall 2006. Life-Cycle Assessment
Practitioner Survey: Summary of Results. Journal of Industrial Ecology 10 (4): 12-
14
3. Georgia Pacific. Georgia-Pacific Packaging Systems Optimization, viewed 3/18/08
at: http://www.gp.com/packaging/pso/index.html#
4. Goetz, Samantha. April 2005. Reusable Packaging Streamlines supply, cuts waste.
IMPO
5. Gonzalez-Torre, Pilar L. 2004. Environmental and reverse logistics policies in
European bottling and packaging firms. International Journal of Production
Economics
6. Hekkert, Marko P., Dolf J. Gielen, Ernst Worrell, and Wim C. Turkenburg. 2000.
Wrapping up greenhouse gas emissions: an assessment of GHG emission
reduction related to efficient packaging use. Journal of Industrial Ecology 1 (5):
55-75
7. Huang, Chien-Chung and Hwong-Wen Ma. 2004. A multidimensional
environmental evaluation of packaging materials. Science of the Total
Environment 324: 161–172
8. Klöpfer, W. 2006. The Role of SETAC in the Development of LCA, Int. J of LCA
Special Issue 1 (2006), pp116-122
9. Lee, S.G. and X Xu. 2005. Design for the environment; life cycle assessment and
sustainable packaging issues. International Journal of Environmental Technology
and Management 5 (1)
10. Miettinen, Pauli and Raimo P. Hamalainen. 1997. How to benefit from decision
analysis in environmental life cycle assessment (LCA). European Journal of
Operational Research 102: 279-294
11. National Renewable Energy Laboratory. Life Cycle Inventory Database. Viewed
03/19/08 at http://www.nrel.gov/lci/database/default.asp
12. Rebitzer, Gerald and Kurt Buxmann. 2005. The role and implementation of LCA
within life cycle management at Alcan. Journal of Cleaner Production 13: 1327-
1335
13. Ross, Stuart and David Evans. 2003. The environmental effect of reusing and
recycling a plastic-based packaging system. Journal of Cleaner Production 11:
561-571
Page 20 of 21Informing Packaging Design Decisions at TMS using LCA
Corti, Early, Kidman, Lee, Geyer, McMullan
14. SAEFL. 1998. Life Cycle Inventories for Packagings. Swiss Agency for the
Environment, Forests and Landscape
15. Sonneveld, Kees. 2000. The role of life cycle assessment as a decision support
tool for packaging. Packaging Technology and Science 13: 55-61
16. Svoboda, Susan and Stuart Hart. 1995. McDonald’s: Case B1. National Pollution
Prevention Center for Higher Education. Viewed 03/18/08 at:
http://www.umich.edu/~nppcpub/resources/compendia/CORPpdfs/CORPcaseB
1.pdf
17. Toyota North America Environmental Report. 2006. Viewed 11/5/07 at:
http://www.toyota.com/about/our_commitment/environment/2006environme
ntalreport.pdf
18. UBA. 1996. Life-cycle assessments of drinks packaging systems, 19/96,
Umweltbundesamt (UBA), Berlin, Germany
19. Walmart. Wal-Mart Pledges Packaging Reduction, viewed 03/18/08 at:
http://walmartstores.com/GlobalWMStoresWeb/navigate.do?catg=677
20. Zabaniotou, A. and E. Kassidi. 2003. Life cycle assessment applied to egg
packaging made from polystyrene and recycled paper. Journal of Cleaner
Production 11: 49-559
Page 21 of 21You can also read